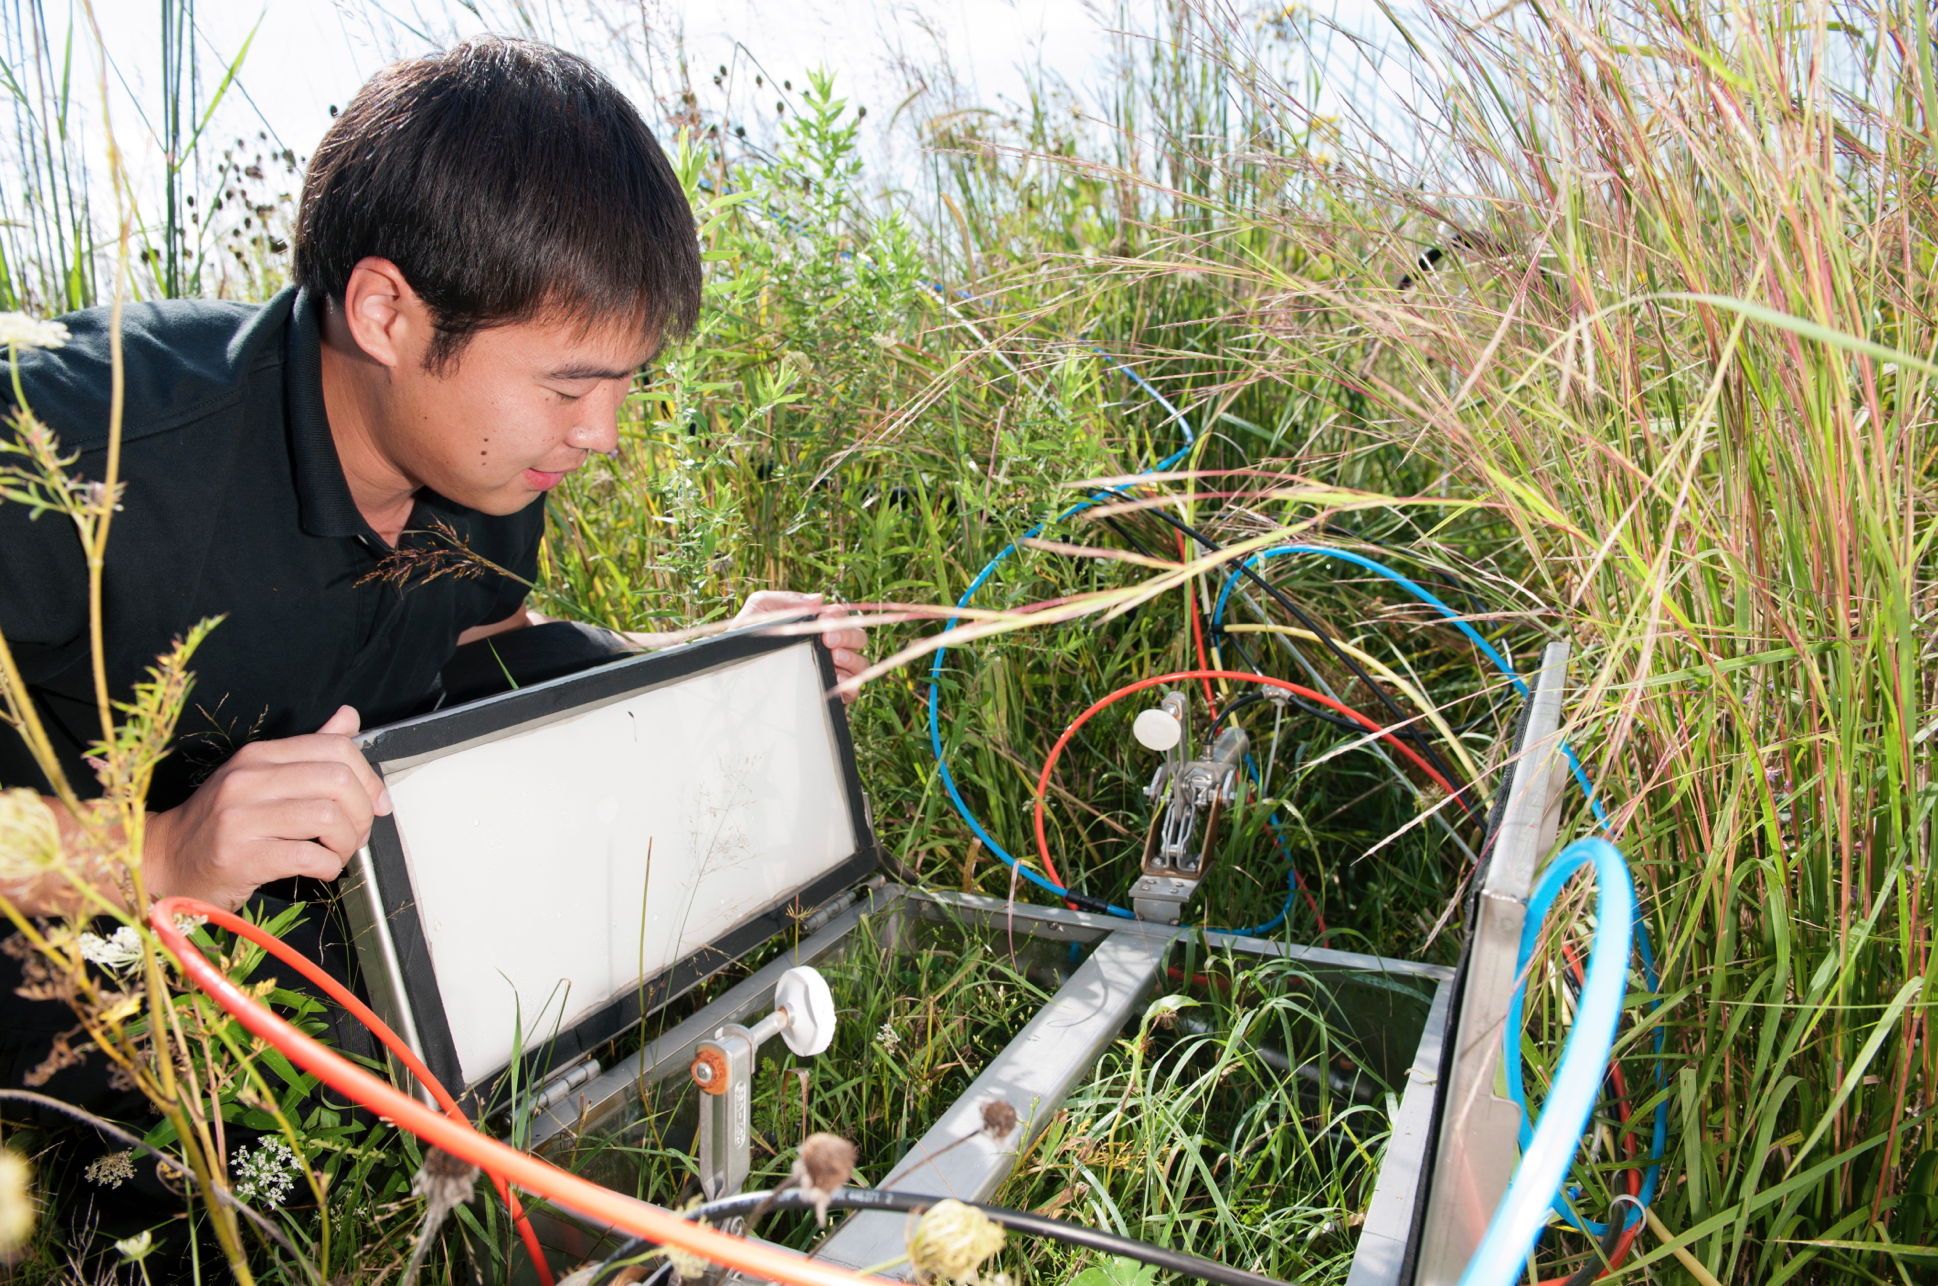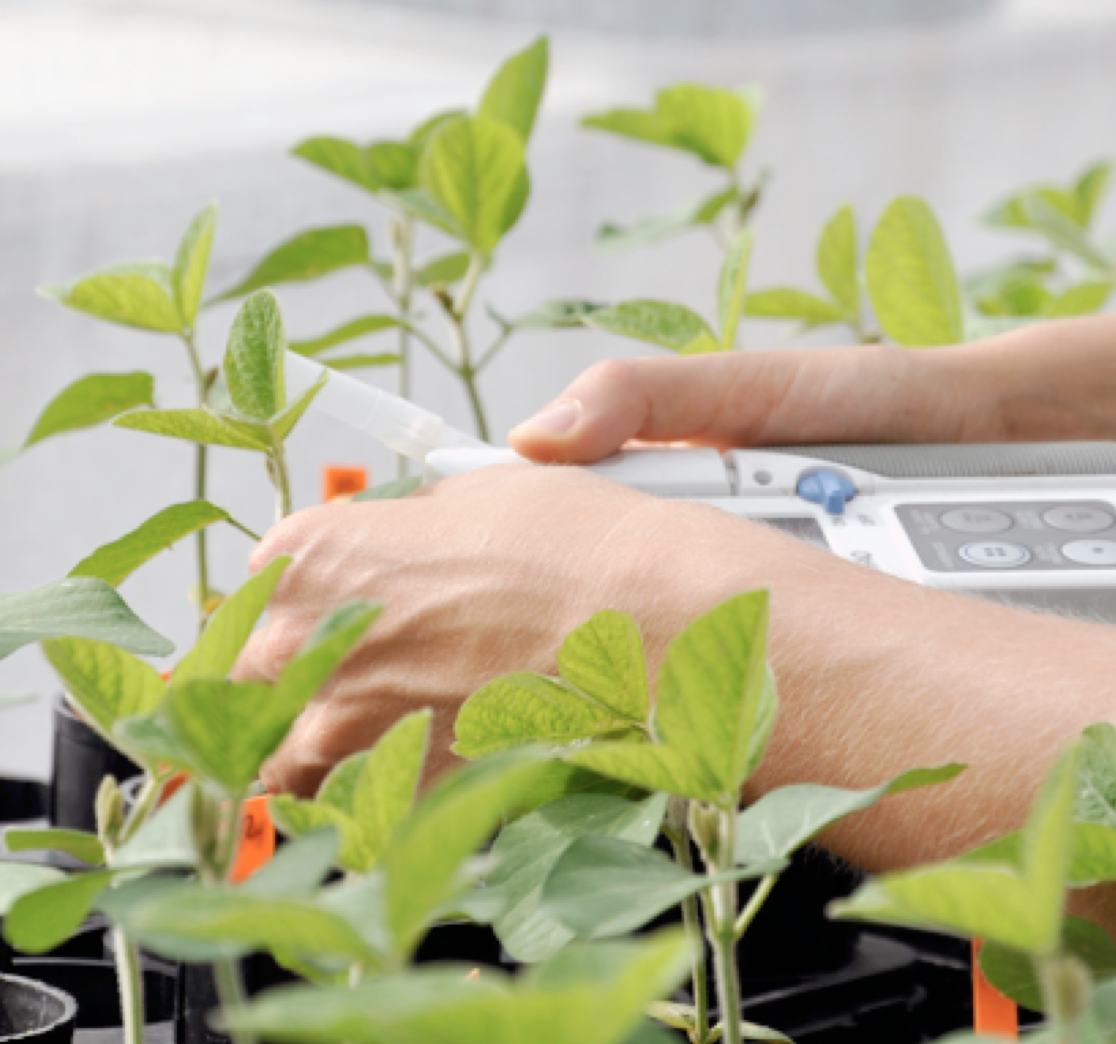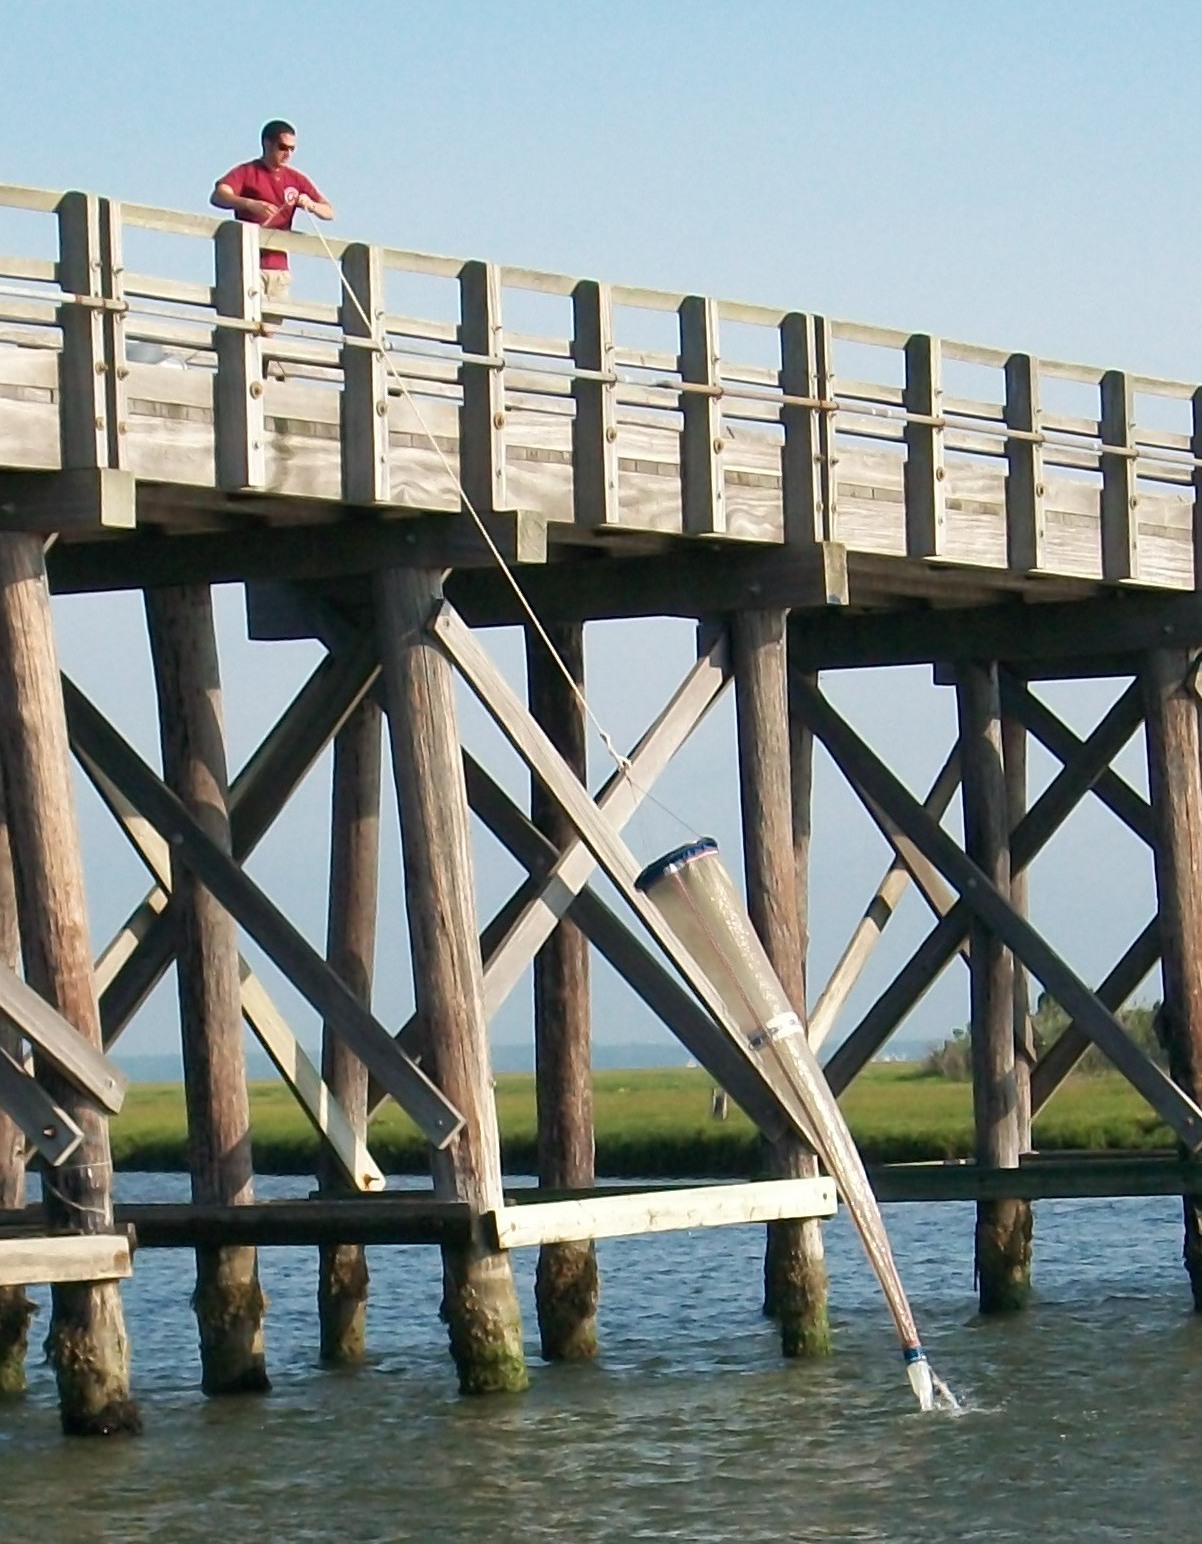
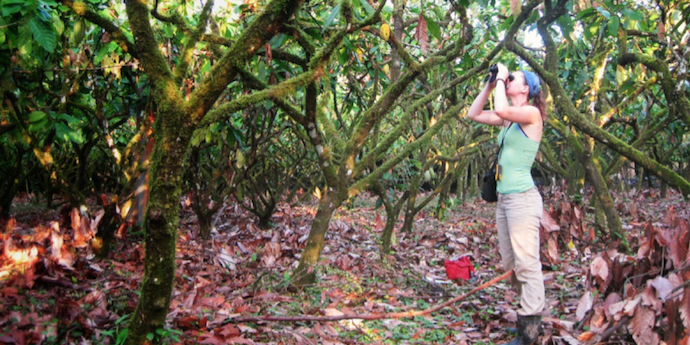
Figure 1: Scientist Finiguerra collecting copepods at the New Jersey experimental site.
The activities are as follows:
- Teacher Guide
- Student activity, Graph Type A, Level 4
- Student activity, Graph Type B, Level 4
- Student activity, Graph Type C, Level 4
- Grading Rubric
Phytoplankton are microscopic algae that form the base of all aquatic food chains. While organisms can safely eat most phytoplankton, some produce toxins. When these toxic algae reach high population levels it is known as a toxic algal bloom. These blooms are occurring more and more often across the globe – a worrisome trend! Toxic algae poison animals that eat them, and in turn, humans that eat these animals. For example, clams and other shellfish filter out large quantities of the toxic algae, and the toxic cells accumulate in their tissues. If humans then eat these contaminated shellfish they can become very sick, and even die.
One reason the algae produce toxins is to reduce predation. However, if predators feed on toxic prey for many generations, the predator population may evolve resistance, by natural selection, to the toxic prey. In other words, the predators may adapt and would be able to eat lots of toxic prey without being poisoned. Copepods, small crustaceans and the most abundant animals in the world, are main consumers of toxic algae. Along the northeast coast of the US, there is a toxic phytoplankton species, Alexandrium fundyense, which produces very toxic blooms. Blooms of Alexandrium occur often in Maine, but are never found in New Jersey. Scientists wondered if populations of copepods that live Maine were better at coping with this toxic prey compared to copepods from New Jersey.
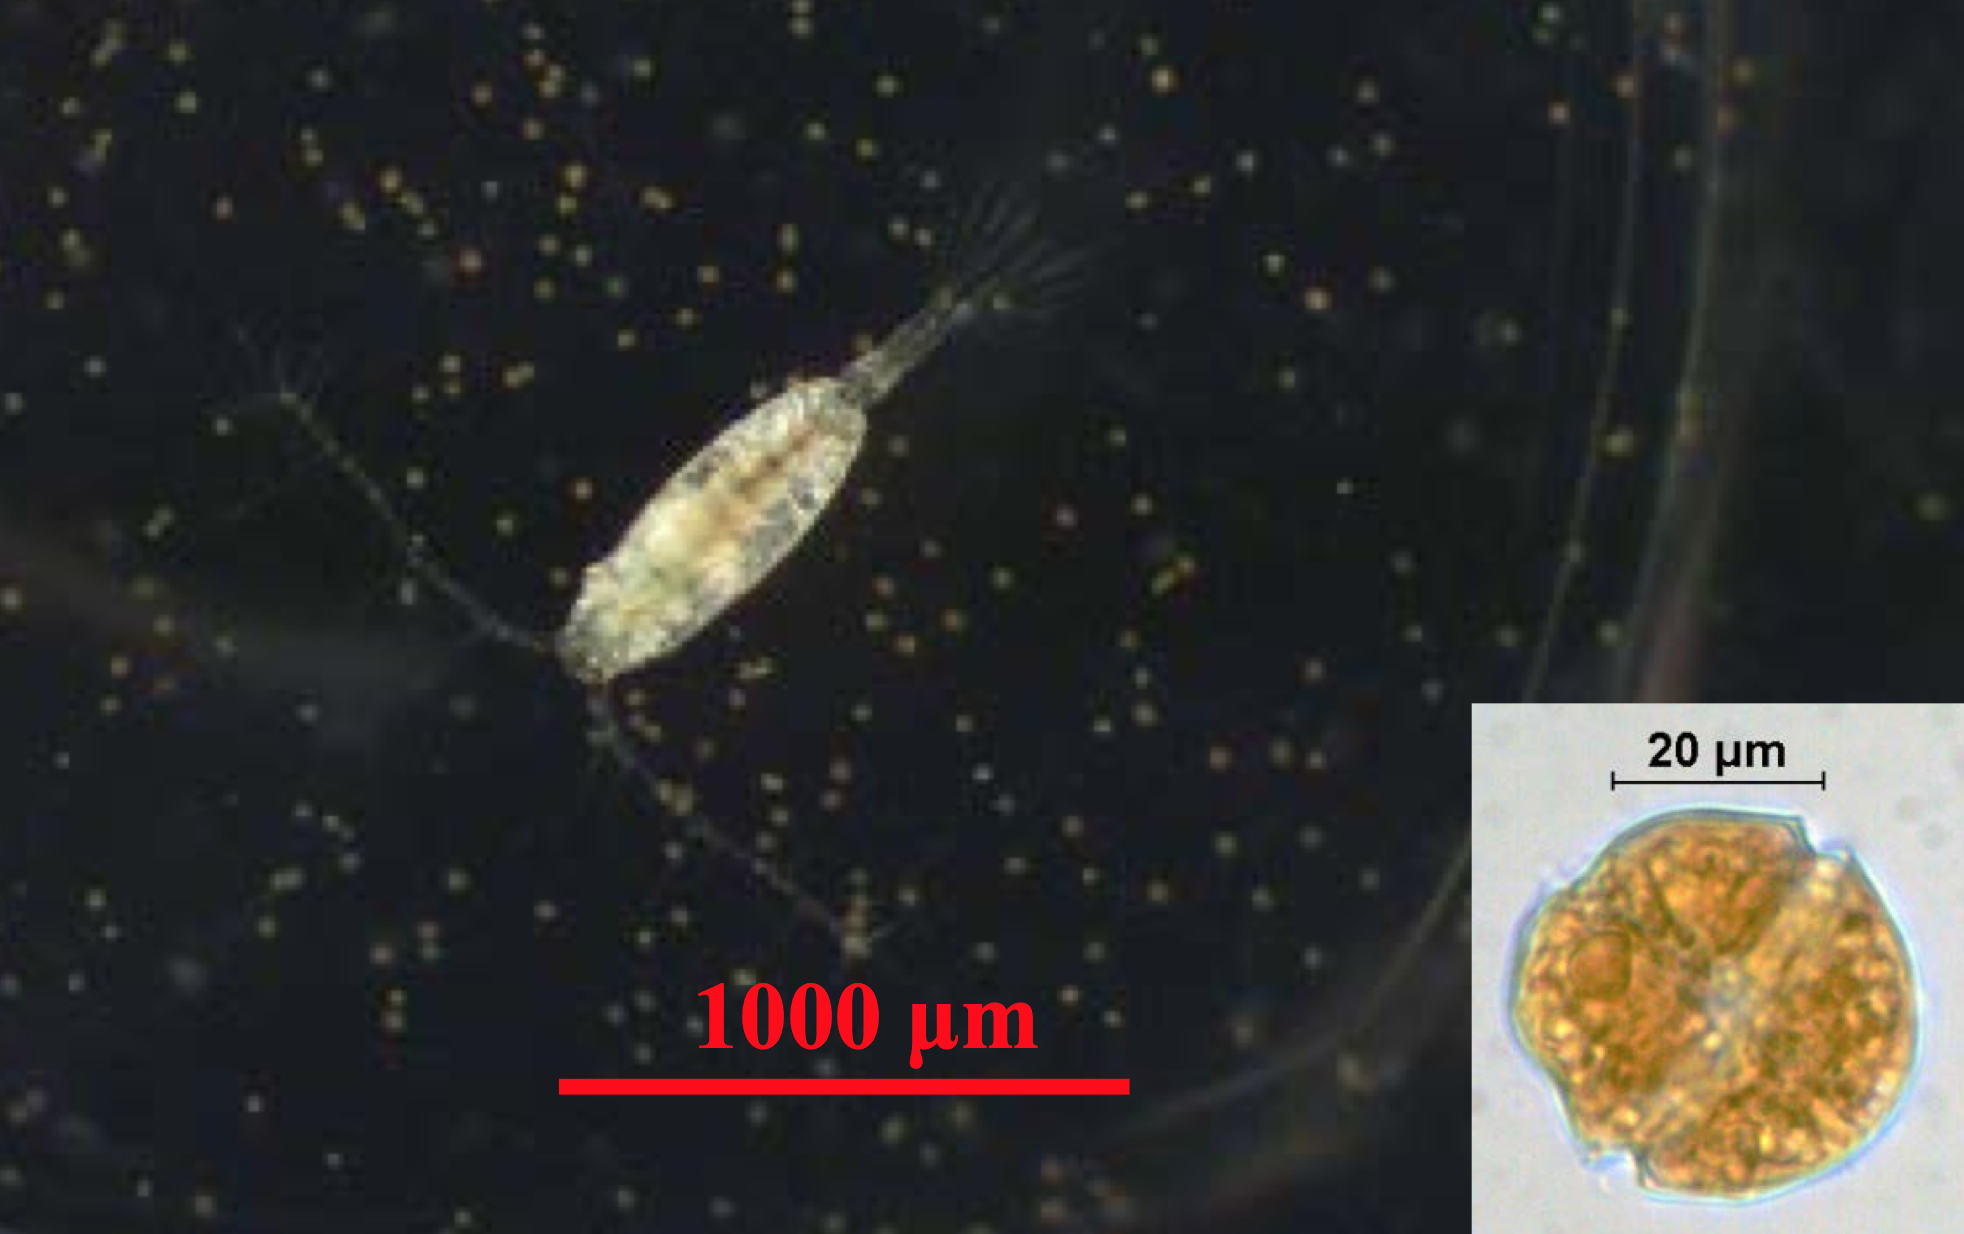
Figure 2: A photograph of a copepod (left) and the toxic alga Alexandrium sp. (right).
Scientists tested whether copepod populations that have a long history of exposure to toxic Alexandrium are adapted to this toxic prey. To do this, they raised copepods from Maine (long history of exposure to toxic Alexandrium) and New Jersey (no exposure to toxic Alexandrium) in the laboratory. They raised all the copepods under the same conditions. The copepods reproduced and several generations were born in the lab (a copepod generation is only about a month). This experimental design eliminated differences in environmental influences (temperature, salinity, etc.) from where the populations were originally from.
The scientists then measured how fast the copepods were able to produce eggs, also called their egg production rate. Egg production rate is an estimate of growth and indicates how well the copepods can perform in their environment. The copepods were given either a diet of toxic Alexandrium or another diet that was non-toxic. If the copepods from Maine produced more eggs while eating Alexandrium, this would be evidence that copepods have adapted to eating the toxic algae. The non-toxic diet was a control to make sure the copepods from Maine and New Jersey produced similar amounts of eggs while eating a good food source. For example, if the copepods from New Jersey always lay fewer eggs, regardless of good or bad food, then the control would show that. Without the control, it would be impossible to tell if a difference in egg production between copepod populations was due to the toxic food or something else.
Featured scientists: Michael Finiguerra and Hans Dam from University of Connecticut-Avery Point, and David Avery from the Maine Maritime Academy
Flesch–Kincaid Reading Grade Level = 10.6
There are three scientific papers associated with the data in this Data Nugget. The citations and PDFs of the papers are below.
Colin, SP and HG Dam (2002) Latitudinal differentiation in the effects of the toxic dinoflagellate Alexandrium spp. on the feeding and reproduction of populations of the copepod Acartia hudsonica. Harmful Algae 1:113-125
Colin, SP and HG Dam (2004) Testing for resistance of pelagic marine copepods to a toxic dinoflagellate. Evolutionary Ecology 18:355-377
Colin, SP and HG Dam (2007) Comparison of the functional and numerical responses of resistant versus non-resistant populations of the copepod Acartia hudsonica fed the toxic dinoflagellate Alexandrium tamarense. Harmful Algae 6:875-882
 About Skye: As a child Skye was always asking why; questioning the behavior, characteristics, and interactions of plants and animals around her. She spent her childhood reconstructing deer skeletons to understand how bones and joints functioned and creating endless mini-ecosystems in plastic bottles to watch how they changed over time. This love of discovery, observation, questioning, and experimentation led her to many technician jobs, independent research projects, and graduate research study at Purdue University. At Purdue she studies the factors influencing oak regeneration after ecologically based timber harvest and prescribed fire. While Skye’s primary focus is ecological research, she loves getting to leave the lab and bring science into classrooms to inspire the next generation of young scientists and encourage all students to be always asking why!