Guppies on the move

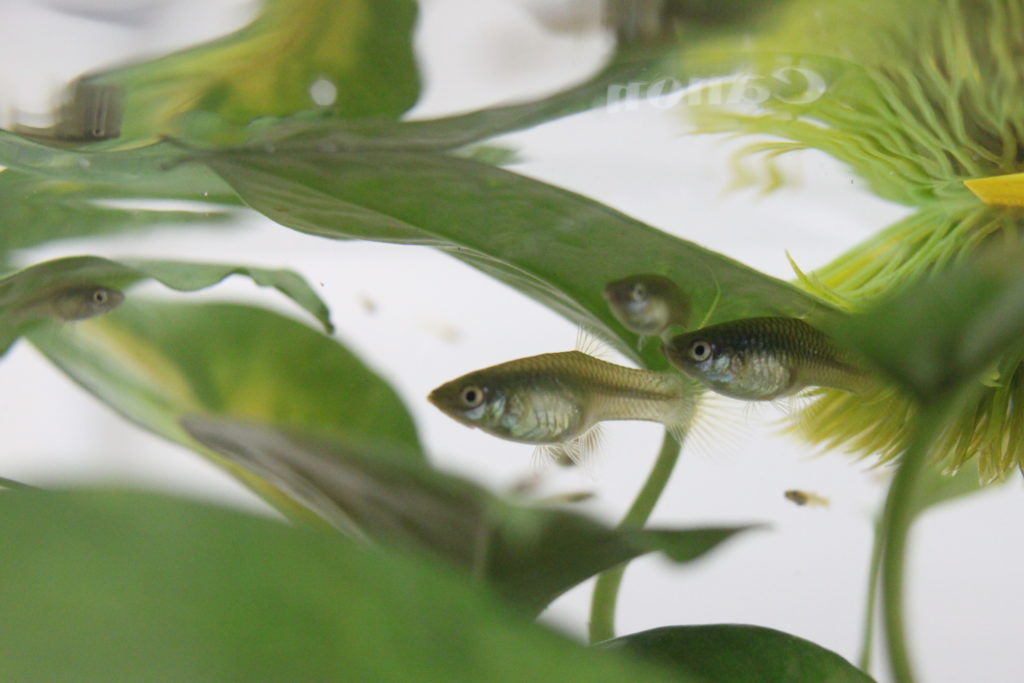
Guppies in the lab. Photo Credit: Eva Fischer.

The activities are as follows:

  • Teacher Guide
  • Student activity, Graph Type A, Level 3
  • Student activity, Graph Type B, Level 3
  • Student activity, Graph Type C, Level 3
  • Grading Rubric

Animal parents often choose where to have their offspring in the place that will give them the best chance at success. They look for places that have plentiful food, low risk of predation, and good climate.

Even though parents pick out these spots, individuals often move away from their birthplace at some point in their lives. Why do animals move away? There are risks that come with moving from one place to another. It can be dangerous to go through unknown places – potentially stumbling into predators or being exposed to diseases. But there can also be benefits to moving, such as discovering a better spot to live as an adult, finding mates, and spreading out to reduce competition.

As someone who loves to travel and has lived in four different countries, Isabela can relate! Isabela likes to see new places, try new foods, and learn new languages. But there can be drawbacks, and occasionally she finds it hard to be in a completely new place. Sometimes people don’t understand her accent, or she can’t understand them. She also misses her family when she is away. Knowing that traveling and moving can have such highs and lows for herself, Isabela wanted to know more about what motivates animals to seek out new places.

To follow her curiosity, Isabela found a graduate advisor who was also interested in animal movement. She joined Sarah’s lab because she had already collected data on the movement of small tropical fish called guppies. Sarah is part of a large collaborative project, where researchers from all over the world come together in Trinidad to study these fish populations.

When Sarah first started collecting data in this system, she wanted to track how far guppies move from one place to the next. She used established protocols from previous work in this system to set up a study. With the help of a team, she captured every fish in two similar streams for replication. Every fish that was caught was marked with a small tattoo so the research team could recognize it if it was found again in the future. She did this same procedure every month for 14 months. Each time she sampled the fish, she recorded the individuals that she found and where they were found.

Isabela used this dataset to ask whether guppies benefit from moving from one place to another. In this study, she focused on one type of benefit: having a higher number of offspring. It is through reproduction that animals are able to pass on their genes, so the more offspring an individual fish has, the more successful it is.

First, Isabela used the existing dataset to find out how far each fish moved: if Fish 1 was captured in Portion A of a stream in February and then in Portion B of the same stream in March, Isabela knew it had to move from A to B. She could use the timepoints to estimate how far each individual had traveled that month.

Second, Isabela used genetics to find out how many offspring each fish had. She looked at genetic markers to determine familial relationships between individuals in each stream. For example, two fish that shared 50% of their genes were probably a parent and an offspring. In this case, the older individual would be marked as the parent. Isabela used the genetic information to build a pedigree, or a chart that documents each generation of a population. That way she could track how many offspring each parent had produced.

She used these data to answer her question on whether there are benefits to traveling more. Isabela also wanted to compare whether the potential benefits of dispersal differed across the sexes. Males have to compete for females in order to mate. Isabela wanted to know if males that moved more were able to mate with more females and have more offspring.

Featured scientist:

Featured scientists: Isabela Borges (she/her) and Sarah Fitzpatrick (she/her) from the Kellogg Biological Station at Michigan State University.

Flesch–Kincaid Reading Grade Level = 

Additional teacher resources related to this Data Nugget include:

Poop, poop, goose!

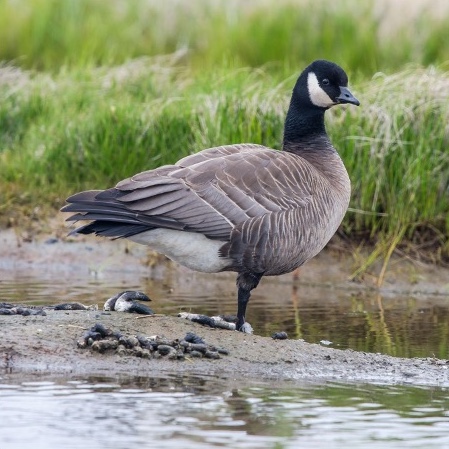
Cackling Goose next to a pile of goose poop, or feces
Cackling Goose next to a pile of goose poop, or feces. Photo by Andrea Pokrzywinski.

The activities are as follows:

Each spring, millions of birds return to the Yukon-Kuskokwim Delta. This delta is where two of the largest rivers in Alaska empty into the Bering Sea. It is also one of the world’s most significant habitats for geese to breed and raise their young. 

With all these geese coming together in one area, they create quite a mess – they drop tons of poop onto the soil. So much poop in fact, that scientists wonder whether poop from this area in Alaska could have a global impact! Climate change is a worldwide environmental issue that is caused by too many greenhouse gasses being released into our atmosphere. Typically, we think of humans as the cause of this greenhouse gas release, but other animals can contribute as well. 

When poop falls onto the soil it is decomposed by bacteria. Bacteria release methane (CH4), a potent greenhouse gas. The more geese there are, the more poop they will produce and the more food there will be for soil bacteria. By increasing the amount of greenhouse gasses that are released by soil bacteria, geese might actually indirectly contribute to global climate change.

Trisha is an ecosystem ecologist who scoops goose poop for research projects. Her research is looking into whether animals, other than humans, can change the carbon cycle. Trisha teamed up with Bonnie, a fellow ecosystem ecologist. Bonnie studies how matter moves between the living parts of the environment, such as plants and animals, and the nonliving parts. She is especially interested in how bacteria in the soil play a role in the carbon cycle.

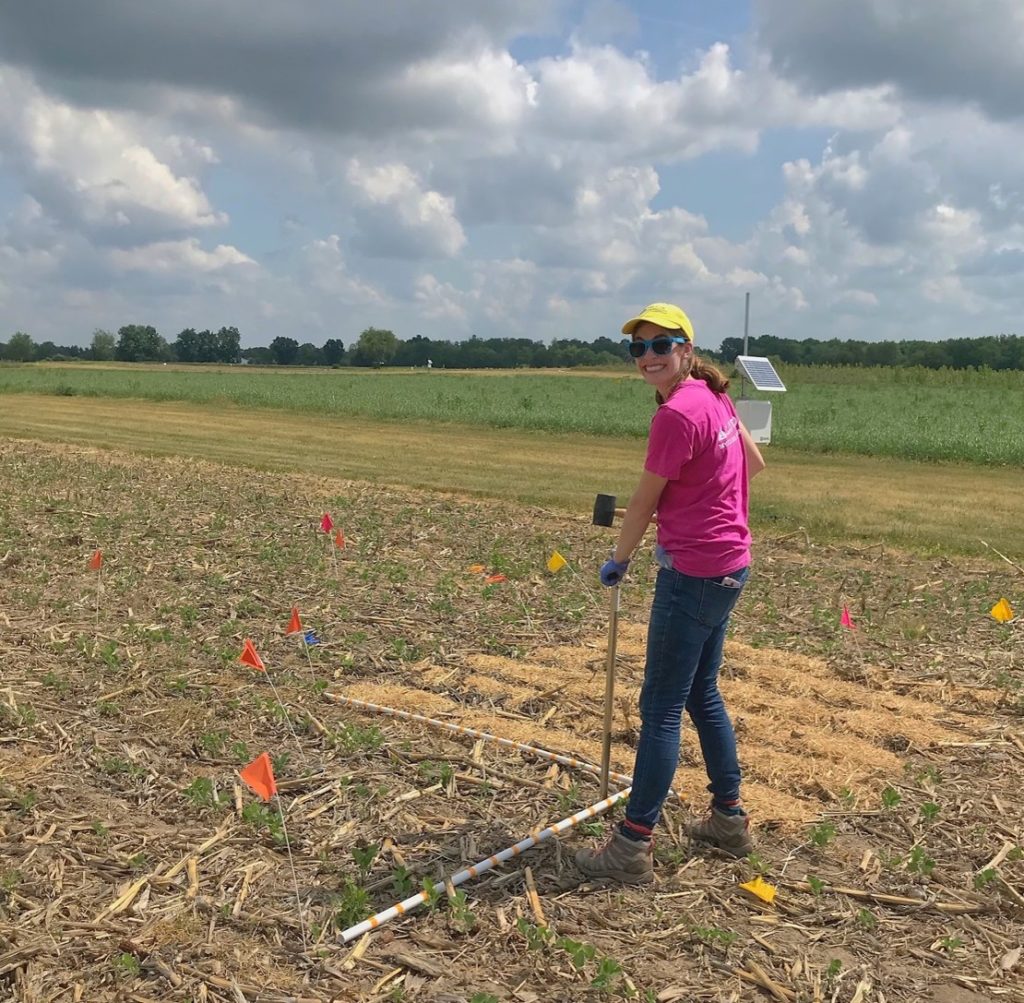
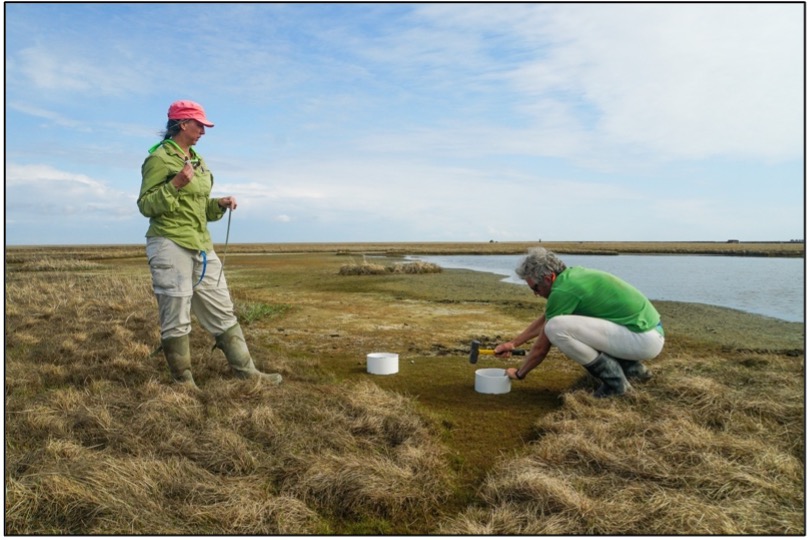
Together, the team designed a three-year project to figure out the effects of goose poop on the carbon cycle. Each summer, a large team of researchers spend 90 days camping on remote sites near the Yukon-Kuskokwim Delta. The team scooped up poop from nearby goose habitats to use in their experiments. They set up six control plots where they added no poop and six treatment plots where they added poop. From these twelve plots, the team measured methane emissions from the soil. Methane was measured as methane flux in micromoles, or µM. These data helped them determine how ecosystems respond to geese by measuring whether goose poop affects methane production by soil bacteria.  

Featured scientists: Trisha Atwood of Utah State University and Bonnie Waring of Imperial College. Written by Andrea Pokrzywinski.

Flesch–Kincaid Reading Grade Level = 8.7

Additional teacher resources related to this Data Nugget include:

Sink or source? How grazing geese impact the carbon cycle

Tricia (left) installing carbon dioxide plots in the field.

The activities are as follows:

“If it wasn’t for the geese, you and I would not be here today because our ancestors would not have made it. When long, hard winters emptied people’s food caches early, starvation loomed. Return of geese in April saved us.” – Chuck Hunt, born and raised on the Yukon-Kuskokwim Delta

Spring geese are an essential food source for subsistence communities like Chevak, Alaska. Elders in western Alaska Native communities have observed a decrease in geese returning to their villages over time. These changes affect the local communities and could also affect the local ecosystem.

One way geese change their environment is by eating grass. In the Yukon-Kuskokwim Delta in western Alaska, birds from every continent on Earth migrate to this sub-Arctic habitat to lay their eggs and raise their young. Once they arrive, geese eat a ton of grass. They graze only in specific areas, called grazing lawns, leaving the rest of the vegetation alone.

When geese graze on wetland plants, they remove plant matter, potentially decreasing the amount of carbon dioxide, or CO2, that is released during photosynthesis. As plants photosynthesize, they absorb CO2 from the atmosphere and turn it into glucose (a sugar) and oxygen. Gross primary production is the total amount of energy that plants capture from sunlight to grow and live before they use up some of that energy for themselves. Plants can slow climate change by removing CO2 from the atmosphere and turning it into plant matter, like leaves and roots.

A scientist mimics geese grazing by clipping the grass.

Trisha is a scientist who became interested in ways that animals can affect the carbon cycle through their interactions with the environment. She wondered whether fewer geese returning to western Alaska could have global consequences that extend beyond remote communities. She thought that if geese ate enough grass, they may limit photosynthesis. This is important because it could change whether this ecosystem is a carbon sink or a carbon source. An ecosystem is called a carbon sink if it absorbs more CO2 through photosynthesis than it releases through respiration. Alternatively, an ecosystem can be a carbon source if more CO2 is released than absorbed. We want ecosystems to be carbon sinks because then they keep CO2 out of the atmosphere, where it contributes to global warming.

To test her idea, Trisha teamed up with fellow scientists Bonnie, Karen, and Jaron to take a closer look at how grazing grass influences whether the Y-K Delta ecosystem is releasing or absorbing CO2. To do their experiment they had to get creative. They considered getting a lot of geese, bringing them to an ungrazed area, and letting them chow down. However, it’s hard to capture geese and get them to graze exactly where you want. So instead, the research team simulated the effects of geese by cutting the grass to mimic nibbling and then gently vacuuming the pieces of grass to remove them.

The “Carbon and Geese” scientist team.

The team set up six different experimental areas. Inside each area were two plots: one that was left ungrazed, and the other which was artificially grazed. The research team then used a piece of equipment called a LI-COR to measure the quantity of CO2 in the air above each plot. They recorded the CO2 levels during the day and night. The comparison from day to night is one way to look at gross primary production and respiration in a system. At night, when there is no light, plants can’t photosynthesize, so the detected CO2 will be from respiration. The levels during the day represent a combination of CO2 absorption by plants and release from respiration.

To assess whether the ecosystem is a carbon sink or source, we need to determine the difference between respiration and gross primary production, or net ecosystem exchange (NEE). A negative NEE means the ecosystem absorbs more CO2 than it emits. A positive NEE means the ecosystem is releasing more CO2 than it is absorbing. In this way, scientists classify an ecosystem as either a carbon sink that is storing carbon or a carbon source that is releasing carbon into the atmosphere.

Featured scientists: Trisha Atwood, Karen Beard, and Jaron Adkins from Utah State University and Bonnie Waring from Imperial College. Written by Andrea Pokrzywinski.

Flesch–Kincaid Reading Grade Level: 8.9

Additional teacher resources related to this Data Nugget:

Check out this website created by teacher Andrea who participated in the research and wrote this Data Nugget. You will find additional lesson plans, videos, slides, and articles to use in the classroom!

Seagrass survival in a super salty lagoon

A researcher in the Dunton Lab measures seagrasses underwater using a mask, snorkel, and a white PVC quadrat.

The activities are as follows:

Seagrasses are a group of plants that can live completely submerged underwater. They grow in the salty waters along coastal areas. Seagrasses are important because they provide a lot of benefits for other species. Like land plants, seagrasses use sunlight and carbon dioxide to grow and produce oxygen in a process called photosynthesis. The oxygen is then used by other organisms, such as animals, for respiration. Other organisms use seagrasses for food and habitat. Seagrass roots hold sediments in place, creating a more stable ocean bottom. In addition, the presence of seagrasses in coastal areas slows down waves and absorbs some of the energy, protecting shorelines.

Unfortunately, seagrasses are disappearing worldwide. Some reasons include damage from boats, disease, environmental changes, and storms. Seagrasses are sensitive to changes in their environment because they have particular conditions that they prefer. Temperature and light levels control how fast the plants can grow while salinity levels can limit their growth. Therefore, it is important to understand how these conditions are changing so that we can predict how seagrass communities might change as well.

Ken is a plant ecologist who has been monitoring seagrasses in southern Texas for over 30 years! Because of his long-term monitoring of the seagrasses in this area, Ken noticed that some seagrass species seemed to be in decline. Kyle started working with Ken during graduate school and wanted to understand more about what environmental conditions might have caused these changes. 

Manatee grass (Syringodium filiforme) located within the Upper Laguna Madre.

Texas has more seagrasses than almost any other state, and most of these plants are found in a place called Laguna Madre. During his yearly seagrass monitoring, Ken noticed that from 2012 – 2014 one of the common seagrasses, called manatee grass, died at many locations across Laguna Madre. Since then, the seagrass has grown back in some places, but not others. Kyle thought this would be an opportunity to look back at the long-term dataset that Ken has been collecting to see if there are any trends in environmental conditions in years with seagrass declines.

Each year, Ken, Kyle, and other scientists follow the same research protocols to collect data to monitor Laguna Madre meadows. Seagrass sampling takes place 2 – 4 times a year, even in winter! To find the manatee grass density, scientists dig out a 78.5 cm2 circular section (10 cm diameter) of the seagrass bed while snorkeling. They then bring samples back to the lab and count the number of seagrasses. While they are in the field, they also measure environmental conditions, like water temperature and salinity. A sensor is left in the meadow that continuously measures the amount of light that reaches the depth of the seagrass.

Kyle used data from this long-term monitoring to investigate his question about how environmental conditions may have impacted manatee grass. For each variable, he calculated the average across the sampling dates to obtain one value for that year. He wanted to compare manatee grass density with salinity, water temperature, and light levels that reach manatee grass. He thought there could be trends in environmental conditions in the years that manatee grass had low or high densities.

Featured scientists: Kyle Capistrant-Fossa (he/him) & Ken Dunton (he/him) from the U-Texas at Austin

Flesch–Kincaid Reading Grade Level 9.8

Additional teacher resources related to this Data Nugget:

There is another Data Nugget that looks at these seagrass meadows! Follow Megan and Kevin as they look at how photosynthesis can be monitored through the sound of bubbles and the acoustic data they produce.

Follow this link for more information on the Texas Seagrass Monitoring Program, including additional datasets to examine with students.

There are articles in peer-reviewed scientific journals related to this research, including:

National Park Service information about the Gulf Coast Inventory and Monitoring.

Texas Parks and Wildlife information on seagrass:

The prairie burns with desire

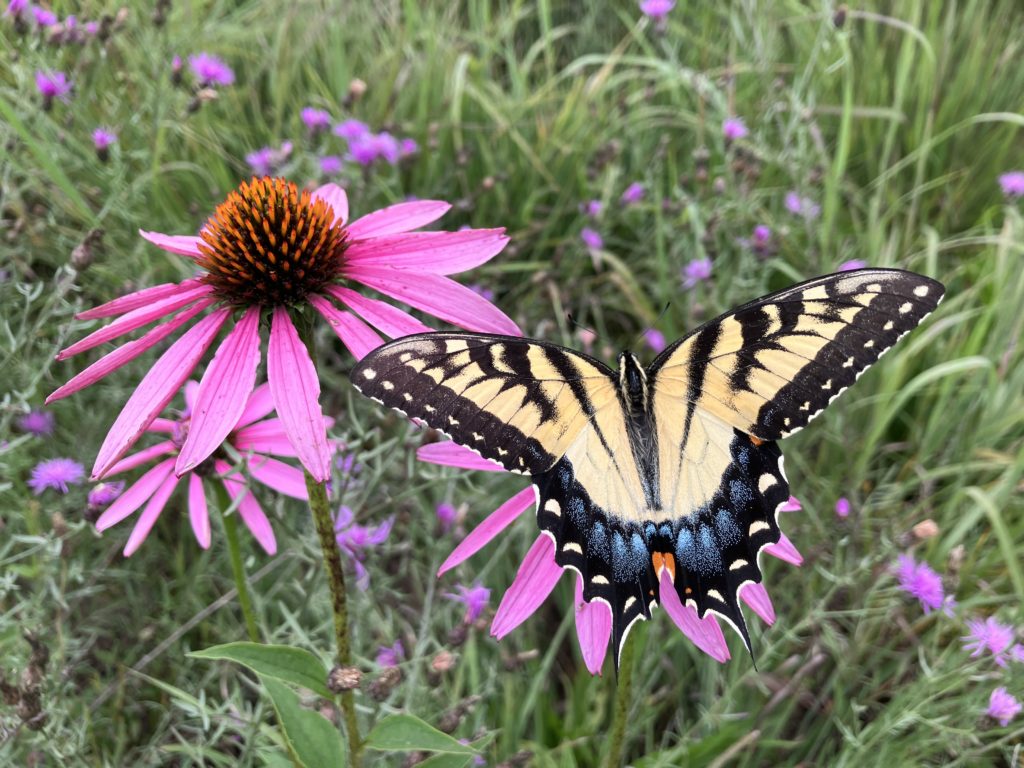
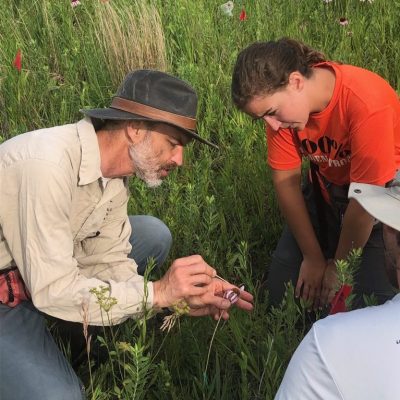
Stuart showing an Echinacea flower setting seed.

The activities are as follows:

Fire plays a crucial role for prairie habitats across North America. Native Americans have long observed that lush and green pastures grow after a wildfire. In many areas, it is part of current and historical native culture to imitate this natural process by deliberately burning the prairie in a controlled way. This land management practice has many benefits, such as helping native grasses form seeds, thinning out plants, and enhancing habitat for prairie animals. By using controlled fires to cultivate these areas, Native Americans increase the availability of food and connect to the environment and their cultural traditions.

Some land management agencies plan prescribed burns to increase the health of prairie ecosystems. However, fire is still suppressed in many North American prairies due to the possible damage to human development. In these areas, scientists have observed that fire suppression contributes to local plant species extinctions, but we do not know why.

Stuart is a scientist interested in how fire can help prairie plants. In the late 1990s, Stuart was in central Minnesota searching for prairie plants in the Echinacea genus. The prairie was ablaze with flowers, so he had no difficulty finding plenty of plants. He tagged each plant so that he could study them again in the future. However, when he returned the following year, the field had almost no flowers! He kept returning to this same field. A few years later he found the site was again filled with flowers. That year there had been a prairie fire. Visually seeing the impacts of fire on the landscape is a memory he will not forget.

Stuart became interested in learning more about how fire affects the reproduction of native prairie plants. He knew that Echinacea plants grow in many places, but they have a hard time making seeds. This genus cannot self-pollinate, meaning they must be fertilized with pollen from a genetically different plant. Echinacea plants are also dependent on insects, such as bees, to pollinate them.

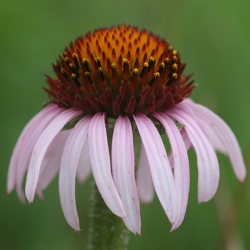
Echinacea flower

In 1996, a research team started collecting data on Echinacea plants in a large research site in Minnesota. This prairie site had a schedule for prescribed burns, or controlled fires that are started by experts to manage the land. These burns would happen every 4-6 years during the spring.

The team established a set of plot locations that they visited each summer. They searched for and mapped the location of all flowering Echinacea plants within these plots. They took measurements on each Echinacea plant – whether it was flowering, and the distance to its second closest Echinacea neighbor.

Stuart decided to take a new look at this long-term dataset. He had two ideas for how fire might be helping Echinacea plants. First, fire might help all the plants get on the same schedule and make flowers at the same time. This synchrony, or flowering at the same time, could help pollen get from one flower to another. Second, fire might remove competing plants from the area, opening up bare ground for new seeds to establish. This would allow Echinacea plants to be closer to one another, again making it easier for pollen to move between flowers.

With these data, Stuart could compare years with and without prescribed burns to see whether fire helped Echinacea flowering. To look at whether fire decreased the space between blooming Echinacea plants, he looked at the distance between a focal plant and its second-closest neighbor. To see whether fire increased the synchrony of flowering, Stuart used the data to calculate the proportion of Echinacea plants that were in bloom during the summer sampling period.

Featured scientist: Stuart Wagenius from the Chicago Botanic Gardens Written by: Harrison Aakre

Flesch–Kincaid Reading Grade Level = 8.6

Additional teacher resources related to this Data Nugget:

More information about the Echinacea project, based in Minnesota. There are additional datasets to explore, blog posts from the field, identification guides, and pictures of the experiments.

Article to learn about cultural perspectives that are traditionally not represented in textbooks. Native Americans have, and continue to incorporate ecology, observations, and making sense of patterns for millennia.

For more information about indigenous knowledges, or traditional ecological knowledge, check out the following websites:

Published journal article about this research. Wagenius, S. et al. 2020. Fire synchronizes flowering and boosts reproduction in a widespread but declining prairie species. Proceedings of the National Academy of Sciences.

Trees and the city

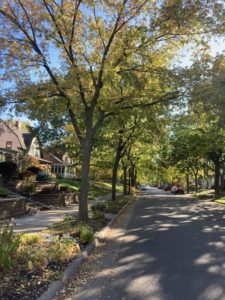
A neighborhood with many tree species and a lot of tree cover.

The activities are as follows:

We often imagine nature as being a place outside of cities. But within our cities, we are surrounded by nature – in fact, most human interactions with nature happen within urban areas. Picturing a tree, we might imagine it in a remote forest, yet many trees are planted by residents and local governments within cities. Trees provide important benefits, such as beauty and shade. The number and types of tree species that are planted in a neighborhood can increase the benefits received from trees in urban areas.

When Adrienne first moved to the Twin Cities in Minnesota, she started exploring Minneapolis and St. Paul by bike. Biking is done at a slow enough pace that she can travel long distances but still make observations about neighborhoods in these cities. As an ecologist, she naturally found herself looking for patterns in trees. For example, she noticed some older neighborhoods in St. Paul have a lot of large trees that provide plenty of shade and tree cover. In other neighborhoods, Adrienne saw fewer types of trees and noticed that she spent less time shaded by branches and leaves.

Adrienne biking around Minneapolis-St. Paul.

Adrienne started conversations with her colleagues about their observations of differences in urban landscapes. They discussed the ways in which laws, policies, and practices (“the way things are done”) give advantages to certain groups of people over others. These advantages are woven into our cultural systems.

Adrienne and her fellow researchers expected that neighborhoods with wealthier and more white residents would have benefited from a long history of greater investment.

Therefore, these neighborhoods were expected to have greater tree cover from the large old trees that have been growing there for many years. They also expected these neighborhoods would have more types of trees. In contrast, the researchers expected that less wealthy neighborhoods and those with a greater percentage of Black, Indigenous, and other People of Color (BIPOC) would have less tree cover and fewer types of trees because of chronic lower investment in these neighborhoods.

To research these ideas, Adrienne and her colleagues combined three different sources of publicly available data:

  • U.S. Census data, used to estimate % BIPOC and average median household income per ‘Block Group’ (similar to a neighborhood).
  • Satellite images, which are often used to estimate % tree cover, measure the percent of land area covered by the tree canopy. Adrienne looked at tree cover in the Block Group areas used in the Census.
  • City data that include the location and species for each tree planted along public streets to calculate tree species richness in each Block Group. Tree species richness is the number of different tree species in an area and is a measure of tree biodiversity used by many ecologists.

Featured scientists: Adrienne Keller (she/her) from the University of Minnesota

The data in this activity are from the MSP Long-term Ecological Research Site. The focus of the research at this site is centered on ecological interactions in urban environments. You can learn more here.

Flesch–Kincaid Reading Grade Level = 9.4

Additional teacher resources related to this Data Nugget include:

  • You can have students read more about environmental justice research from the MSP LTER in this peer-reviewed article (email us at datanuggetsk16@gmail.com if you need a downloadable version):
    • Rebecca H. Walker, Hannah Ramer, Kate D. Derickson & Bonnie L. Keeler (2023) Making the City of Lakes: Whiteness, Nature, and Urban Development in Minneapolis. Annals of the American Association of Geographers, DOI: 10.1080/24694452.2022.2155606
  • This short video features Adrienne as she describes the motivation and process behind her research study.

Mowing for Monarchs – Extension Activities

Gabe Knowles has developed and piloted several data activities to accompany these Data Nuggets activities. For the first activity, Gabe developed an extension to bring his data into elementary classrooms. Using beautiful art created by Corinn Rutkoski, the following are materials to print and use the activity in your classroom:

This activity was first piloted at Michigan Science Teachers Association Annual Meeting in 2023.

Benthic buddies

Danny and Kaylie sampling benthic animals

The activities are as follows:

Lagoons are areas along the coast where a shallow pocket of sea water is separated from the ocean most of the time. During some events, like high tides, the ocean water meets back up with the lagoon. Coastal lagoons are found all over the world – even in the most northern region of Alaska, called the High Arctic!

These High Arctic lagoons go through many extreme changes each season. In April, ice completely covers the surface. The mud at the bottom of the shorelines is frozen solid. In June, the ice begins to break up and the muddy bottoms of the lagoons begin to thaw. The melting ice adds freshwater to the lagoons and lowers the salt levels. In August, lagoon temperatures continue to rise until there is only open water and soft mushy sediment.

You would think these harsh conditions would make High Arctic lagoons not suitable to live in. However, these lagoons support a surprisingly wide range of marine organisms! Marine worms, snails, and clams live in the muddy sediment of these lagoons. This habitat is also called the bottom, or benthic, environment. Having a rich variety of benthic animals in these habitats supports fish, which migrate along the shoreline and eat these animals once the ice has left. And people who live in the Arctic depend on fishing for their food.

Ken, Danny, and Kaylie are a team of scientists from Texas interested in learning more about how the extreme seasons of the High Arctic affect the marine life that lives there. They want to know whether the total number of benthic species changes with the seasons. Or does the benthic community of worms, snails, and clams stay constant throughout the year regardless of ice, freezing temperatures, and large changes in salt levels? The science team thought that the extreme winter conditions in the Arctic lagoons cause a die-off each year, so there would be fewer species found at that time. Once the ice melts each year, benthic animals likely migrate back into the lagoons from deeper waters and the number of species would increase again.

Ken, Danny, and Kaylie had many discussions about how they could answer their questions. They decided the best approach would be to travel to Alaska to take samples of the benthic animals. To capture the changes in lagoon living conditions, they would need to collect samples during the three distinct seasons.

Benthic organisms from a sample

The science team chose to sample Elson Lagoon because it is in the village of Utqiaġvik, Alaska and much easier to reach than other Arctic lagoons. They visited three times. First, in April, during the ice-covered time, again in June when the ice was breaking up, and a final time in summer when the water was warmer. In April, they used a hollow ice drill to collect a core sample of the frozen sediment beneath the ice. In June and August, they deployed a Ponar instrument into the water, which snaps shut when it reaches the lagoon bottom to grab a sample. Each time they visited the lagoon, they collected two sediment samples.

Back in the lab, they rinsed the samples with seawater to remove the sediment and reveal the benthic animals. The team then sorted and identified the species present. They recorded the total number of different species, or species richness, found in each sample.

Featured scientists: Ken Dunton, Daniel Fraser, and Kaylie Plumb from the University of Texas Marine Science Institute

Written by: Maria McDonel from Flour Bluff and Corpus Christi Schools

Flesch–Kincaid Reading Grade Level = 8.9

Additional teacher resources related to this Data Nugget include:

Does more rain make healthy bison babies?

A bison mom and her calf.

The activities are as follows:

The North American Bison is an important species for the prairie ecosystem. They are a keystone species, which means their presence in the ecosystem affects many other species around them. For example, they roll on the ground, creating wallows. Those wallows can fill up with water and create a mini marsh ecosystem, complete with aquatic plants and animals. They also eat certain kinds of food – especially prairie grasses. What bison don’t eat are wildflowers, so where bison graze there will be more flowers present than in the areas avoided by bison. This affects many insects, especially the pollinators that are attracted to the prairie wildflowers that are abundant in in the bison area. 

Not only do bison affect their environment, but they are also affected by it. Because bison eat grass, they often move around because the tastiest meals might be scattered in different areas of the prairie. Also, as bison graze down the grass in one area they will leave it in search of a new place to find food. The amount of food available is largely dependent upon the amount of rain the area has received. The prairie ecosystem is a large complex puzzle with rain and bison being the main factors affecting life there. 

The Konza Prairie Biological Station in central Kansas has a herd of 300 bison. Scientists study how the bison affect the prairie, and how the prairie affects the bison. Jeff started at Konza as a student, and today he is the bison herd manager. As herd manager, if is Jeff’s duty to track the health of the herd, as well as the prairie. 

One of the main environmental factors that affect the prairie’s health is rainfall. The more rain that falls, the more plants that grow on the prairie. This also means that in wetter years there is more food for bison to eat. Heavier bison survive winters better, and then may have more energy saved up to have babies in the following spring. Jeff wanted to know if a wet summer would actually lead to healthier bison babies, called calves, the following year.

Jeff and other scientists collect data on the bison herd every year, including the bison calves. Every October, all the bison in the Konza Prairie herd are rounded up and weighed. Since most of the bison calves are born in April or May, they are about 6 months old by the time are weighed. The older and the healthier the calf is, the more it weighs. Very young calves, including those born late in the year, may be small and light, and because of this they may have a difficult time surviving the winter. 

Jeff also collects data on how much rain and snow, called precipitation, the prairie receives every year. Precipitation is measured daily at the biological station and then averaged for each year. Precipitation is important because it plays a direct role in how well the plants grow. 

Jeff and a herd of bison on the Konza prairie.
Konza LTER logo

Featured scientist: Jeff Taylor from the Konza Prairie Biological Station

Written by: Jill Haukos, Seton Bachle, and Jen Spearie

Flesch–Kincaid Reading Grade Level = 8.7

Additional teacher resources related to this Data Nugget include:

  • The full dataset for bison herd data is available online! The purpose of this study is to monitor long-term changes in individual animal weight. The datasets include an annual summary of the bison herd structure, end-of-season weights of individual animals, and maternal parentage of individual bison. The data in this activity came from the bison weight dataset (CBH012).
  • For more information on calf weight, check out the LTER Book Series book, The Autumn Calf, by Jill Haukos.

Changing climates in the Rocky Mountains

Lower elevation site in the Rocky Mountains: Temperate conifer forest. Photo Credit: Alice Stears.

The activities are as follows:

Each type of plant needs specific conditions to grow and thrive. If conditions change, such as temperature or the amount of precipitation, plant communities may change as well. For example, as the climate warms, plant species might start to shift to higher latitudes to follow the conditions where they grow best. But what if a species does well in cold climates found at the tops of mountains? Because they have nowhere to go, warming puts that plant species at risk.  

To figure out if species are moving, we need to know where they’ve lived in the past, and if climates are changing. One way that we can study both things is to use the Global Vegetation Project. The goal of this project is to curate a global database of plant photos that can be used by educators and students around the world. Any individual can upload photos and identify plant species. The project then connects each photo to information on the location’s biome, ecoregion, and climate, including data tracking precipitation and temperature over time. The platform can also be used to explore how the climates of different regions are changing and use that information to predict how plant communities may change. 

Daniel is a scientist who is interested in sharing the Global Vegetation Project data with students. Daniel became interested in plants and vegetation when he learned in college that you can simply walk through the woods and prairie, collect wild seeds, germinate the plants, and grow them to restore degraded landscapes. Plants set the backdrop for virtually every landscape that we see. He thinks plants deserve our undivided attention.

Daniel and his team wanted to create a resource where students can look deeper into plant communities and their climates. Much of the inspiration for the Global Vegetation Project came from the limitations to undergraduate field research during the COVID-19 pandemic. Students in ecology and botany classes, who would normally observe and study plants in the field, were prevented from having these opportunities. By building an online database with photos of plants, students can explore local plants without having to go into the field and can even see plants from faraway places. 

Daniel’s lab is based in the Rocky Mountains in Wyoming, where the plants are a showcase in both biodiversity and beauty. These communities deal with harsh conditions: cold, windy and snowy winters, hot and dry summers, and unpredictable weather during spring and fall. The plants rely on winter snow slowly melting over spring and into summer, providing moisture that can help them survive the dry summers. 

The Rocky Mountains are currently facing many changes due to climate change, including drought, increased summer temperatures, wildfires, and more. This creates additional challenges for the plants of the Rockies. Drought reduces the amount of precipitation, decreasing the amount of water available to plants. In addition, warmer temperatures in winter and spring shift more precipitation to rain instead of snow and melts snow more quickly. Rain and melted snow rapidly move through the landscape, becoming less available to plants in need. On top of all this, hotter, drier summers further decrease the amount of water available, stressing plants in an already harsh environment. If these trends continue, there could be significant impact on the types of plants that are able to grow in the Rocky Mountains. These changes will have an impact on the landscape, organisms that rely on plants, and humans as well.

Daniel and his colleagues pulled climate data from a Historic period (1961-2009) and Current period (2010-2018). They selected two locations in Wyoming to focus on: a lower elevation montane forest and a higher elevation site. To study climate, they focused on temperature and precipitation because they are important for plants. They wanted to study how temperature and precipitation patterns changed overall and how they changed in different seasons. They predicated temperatures would be higher in the Current period compared to the Historic period in both locations. For precipitation, they predicted there would be drier summers and wetter springs.

Featured scientist: Daniel Laughlin from The University of Wyoming. Written by: Matt Bisk.

Flesch–Kincaid Reading Grade Level = 10.5

Additional teacher resource related to this Data Nugget: