


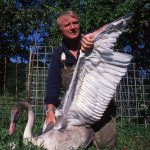
The activities are as follows: Teacher Guide Student Activities, Graph Types A-C, Level 3 Grading Rubric Digital Data Nugget on DataClassroom The Kellogg Bird Sanctuary was created in 1927 to provide safe nesting areas for waterfowl such as ducks, geese, and swans. During that time many waterfowl species were in trouble due to overhunting and the loss
birds
Deadly windows
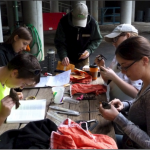
The activities are as follows: Teacher Guide Student activity, Graph Type A, Level 2 Student activity, Graph Type B, Level 2 Student activity, Graph Type C, Level 2 Grading Rubric Glass makes for a great windowpane because you can see right through it. However, the fact that windows are see-through makes them very dangerous for birds.
Finding Mr. Right
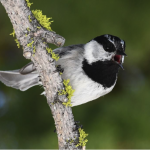
The activities are as follows: Teacher Guide Student activity, Graph Type A, Level 4 Student activity, Graph Type B, Level 4 Student activity, Graph Type C, Level 4 Grading Rubric Depending on where they live, animals can face a variety of challenges from the environment. For example, animal species that live in cold environments may have adaptive
Feral chickens fly the coop

The activities are as follows: Teacher Guide Student activity, Graph Type A, Level 3 Student activity, Graph Type B, Level 3 Student activity, Graph Type C, Level 3 Grading Rubric When domesticated animals that humans keep in captivity escape into the wild, we call them feral. You may have seen feral animals, such as pigeons, cats,
The birds of Hubbard Brook, Part II
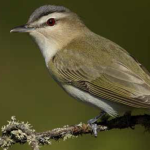
In Part I, you examined patterns of total bird abundance at Hubbard Brook Experimental Forest. These data showed bird numbers at Hubbard Brook have declined since 1969. Is this true for every species of bird? You will now examine data for four species of birds to see if each of these species follows the same
The birds of Hubbard Brook, Part I

The activities are as follows: Teacher Guide Student activity, Graph Type A, Level 2 Student activity, Graph Type B, Level 2 Student activity, Graph Type C, Level 2 Grading Rubric PowerPoint of images Digital Data Nugget on DataClassroom The Hubbard Brook Experimental Forest is an area where scientists have collected ecological data for many years. It
Does sea level rise harm Saltmarsh Sparrows?
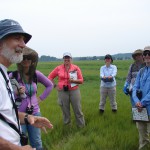
The activities are as follows: Teacher Guide Student activity, Graph Type A, Level 3 Student activity, Graph Type B, Level 3 Student activity, Graph Type C, Level 3 Grading Rubric For the last 100 years, sea levels around the globe have increased dramatically. The cause of sea level rise has been investigated and debated. Data from
Sexy smells
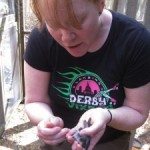
The activities are as follows: Teacher Guide Student activity, Graph Type A, Level 2 Student activity, Graph Type B, Level 2 Student activity, Graph Type C, Level 2 Grading Rubric Digital Data Nugget on DataClassroom Animals collect information about each other and the rest of the world using multiple senses, including sight, sound, and smell. They use
Is chocolate for the birds?
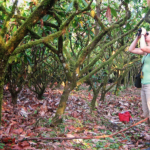
The activities are as follows: Teacher Guide Student activity, Graph Type A, Level 2 Student activity, Graph Type B, Level 2 Student activity, Graph Type C, Level 2 Grading Rubric Digital Data Nugget on DataClassroom About 9,000 years ago humans invented agriculture as a way to grow enough food for people to eat. Today, agriculture happens all