The activities are as follows:
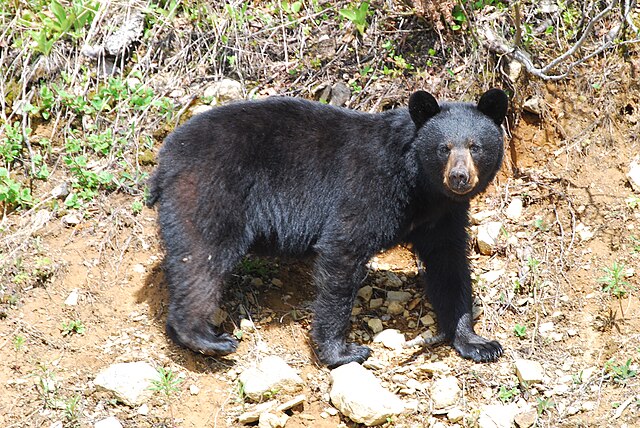
North Carolina is home to many black bears. As human development expands into bear habitats, conflicts between people and bears are becoming more common. In these situations, identifying individual bears and understanding their origins is essential. This ensures that wildlife officials can correctly manage aggressive or relocated bears. It also allows for better tracking of bear populations and their movements across the state, helping to inform long-term conservation approaches.
Though each individual bear has its own genotype, or unique genetic makeup, individuals within the same population often share more DNA with each other than with members of other populations. A group of scientists started comparing the DNA of black bears in California and identified 11 unique regions, called loci, in the DNA of bears from different populations. This set of loci that the scientists can use to assign individual black bears to different populations is called Ursaplex.
Each loci have microsatellites, which are repetitive sequences of nucleotide bases that vary between individuals or populations. Different versions of the microsatellite loci are called alleles. By examining these patterns in a bear’s genotype, scientists can identify bears at an individual level and tell which population they are from.
Isabella is a wildlife geneticist who studies how we can use genetic tools to conserve wild animal populations. She has always been passionate about animals and conservation. Isabella, along with other scientists, wants to test whether or not the Ursaplex panel could work for black bears in North Carolina.
North Carolina bears are split into three different management groups based on where they are found: Mountain, Piedmont, and Coastal. Isabella wanted to know whether black bears show genetic differences based on which management group they live in. If so, she wanted to see if any of the microsatellites in the Ursaplex panel could be used to identify which management group a bear is from.
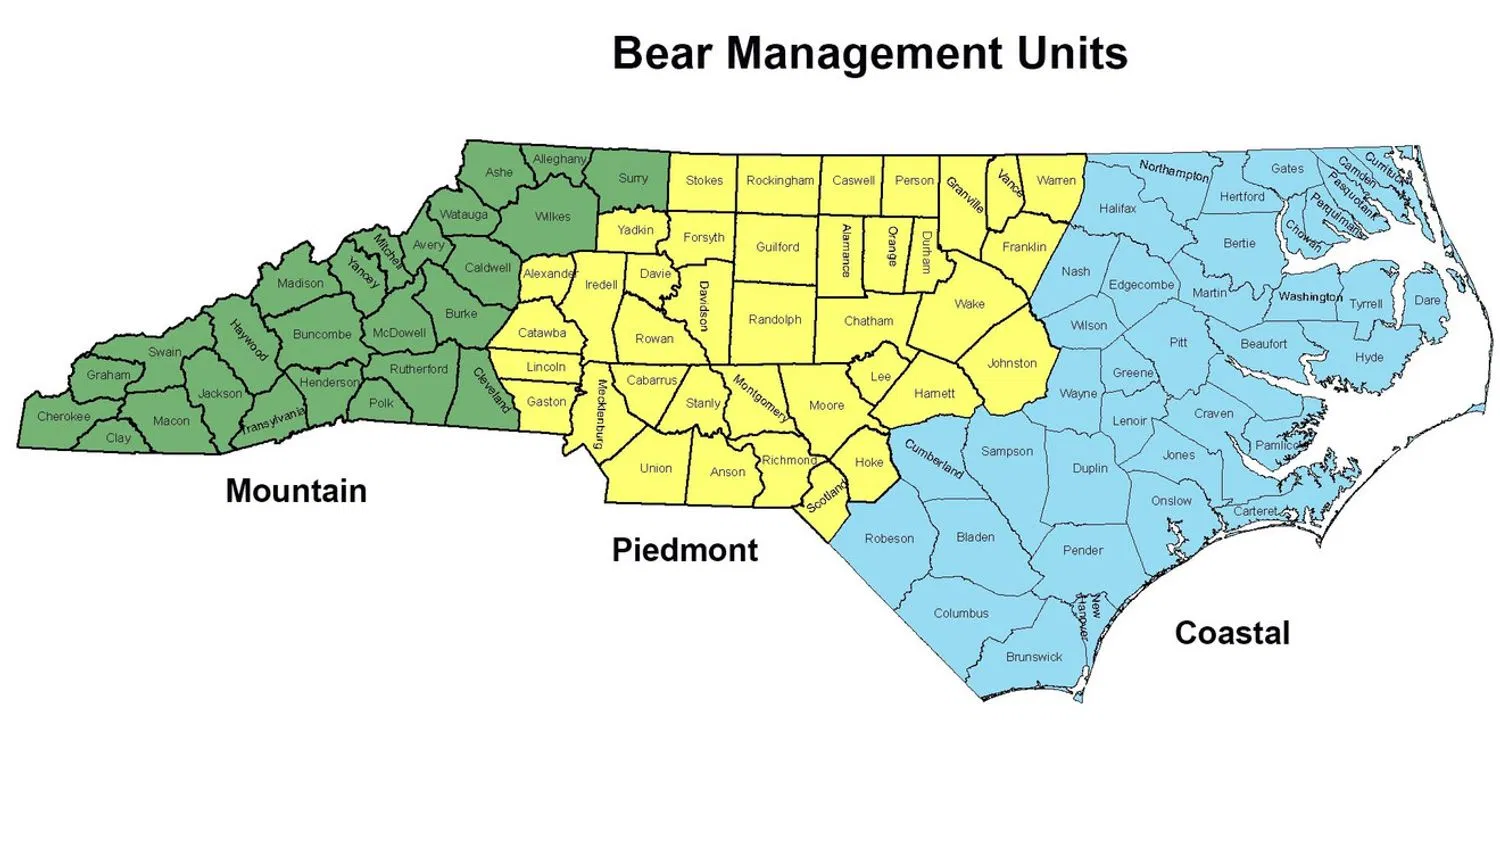
Isabella obtained blood or saliva samplesfor350black bears from collaborators at the Wildlife Resource Commission, the state agency for wildlife management. The samples came from bears in the Mountain and Coastal management groups. The Piedmont bear population is significantly smaller and elusive, so samples from Piedmont bears were not available. She extracted the DNA from the samples and found the genetic sequence at each of the 11 loci in Ursaplex. Isabella looked at then umber of nucleotide base repeats in each bear’s genetic sequence and used the data to identify any patterns based on where the bear was from. Each of the 11 loci included arebi-allelic, meaning each bear will have two copies of the locus (one from their mom and one from their dad). Recently, Isabella received a blood sample from a new baby bear, Murray, who was rescued by wildlife managers. This baby bear was alone when he was found, so we don’t know where in the state he came from. He was found in the Eastern part of the state, so Isabella thought that his parents were likely both Coastal management group bears.
Featured scientists: Isabella Livingston (she/her) from North Carolina State University Written with Kate Price
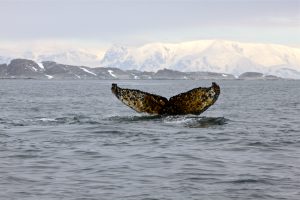
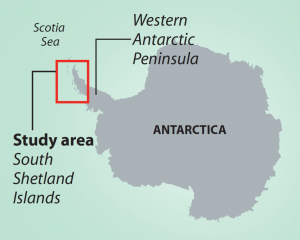 One geographic area that was over-exploited during times of high whaling was the South Shetland Islands along the Western Antarctic Peninsula (WAP). The WAP is in the southern hemisphere in Antarctica. Humpback whales migrate every year from the equator towards the south pole. In summer they travel 25,000 km (16,000 miles) south to WAP’s nutrient-rich polar waters to feed, before traveling back to the equator in the winter to breed or give birth. Today the WAP is experiencing one of the fastest rates of regional climate change with an increase in average temperatures of 6° C (10.8° F) since 1950. Loss of sea ice has been documented in recent years, along with reduced numbers of krill along the WAP.