The activities are as follows:
- Teacher Guide
- Student activity, Graph Type A, Level 3
- Student activity, Graph Type B, Level 3
- Student activity, Graph Type C, Level 3
- Scientist Profile on Project Biodiversify
- Grading Rubric
Around the world, temperatures are rising from climate change. This is a hot topic for scientists because warmer temperatures could make diseases spread a lot faster. Many diseases spread by the foods we eat. With warmer temperatures, metabolisms increase, and organisms need to eat more food to survive. This increases the risk of eating something that will get them sick.
When Kale started graduate school, they joined a lab that studies how climate change affects the spread of disease in fall armyworms, a type of caterpillar. Fall armyworms are an agricultural pest known for destroying corn, soybeans, and other crops worldwide. In the summer, they move into fields and rapidly chow down on crops. It’s often reported by farmers that it seems as though fall armyworms can remove all the leaves from a cornfield overnight! Believe it or not, their huge appetite leads them to another food source – they will even turn into cannibals and eat each other!
Once Kale started graduate school, they became interested in how cannibalism can increase disease spread in warmer temperatures. Fall armyworms can get infected with a special type of virus called a baculovirus. Baculoviruses are a group of viruses that infect insects, especially caterpillars. They are highly specialized, meaning that each baculovirus usually only infects one species.
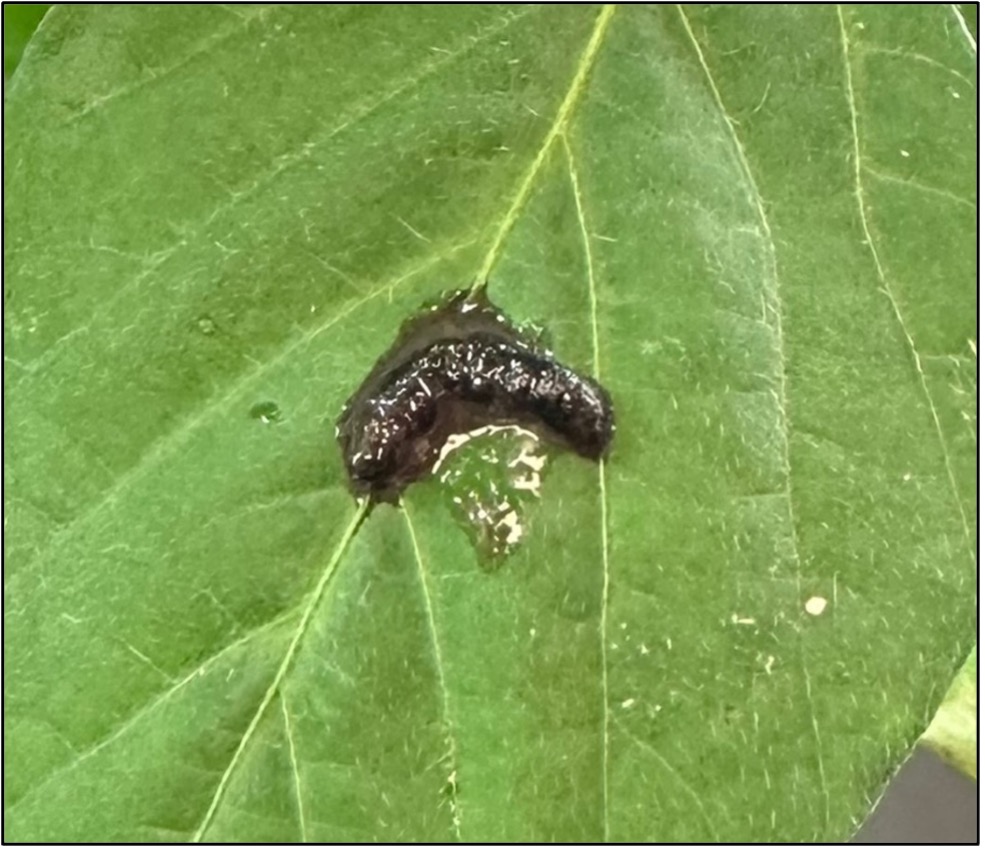
If a fall armyworm eats a fellow fall armyworm that is infected, it can be deadly. In fact, the disease causes their body to completely liquify into a puddle of pure virus! This baculovirus is so effective that farmers even use it to help control infestations in their fields. Since this specific baculovirus only infects fall armyworms, it is safe to use on crops without worrying about effects on humans or other living things.
To study how cannibalism can affect disease spread, Kale designed a set of experiments. They thought that when temperatures are higher, the larvae’s metabolism would increase and make them hungrier caterpillars. Increased appetite could then lead to more cannibalism. As a result, more larvae would be eating others that are infected, further spreading the deadly baculovirus.
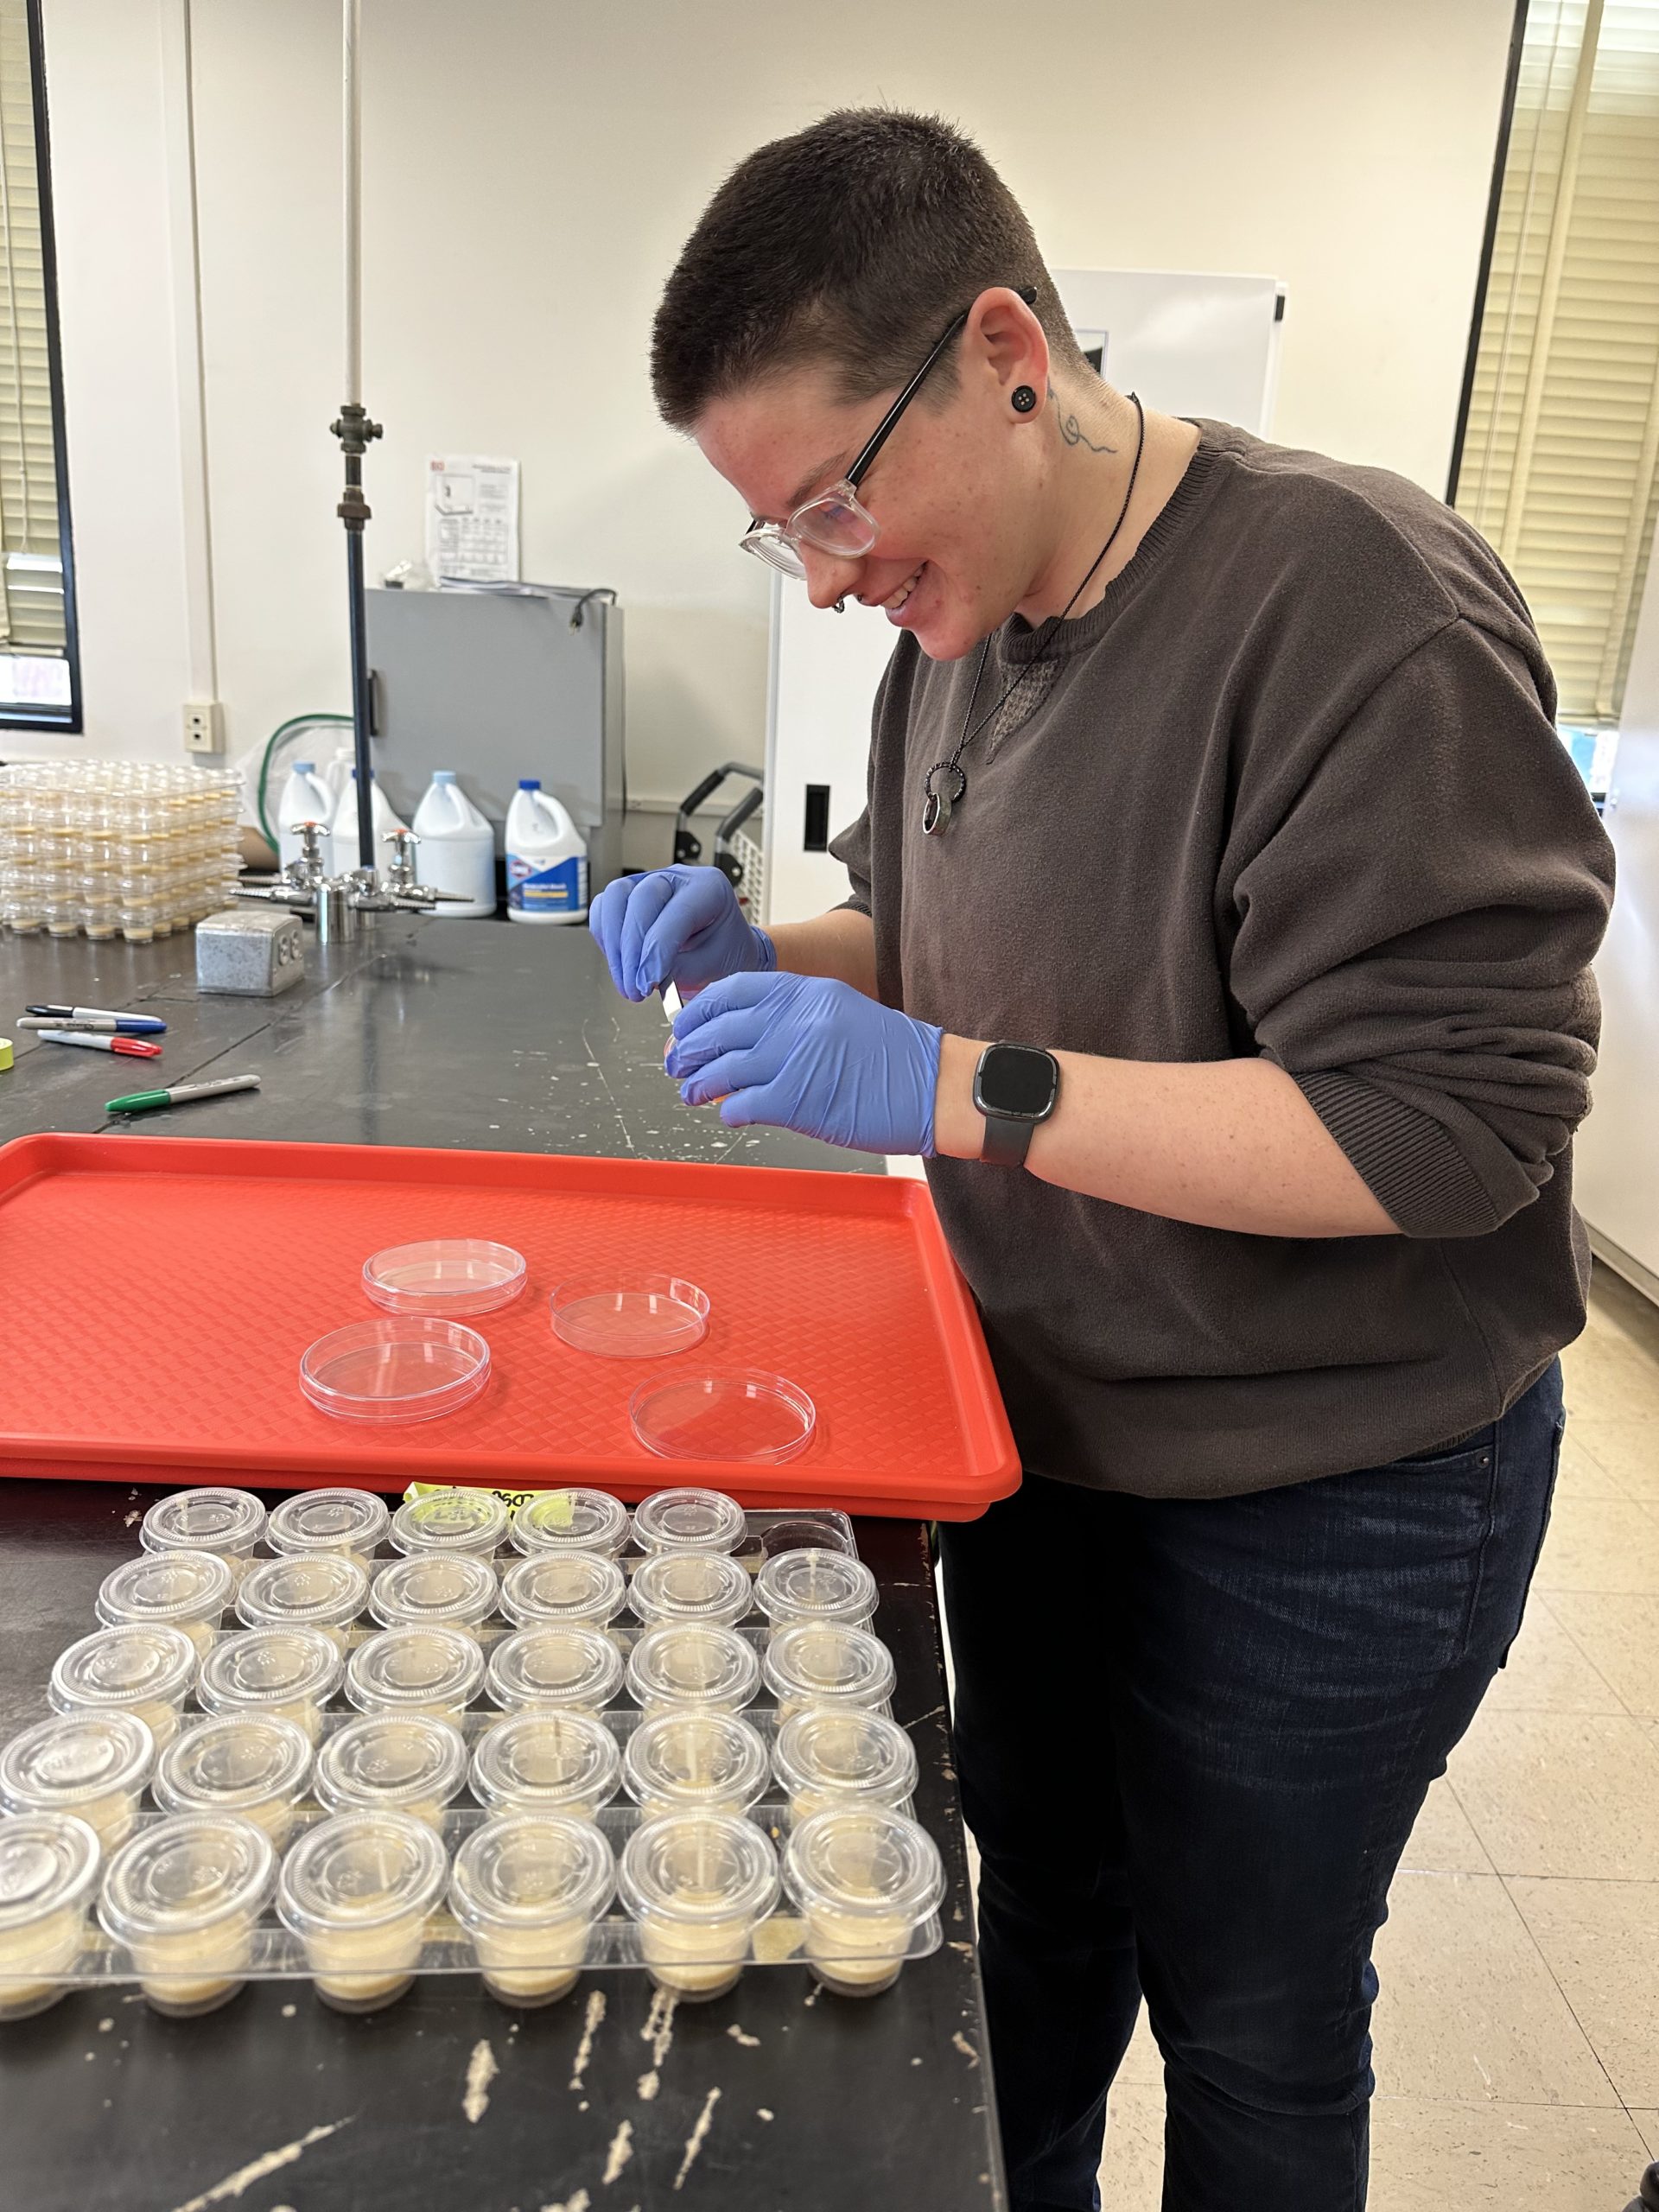
To test these ideas, Kale set up small Petri dishes and placed one big fall armyworm in each dish as the focus of each trial. Kale added a piece of insect food and a smaller fall armyworm to each dish. This way, the larger caterpillars had the option of eating the insect food, cannibalizing its smaller friend, or munching on both.
To see if temperature had an impact, Kale set up three treatments at low, medium (ideal), and high temperatures. They assigned 40 Petri dishes to each temperature. To test changes in disease transmission, half of the smaller caterpillars were infected with baculovirus, and half remained uninfected.
Kale predicted that fall armyworms at higher temperatures would cannibalize more because they need more food to keep up with an increased metabolism. They also predicted that fall armyworms that eat an infected caterpillar would be more likely to become infected at higher temperatures.
Featured scientists: Kale Rougeau from Louisiana State University
Flesch–Kincaid Reading Grade Level = 10.2
Additional teacher resources related to this Data Nugget include:
- Read more about Kale’s hobby of participating and training for dog competitions on the Beyond the Bench blog.
- More about fall armyworms here and here.

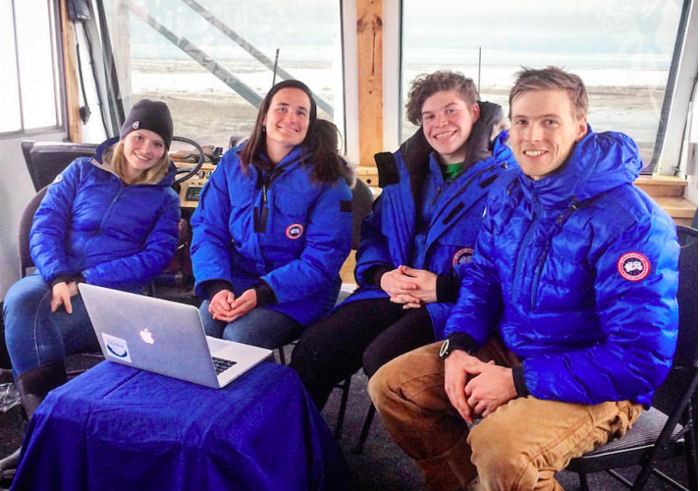


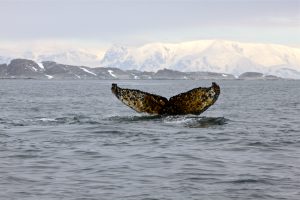
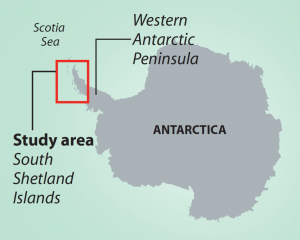 One geographic area that was over-exploited during times of high whaling was the South Shetland Islands along the Western Antarctic Peninsula (WAP). The WAP is in the southern hemisphere in Antarctica. Humpback whales migrate every year from the equator towards the south pole. In summer they travel 25,000 km (16,000 miles) south to WAP’s nutrient-rich polar waters to feed, before traveling back to the equator in the winter to breed or give birth. Today the WAP is experiencing one of the fastest rates of regional climate change with an increase in average temperatures of 6° C (10.8° F) since 1950. Loss of sea ice has been documented in recent years, along with reduced numbers of krill along the WAP.
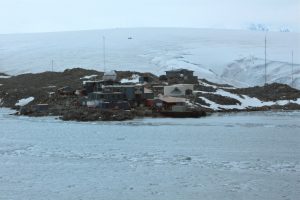

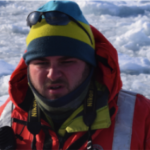

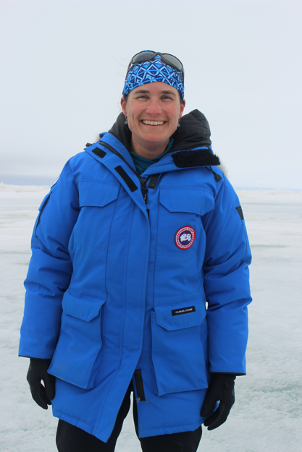
 About Kristine: Kristine L. Grayson is an Associate Professor in the Biology Department at University of Richmond, where she teaches Intro Ecology/Evolution, Field Ecology, Ecophysiology, and
