The activities are as follows:
- Teacher Guide
- Student activity, Graph Type A, Level 2
- Student activity, Graph Type B, Level 2
- Student activity, Graph Type C, Level 2
- Grading Rubric
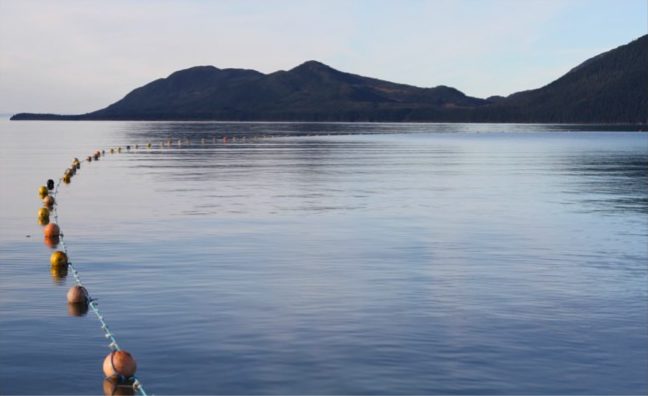
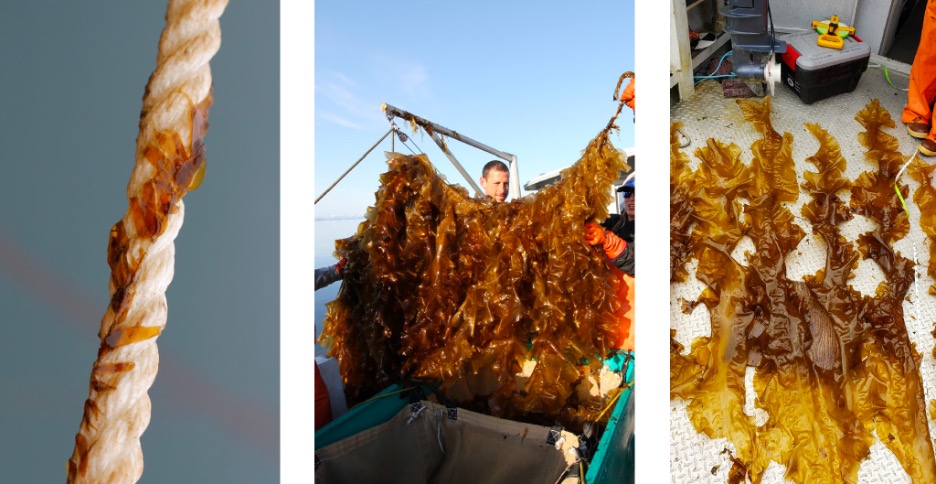
With so much coastline, Alaska has many opportunities for mariculture, which is the farming of food in the ocean. Large-scale mariculture is still new in Alaska, but interest is growing quickly because it can provide jobs and food for small coastal communities.
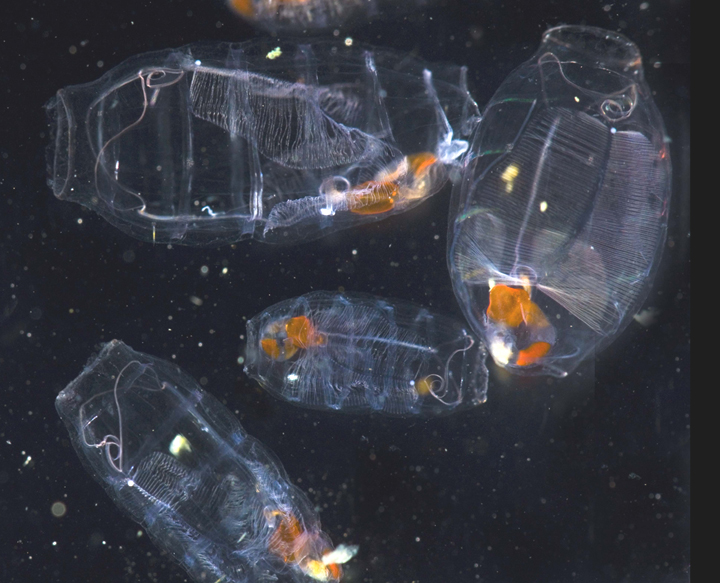
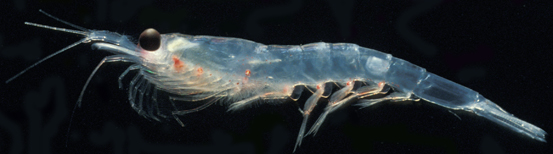
Alaska’s cold, clean waters are ideal for growing oysters. Oysters usually stay on a farm for several years until they are large enough to sell. Farmers want oysters to grow as quickly as possible so they can sell them sooner. Because oyster farming is still fairly new in Alaska, research needs to be done to find the best ways to grow oysters successfully.
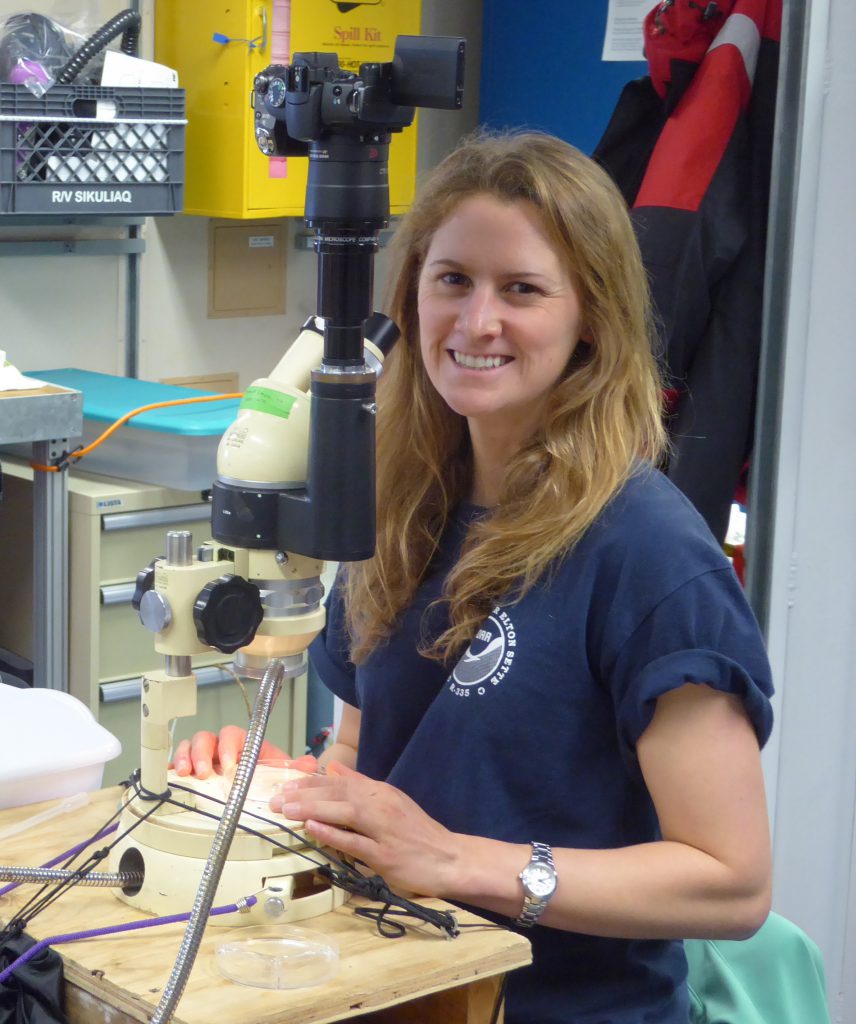
Amanda is a marine researcher who lives and works in Valdez, Alaska. She wants to figure out which methods are most effective for oysters to grow. She can then share her findings with farmers to help them. Amanda partnered with members of the Valdez Native Tribe who were interested in growing oysters in the area.
Amanda started monitoring the oysters every year to document their growth. A few years after the farm was set up, she visited the site and noticed that the oysters had not survived the summer season. Amanda wanted to find out why this happened so they could prevent it from happening again in the future.
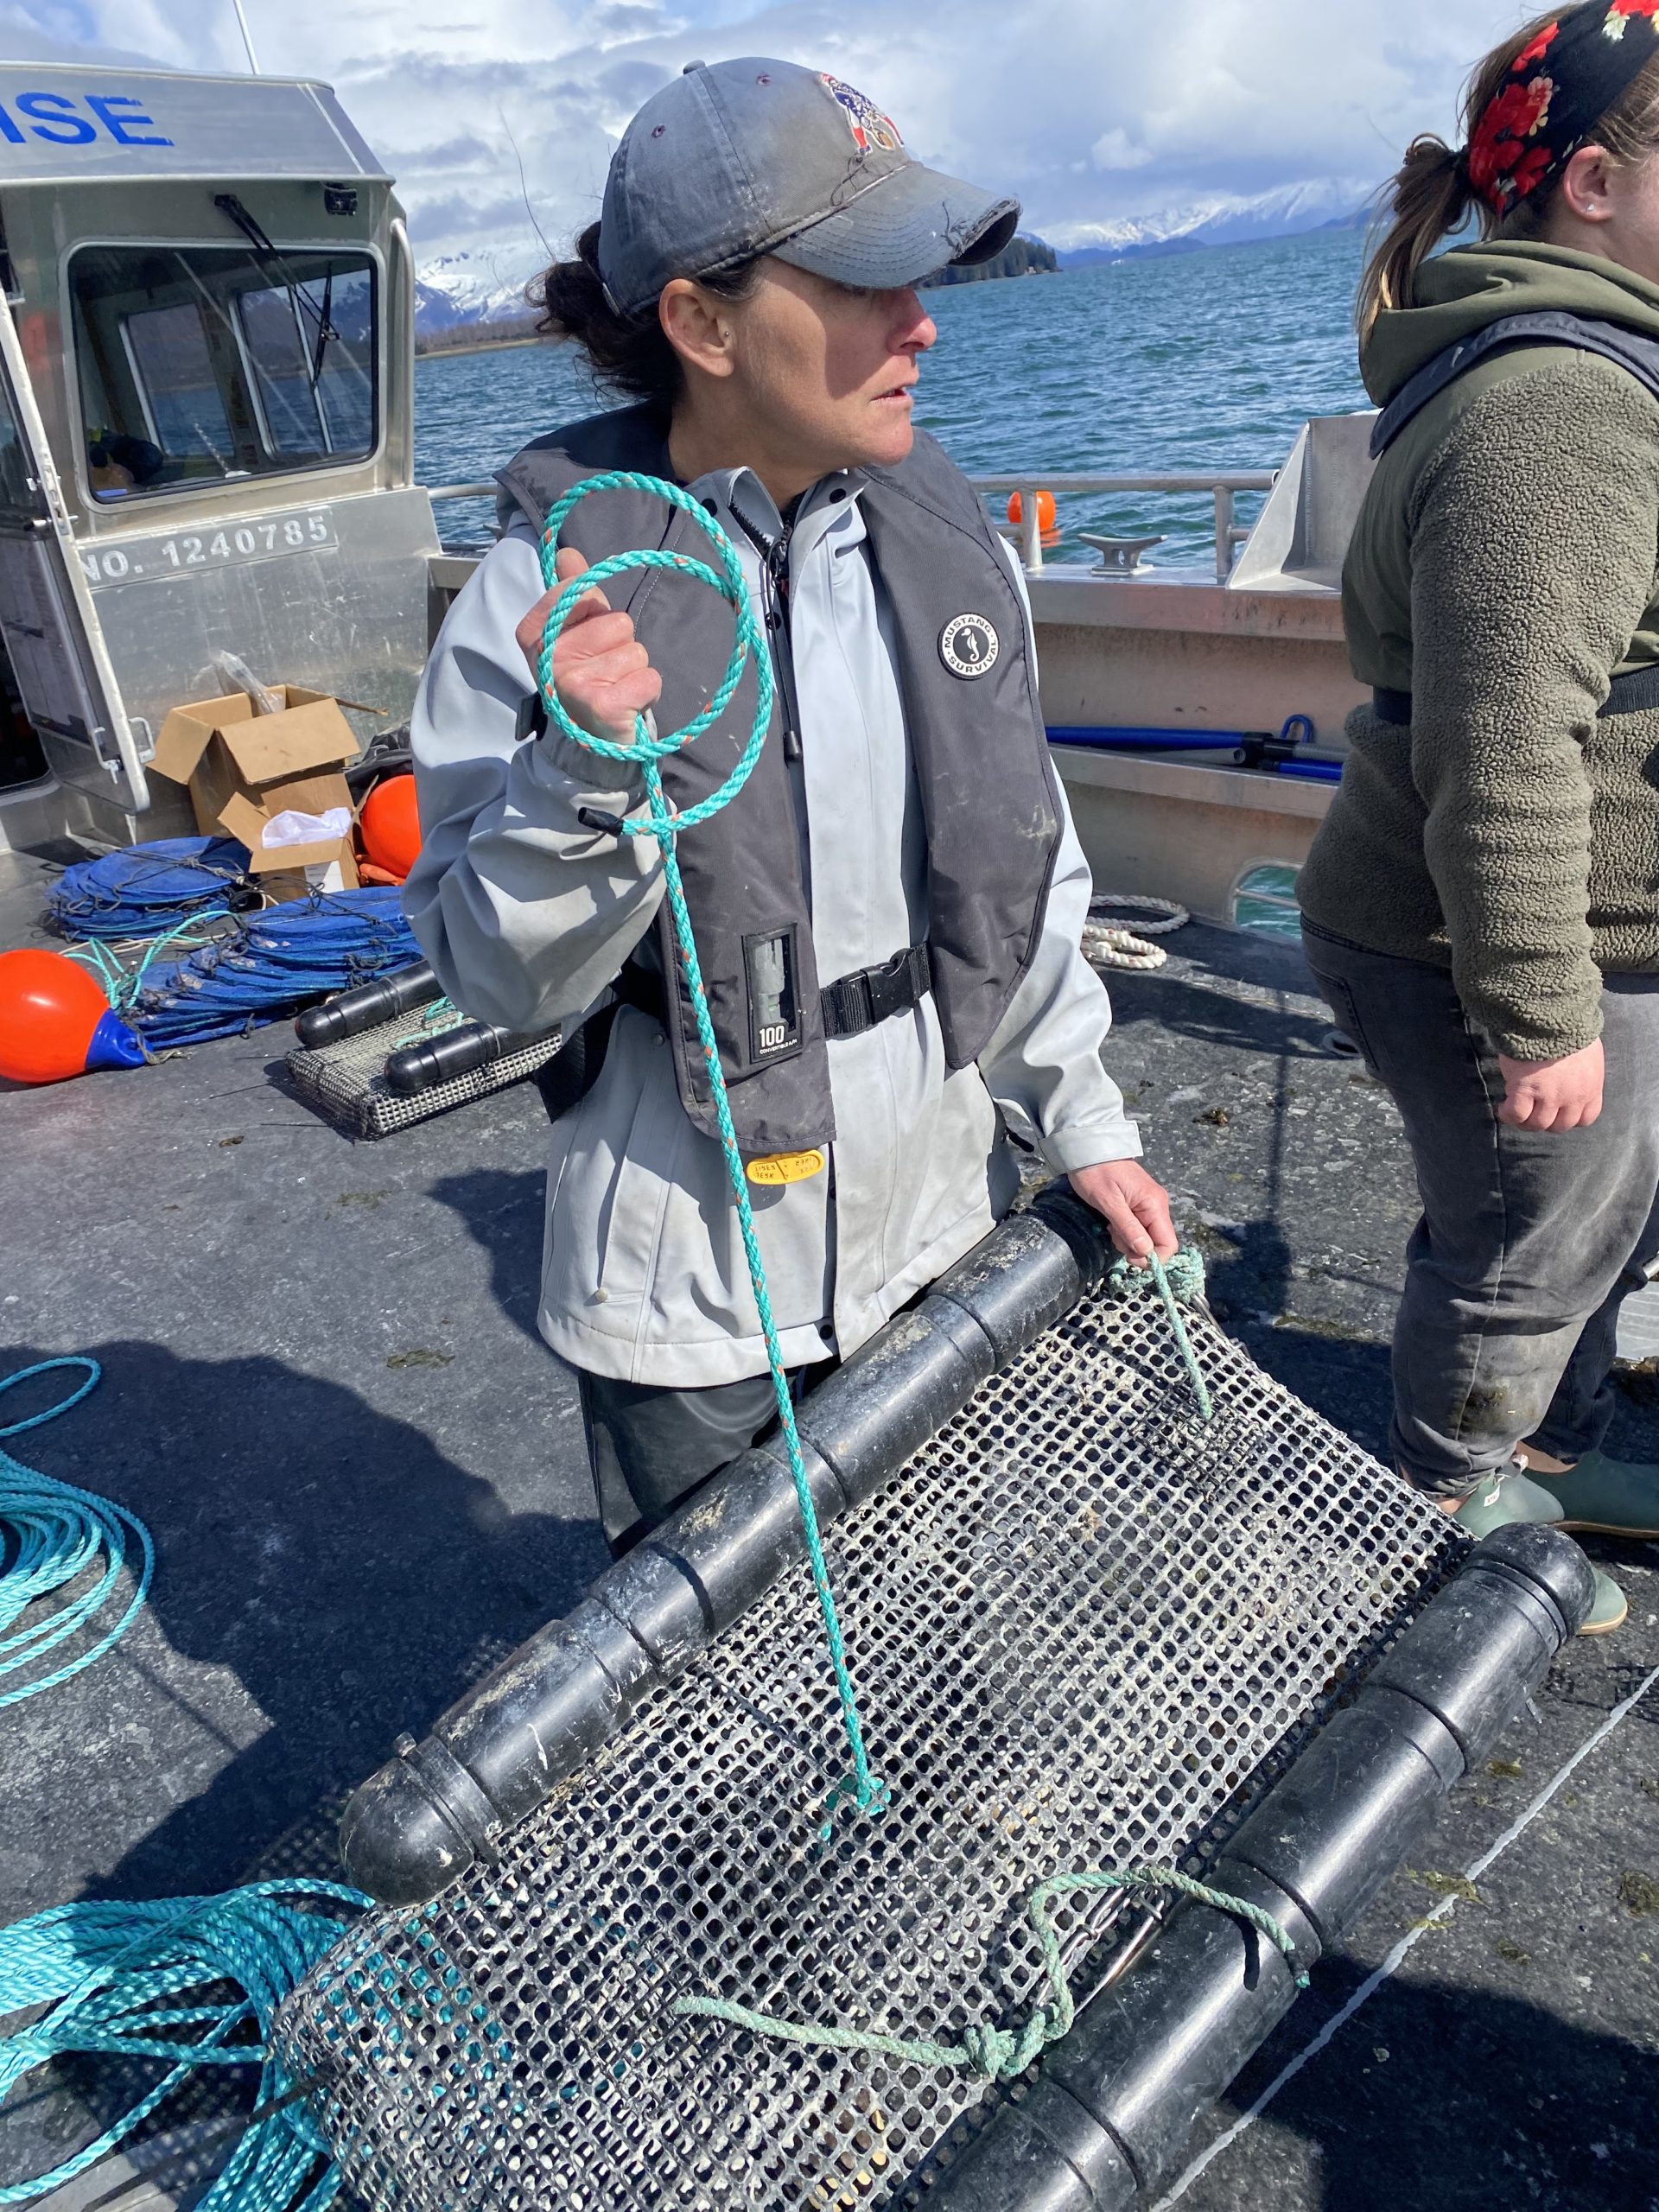
Amanda had a few ideas about what might be affecting the oysters. She noted that the oysters were all in surface baskets, which float at the top of the water. She also observed that the year that all the oysters perished, Valdez had heavy rainfall. Amanda knew that rain can lower salinity, or the amount of salt in ocean water, near the surface. Freshwater from rain flows into the ocean and can stay on top if it does not mix well with saltwater below. When salinity becomes too low, oysters close their shells and stop feeding and growing.
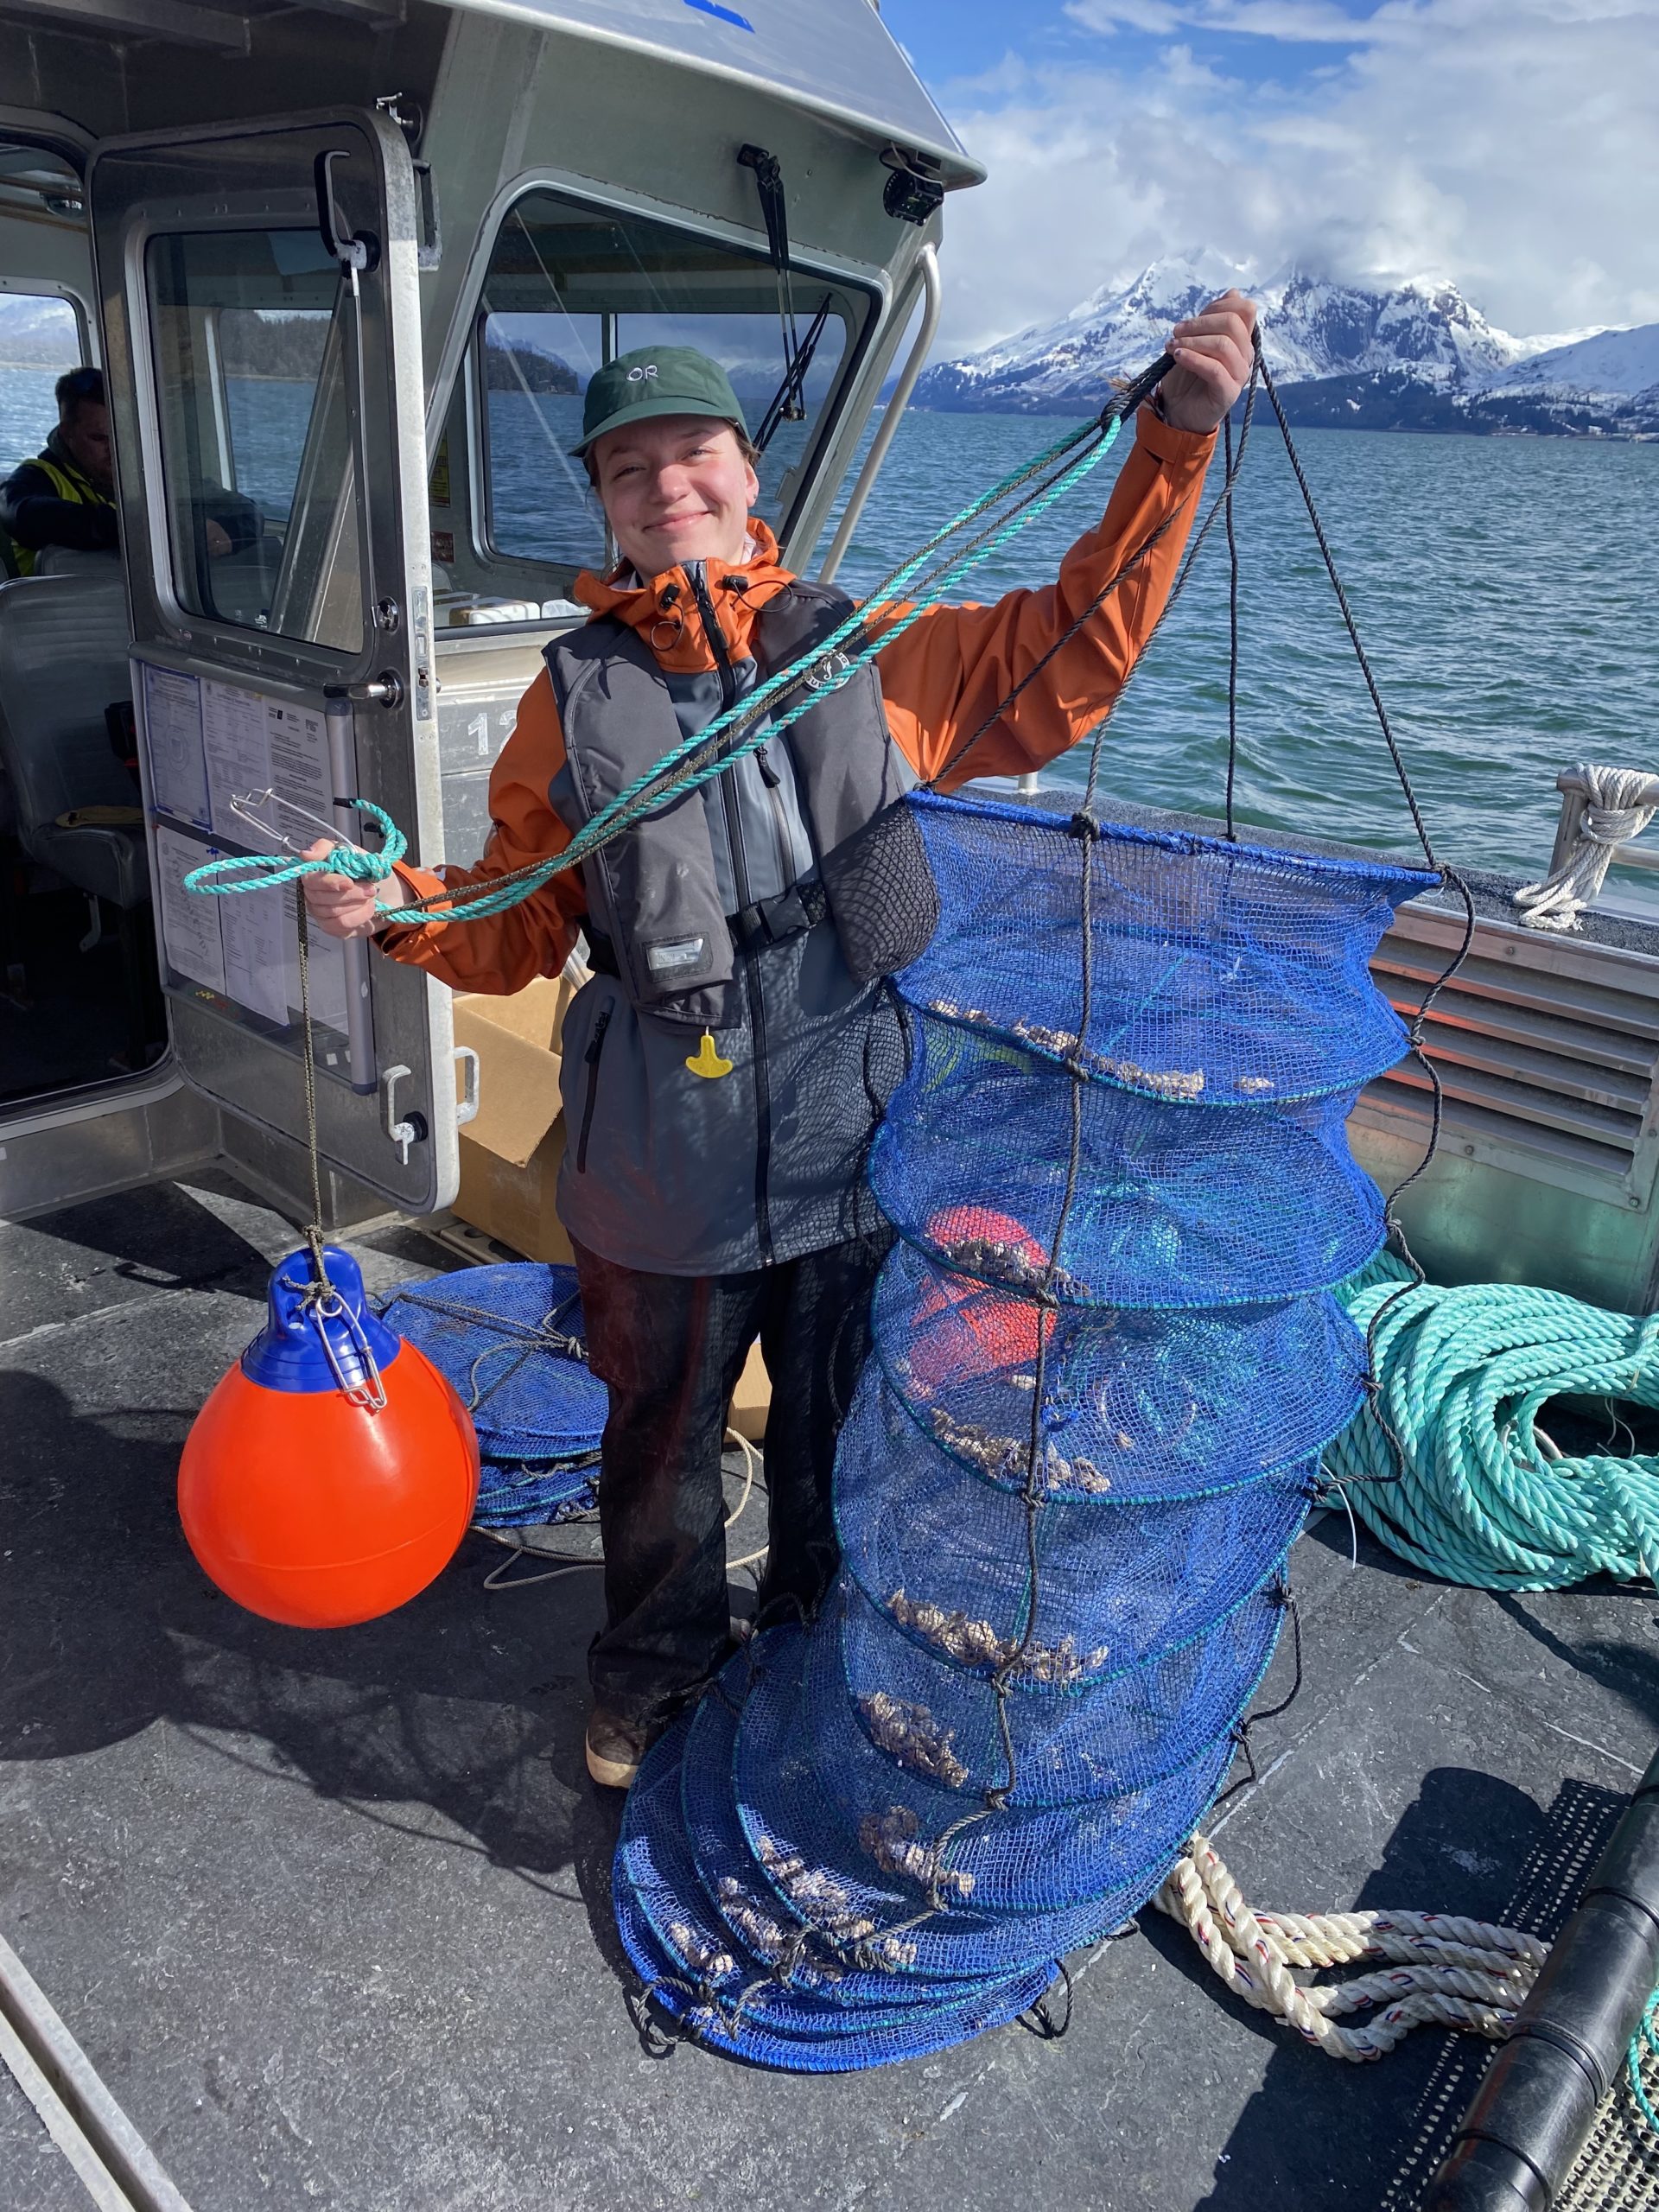
Amanda asked one of her students, Jane, if she wanted to do an independent research project to test a new type of home for oysters. They explored the use of lantern nets, which are a different setup that holds oysters below the surface of the water instead of floating on top. These nets hang straight down and are about 3 meters long. They also have several levels, allowing oysters to be placed at different depths so Amanda and Jane could see where the oysters grew best.
To test salinity levels and oyster growth at different depths, Amanda and Jane set up a new study at the Valdez farm site. In April 2025, they brought very small, young oysters to the farm. They weighed out equal amounts of oysters and placed some into three surface baskets and some into different levels of two lantern nets.
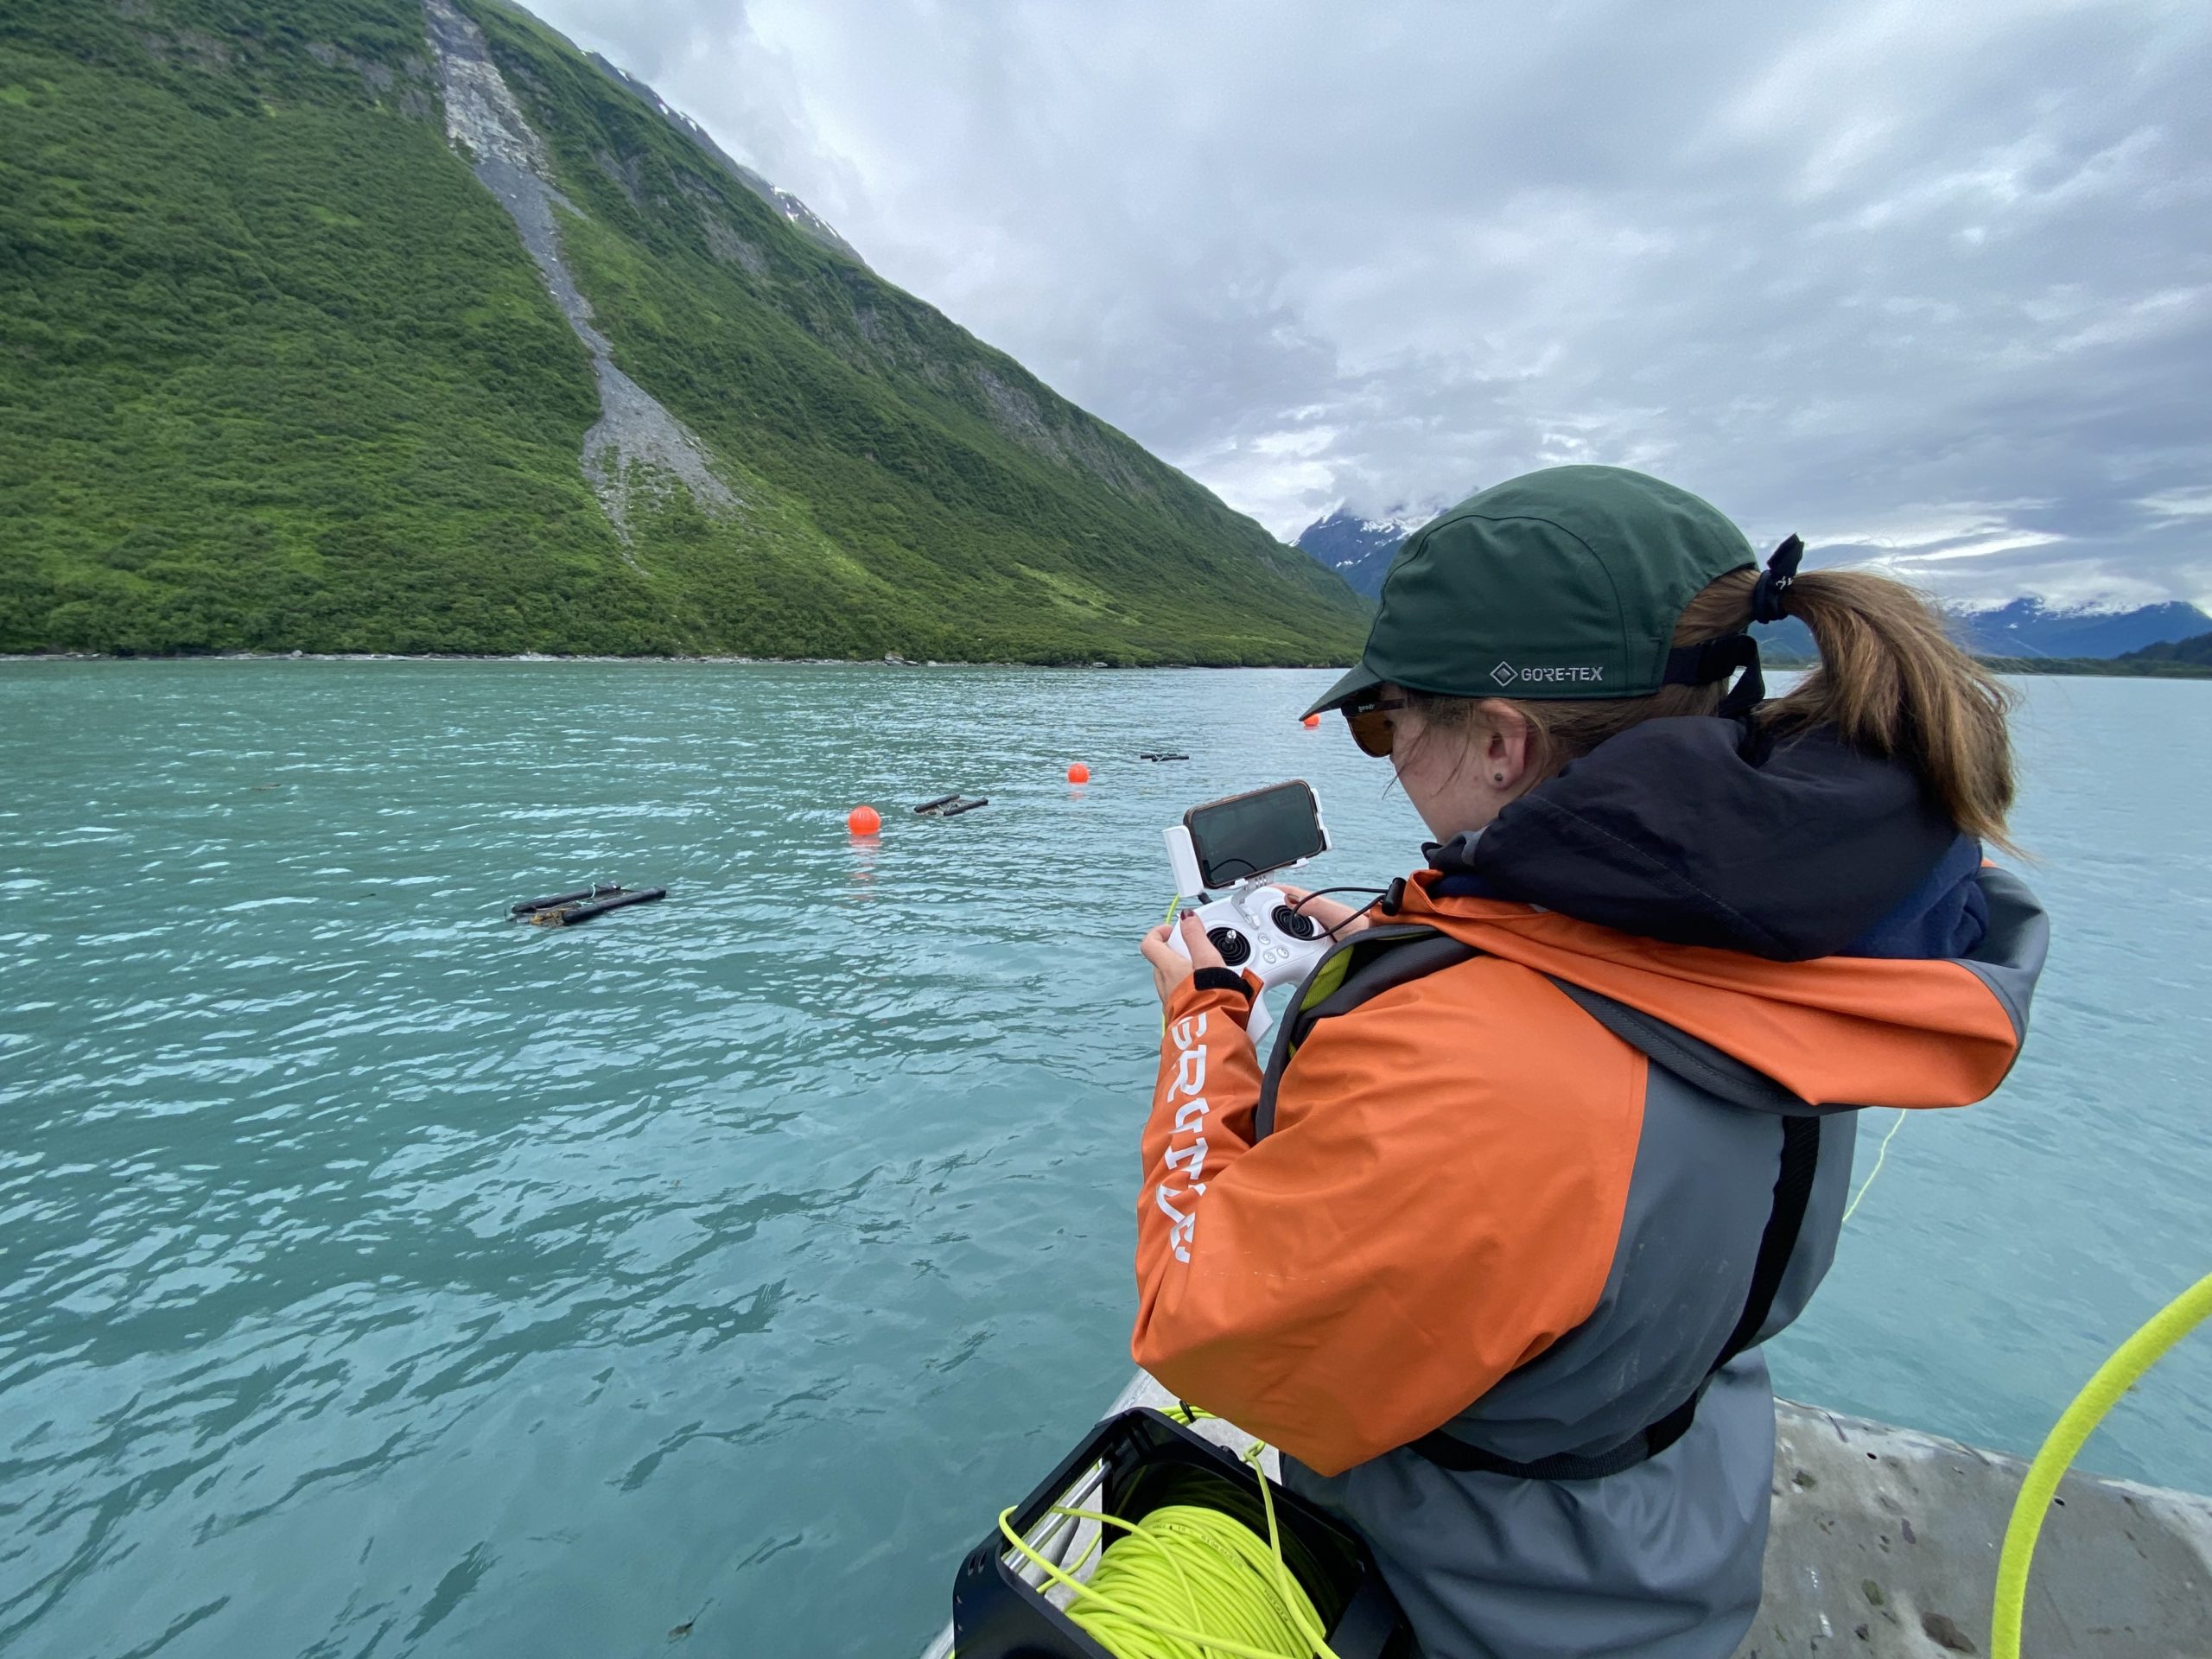
Over the summer, Jane visited the oyster farm every two weeks to measure salinity. She looked at four different depths: surface (0 meters), 1, 2, and 3 meters deep. This way, she could see whether the freshwater inputs make the surface water less salty. In October 2025, Jane and Amanda measured the oyster size at the end of the summer to see how much they had grown. They compared the length of oysters from the surface baskets and from the different levels of the lantern nets.
Featured scientists: Amanda Glazier (she/her) and Jane Churchill (she/her) from Prince William Sound College. Written by Melissa Kjelvik.
Flesch–Kincaid Reading Grade Level = 7.8
Additional teacher resource related to this Data Nugget:
- Student research spotlight featuring Jane Churchill, one of the researchers featured in this activity:
- Video series by Alaska SeaGrant “Meet your Alaskan farmer” offering a glimpse into what it is like growing oysters in remote Alaska communities and how farmers are working together:
- Short articles on Alaska oyster farming:
- NOAA Fisheries: “Exploring the Upsides and Obstacles of Growing Pacific Oysters in Alaska’s Cold Waters”
- Alaska Public Media: “Alaska oyster farmers refine growing techniques to meet high demand”
- Read an overview of Alaska mariculture at the following site.
- Video with interviews from students and faculty about the collaborative education and training programs in Alaska.
This material is based upon work supported by the National Science Foundation under award #OIA-2344553 and by the State of Alaska.