Guppies on the move

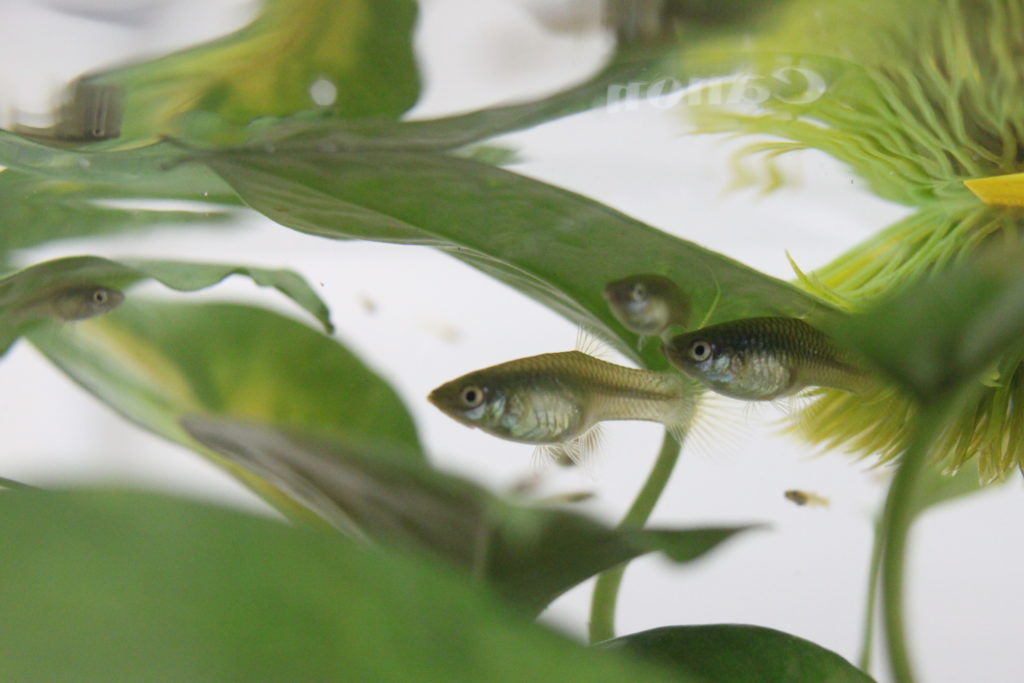
Guppies in the lab. Photo Credit: Eva Fischer.

The activities are as follows:

  • Teacher Guide
  • Student activity, Graph Type A, Level 3
  • Student activity, Graph Type B, Level 3
  • Student activity, Graph Type C, Level 3
  • Grading Rubric

Animal parents often choose where to have their offspring in the place that will give them the best chance at success. They look for places that have plentiful food, low risk of predation, and good climate.

Even though parents pick out these spots, individuals often move away from their birthplace at some point in their lives. Why do animals move away? There are risks that come with moving from one place to another. It can be dangerous to go through unknown places – potentially stumbling into predators or being exposed to diseases. But there can also be benefits to moving, such as discovering a better spot to live as an adult, finding mates, and spreading out to reduce competition.

As someone who loves to travel and has lived in four different countries, Isabela can relate! Isabela likes to see new places, try new foods, and learn new languages. But there can be drawbacks, and occasionally she finds it hard to be in a completely new place. Sometimes people don’t understand her accent, or she can’t understand them. She also misses her family when she is away. Knowing that traveling and moving can have such highs and lows for herself, Isabela wanted to know more about what motivates animals to seek out new places.

To follow her curiosity, Isabela found a graduate advisor who was also interested in animal movement. She joined Sarah’s lab because she had already collected data on the movement of small tropical fish called guppies. Sarah is part of a large collaborative project, where researchers from all over the world come together in Trinidad to study these fish populations.

When Sarah first started collecting data in this system, she wanted to track how far guppies move from one place to the next. She used established protocols from previous work in this system to set up a study. With the help of a team, she captured every fish in two similar streams for replication. Every fish that was caught was marked with a small tattoo so the research team could recognize it if it was found again in the future. She did this same procedure every month for 14 months. Each time she sampled the fish, she recorded the individuals that she found and where they were found.

Isabela used this dataset to ask whether guppies benefit from moving from one place to another. In this study, she focused on one type of benefit: having a higher number of offspring. It is through reproduction that animals are able to pass on their genes, so the more offspring an individual fish has, the more successful it is.

First, Isabela used the existing dataset to find out how far each fish moved: if Fish 1 was captured in Portion A of a stream in February and then in Portion B of the same stream in March, Isabela knew it had to move from A to B. She could use the timepoints to estimate how far each individual had traveled that month.

Second, Isabela used genetics to find out how many offspring each fish had. She looked at genetic markers to determine familial relationships between individuals in each stream. For example, two fish that shared 50% of their genes were probably a parent and an offspring. In this case, the older individual would be marked as the parent. Isabela used the genetic information to build a pedigree, or a chart that documents each generation of a population. That way she could track how many offspring each parent had produced.

She used these data to answer her question on whether there are benefits to traveling more. Isabela also wanted to compare whether the potential benefits of dispersal differed across the sexes. Males have to compete for females in order to mate. Isabela wanted to know if males that moved more were able to mate with more females and have more offspring.

Featured scientist:

Featured scientists: Isabela Borges (she/her) and Sarah Fitzpatrick (she/her) from the Kellogg Biological Station at Michigan State University.

Flesch–Kincaid Reading Grade Level = 

Additional teacher resources related to this Data Nugget include:

Do urchins flip out in hot water?

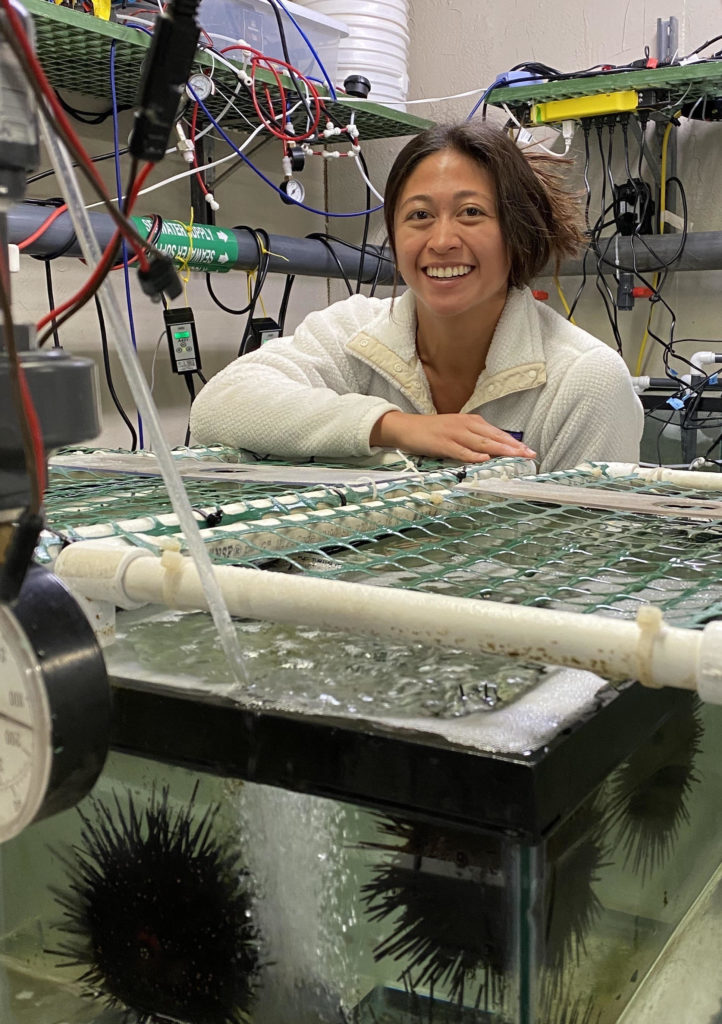
Erin in the urchin lab at UC-Santa Barbara.

The Reading Level 1 activities are as follows:

The Reading Level 3 activities are as follows:

Teacher Resources:

Imagine you are a sea urchin. You’re a marine animal that attaches to hard surfaces for stability. You are covered in spikes to protect you from predators. You eat giant kelp – a type of seaweed. You prefer temperate water, typically between 5 to 16°C. But you’ve noticed that some days the ocean around you feels too hot. 

These periods of unusual warming in the ocean are called marine heatwaves. During marine heatwaves, water gets 2-3 degrees hotter than normal. That might not sound like much, but for an urchin, it is a lot. The ocean’s temperature is normally very consistent, so urchins are used to a small range of temperatures. Urchins are cold-blooded. This means they can’t control their own body temperature and rely on the water around them. Whatever temperature the ocean water is, they are too!

Erin is a scientist who studies how environmental changes, like temperature, affect organisms. Erin first got excited about urchins when she interned with a research lab. When she started graduate school, she learned more about their biology and started to ask questions about how urchins would react to marine heatwaves. Hot water can speed up animals’ metabolisms, making them move and eat more. However, warmer temperatures can also cause stress, potentially causing urchins to be clumsier and confused.

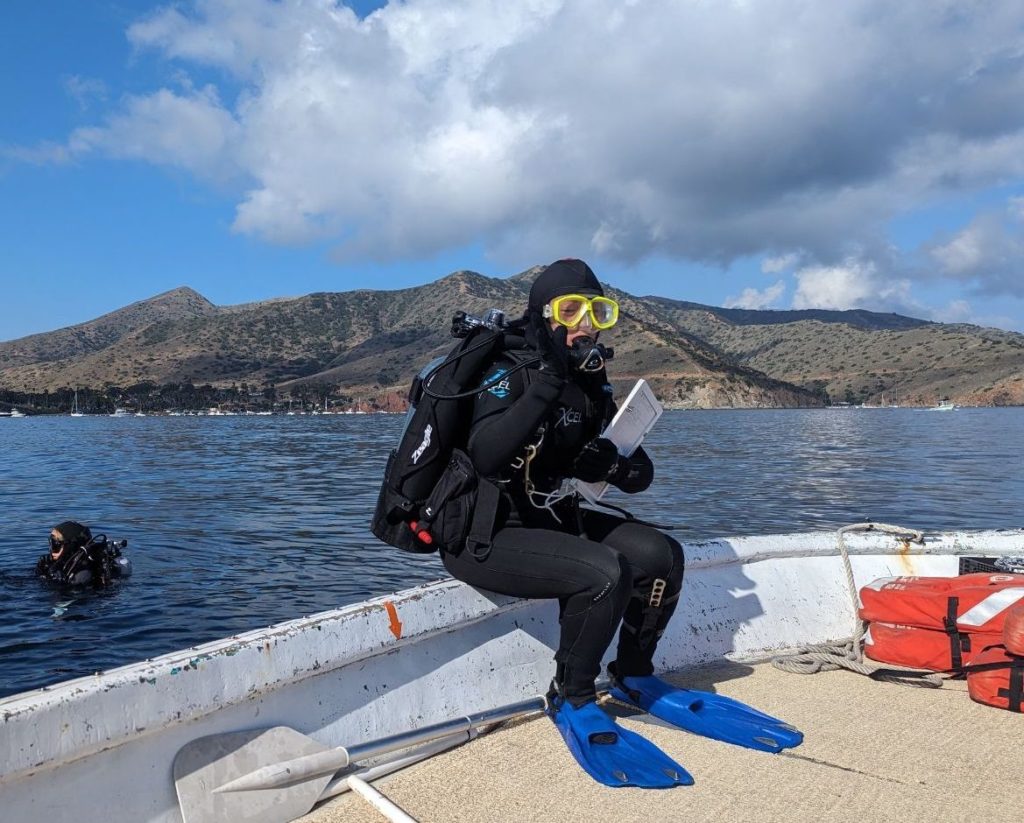
Erin getting ready to scuba dive to look for urchins off the California coast.

One summer, two science teachers, Emily and Traci, came to California to work in the same lab as Erin. Emily and Traci wanted to do science research so they can share their experience with their students.  As a team, they decided to test whether marine heat waves could be stressing urchins by looking at a simple behavior that they could easily measure. Healthy urchins have a righting instinct to flip over to orient themselves “the right way” using their sticky tube feet.

The research team predicted that urchins would be slower to right themselves in warmer temperatures. However, they also thought the response could depend on the temperature the urchins were used to living in. If the urchins had been acclimated to higher temperatures, they might not be as strongly affected by the heatwaves.

Together, Erin, Emily, and Traci took 20 urchins into her lab and split them into 2 groups. Ten were kept at 15°C, the ocean’s normal temperature in summer. The other ten were kept at 18°C, a marine heatwave temperature. They let the urchins acclimate to these temperatures for 2 weeks. They tested how long it took each urchin to right itself after being flipped over. They did this at three temperatures for each urchin: 15°C (normal ocean), 18°C (heatwave), and 21°C (extreme heatwave). They worked together to test the urchins three times at each temperature to get three replicates. Then they calculated the average of each urchin’s responses.

Featured scientists: Erin de Leon Sanchez (she/her) from University of California – Santa Barbara, Emily Chittick (she/her), and Traci Kennedy (she/her) from Milwaukee Public Schools.

Flesch–Kincaid Reading Grade Level = The Content Level 3 activity has a score of 7.9 ; the Level 1 has a score of 5.9

Additional teacher resources related to this Data Nugget include:

  • Here is a video of a parrotfish finding and eating an urchin. Show this video to emphasize how important it is for urchins to be able to right themselves!
Video of a trial where the researchers flipped over an urchin and timed how long it took the urchin to flip back over.
Watch how sea urchins use items from their environment to cover themselves.

Poop, poop, goose!

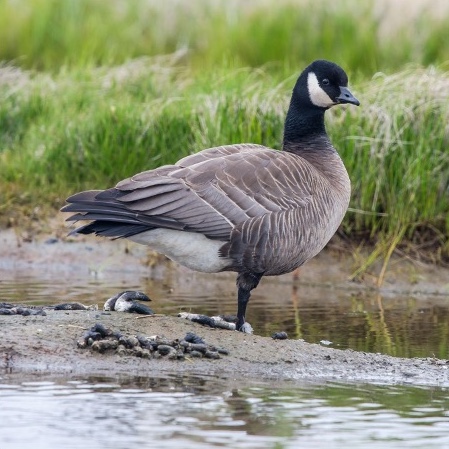
Cackling Goose next to a pile of goose poop, or feces
Cackling Goose next to a pile of goose poop, or feces. Photo by Andrea Pokrzywinski.

The activities are as follows:

Each spring, millions of birds return to the Yukon-Kuskokwim Delta. This delta is where two of the largest rivers in Alaska empty into the Bering Sea. It is also one of the world’s most significant habitats for geese to breed and raise their young. 

With all these geese coming together in one area, they create quite a mess – they drop tons of poop onto the soil. So much poop in fact, that scientists wonder whether poop from this area in Alaska could have a global impact! Climate change is a worldwide environmental issue that is caused by too many greenhouse gasses being released into our atmosphere. Typically, we think of humans as the cause of this greenhouse gas release, but other animals can contribute as well. 

When poop falls onto the soil it is decomposed by bacteria. Bacteria release methane (CH4), a potent greenhouse gas. The more geese there are, the more poop they will produce and the more food there will be for soil bacteria. By increasing the amount of greenhouse gasses that are released by soil bacteria, geese might actually indirectly contribute to global climate change.

Trisha is an ecosystem ecologist who scoops goose poop for research projects. Her research is looking into whether animals, other than humans, can change the carbon cycle. Trisha teamed up with Bonnie, a fellow ecosystem ecologist. Bonnie studies how matter moves between the living parts of the environment, such as plants and animals, and the nonliving parts. She is especially interested in how bacteria in the soil play a role in the carbon cycle.

Together, the team designed a three-year project to figure out the effects of goose poop on the carbon cycle. Each summer, a large team of researchers spend 90 days camping on remote sites near the Yukon-Kuskokwim Delta. The team scooped up poop from nearby goose habitats to use in their experiments. They set up six control plots where they added no poop and six treatment plots where they added poop. From these twelve plots, the team measured methane emissions from the soil. Methane was measured as methane flux in micromoles, or µM. These data helped them determine how ecosystems respond to geese by measuring whether goose poop affects methane production by soil bacteria.  

Featured scientists: Trisha Atwood of Utah State University and Bonnie Waring of Imperial College. Written by Andrea Pokrzywinski.

Flesch–Kincaid Reading Grade Level = 8.7

Additional teacher resources related to this Data Nugget include:

Sink or source? How grazing geese impact the carbon cycle

Tricia (left) installing carbon dioxide plots in the field.

The activities are as follows:

“If it wasn’t for the geese, you and I would not be here today because our ancestors would not have made it. When long, hard winters emptied people’s food caches early, starvation loomed. Return of geese in April saved us.” – Chuck Hunt, born and raised on the Yukon-Kuskokwim Delta

Spring geese are an essential food source for subsistence communities like Chevak, Alaska. Elders in western Alaska Native communities have observed a decrease in geese returning to their villages over time. These changes affect the local communities and could also affect the local ecosystem.

One way geese change their environment is by eating grass. In the Yukon-Kuskokwim Delta in western Alaska, birds from every continent on Earth migrate to this sub-Arctic habitat to lay their eggs and raise their young. Once they arrive, geese eat a ton of grass. They graze only in specific areas, called grazing lawns, leaving the rest of the vegetation alone.

When geese graze on wetland plants, they remove plant matter, potentially decreasing the amount of carbon dioxide, or CO2, that is released during photosynthesis. As plants photosynthesize, they absorb CO2 from the atmosphere and turn it into glucose (a sugar) and oxygen. Gross primary production is the total amount of energy that plants capture from sunlight to grow and live before they use up some of that energy for themselves. Plants can slow climate change by removing CO2 from the atmosphere and turning it into plant matter, like leaves and roots.

A scientist mimics geese grazing by clipping the grass.

Trisha is a scientist who became interested in ways that animals can affect the carbon cycle through their interactions with the environment. She wondered whether fewer geese returning to western Alaska could have global consequences that extend beyond remote communities. She thought that if geese ate enough grass, they may limit photosynthesis. This is important because it could change whether this ecosystem is a carbon sink or a carbon source. An ecosystem is called a carbon sink if it absorbs more CO2 through photosynthesis than it releases through respiration. Alternatively, an ecosystem can be a carbon source if more CO2 is released than absorbed. We want ecosystems to be carbon sinks because then they keep CO2 out of the atmosphere, where it contributes to global warming.

To test her idea, Trisha teamed up with fellow scientists Bonnie, Karen, and Jaron to take a closer look at how grazing grass influences whether the Y-K Delta ecosystem is releasing or absorbing CO2. To do their experiment they had to get creative. They considered getting a lot of geese, bringing them to an ungrazed area, and letting them chow down. However, it’s hard to capture geese and get them to graze exactly where you want. So instead, the research team simulated the effects of geese by cutting the grass to mimic nibbling and then gently vacuuming the pieces of grass to remove them.

The “Carbon and Geese” scientist team.

The team set up six different experimental areas. Inside each area were two plots: one that was left ungrazed, and the other which was artificially grazed. The research team then used a piece of equipment called a LI-COR to measure the quantity of CO2 in the air above each plot. They recorded the CO2 levels during the day and night. The comparison from day to night is one way to look at gross primary production and respiration in a system. At night, when there is no light, plants can’t photosynthesize, so the detected CO2 will be from respiration. The levels during the day represent a combination of CO2 absorption by plants and release from respiration.

To assess whether the ecosystem is a carbon sink or source, we need to determine the difference between respiration and gross primary production, or net ecosystem exchange (NEE). A negative NEE means the ecosystem absorbs more CO2 than it emits. A positive NEE means the ecosystem is releasing more CO2 than it is absorbing. In this way, scientists classify an ecosystem as either a carbon sink that is storing carbon or a carbon source that is releasing carbon into the atmosphere.

Featured scientists: Trisha Atwood, Karen Beard, and Jaron Adkins from Utah State University and Bonnie Waring from Imperial College. Written by Andrea Pokrzywinski.

Flesch–Kincaid Reading Grade Level: 8.9

Additional teacher resources related to this Data Nugget:

Check out this website created by teacher Andrea who participated in the research and wrote this Data Nugget. You will find additional lesson plans, videos, slides, and articles to use in the classroom!

Size matters – and so does how you carry it!

The activities are as follows:

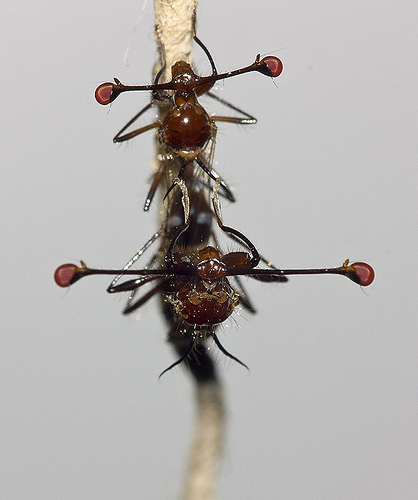
Stalk-eyed fly copulation.

In the wild, animals compete for limited resources. Things like food, water, shelter, and even reproductive mates can be hard to come by. Animals with traits and behaviors that make them more likely to survive and reproduce are said to have higher evolutionary fitness. Some animals have evolved special traits that advertise their fitness to potential mates. Male deer, elk, and moose have large antlers that they use to compete with other males, which demonstrates their fitness to females. Another interesting example is the stalk-eyed flies, in which the males grow long eye stalks to attract a mate. In these cases, females are more likely to choose males with the biggest traits.

Scientists have long predicted that these traits come with both benefits and costs. Large antlers or eyestalks may help a mate notice you, but also come with some costs. Extra weight takes more energy to move around and could make it more difficult to escape from predators. And yet, many studies have failed to find any measurable costs to males having these seemingly impractical traits.

This scientific mystery puzzled Jerry and John, who study stalk-eyed flies. They had failed to identify and document any costs to having longer eyestalks, measured as the distance between the eyes, or eyespan. Common sense told them that having longer eye stalks should make flying more awkward for these flies. However, their data did not support this hypothesis. “When I started collecting data, I focused a lot on the performance costs and got kind of fixated on that,” John says of the team’s initial research. “It was frustrating when we couldn’t identify any actual decline in performance.”

John in the field when he first started his research – many decades ago!

The team began looking for an alternative explanation. They read about research supporting a new idea in a completely different kind of flying animal – barn swallows. Male barn swallows have long, ornate tails. These tails make male barn swallows less aerodynamic during flight. But males have also evolved to have larger wings relative to their body size. This could help them compensate for the extra burden associated with their long tails.

Jerry and John wondered if a similar thing might be at work in stalk-eyed fly wings. Perhaps the male stalk-eyed flies, like male barn swallows, had evolved to have larger wings relative to their body size to help them compensate for long eye stalks when flying. If this were the case, then they expected to see a positive correlation between wing size and eyespan. Could this be why they were unable to measure any disadvantage associated with having longer, more awkward eye stalks? In other words, male stalk-eyed flies with larger wings would be able to support longer eye stalks.

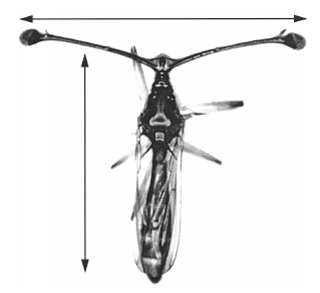
Eyespan (horizontal arrow) and body size (vertical arrow) of a stalk-eyed fly.

Jerry, John, and their team decided to test their new hypothesis by raising stalk-eyed flies in the lab to maturity, then collecting data about their body length, eyespan, and wing area.

To account for natural variation in body size among stalk-eyed flies, the team needed to use “relative” measurements based on body size. With these kinds of measurements, a value of zero (0) means that wing size or eyespan is exactly what you would predict for a fly of that body size. Negative values mean that wing size or eyespan are smaller than you would predict for that body size, while positive values mean that wing size or eyespan is greater than you would predict for that body size. For example, if a fly has a relative eyespan of -0.010, then the distance between the eyestalks was 0.010 millimeters shorter than expected based on its body size.

Featured scientists: Jerry Husak from the University of St. Thomas and John Swallow from the University of Colorado-Denver. Written by: Sam Holloway

Flesch–Kincaid Reading Grade Level = 8.8

Additional teacher resources related to this Data Nugget include:

You can find lessons to accompany many of John’s studies with insects on the Data Nuggets website! Check out the following Data Nugget activities!

A peer-reviewed journal article: Husak, J. F., Ribak, G., Wilkinson, G. S., & Swallow, J. G. 2011. Compensation for exaggerated eye stalks in stalk‐eyed flies (Diopsidae). Functional Ecology, 25(3), 608-616.

A video of a stalk-eyed fly in flight:

Mowing for Monarchs – Extension Activities

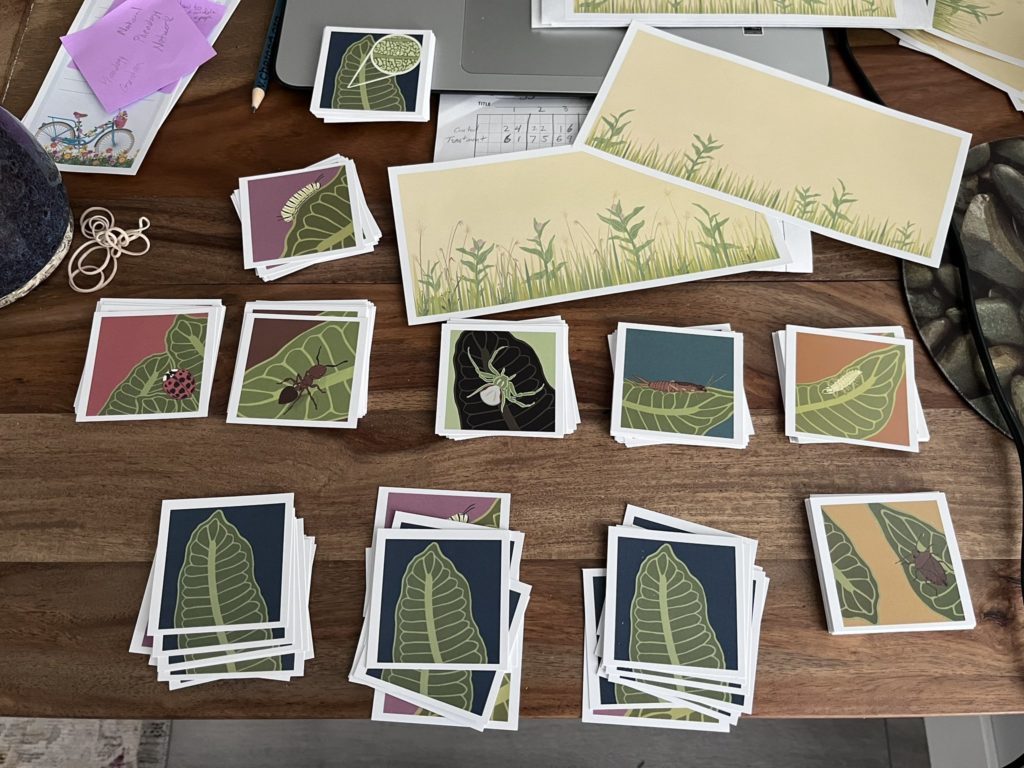
Gabe Knowles has developed and piloted several data activities to accompany these Data Nuggets activities. For the first activity, Gabe developed an extension to bring his data into elementary classrooms. Using beautiful art created by Corinn Rutkoski, the following are materials to print and use the activity in your classroom:

This activity was first piloted at Michigan Science Teachers Association Annual Meeting in 2023.

Benthic buddies

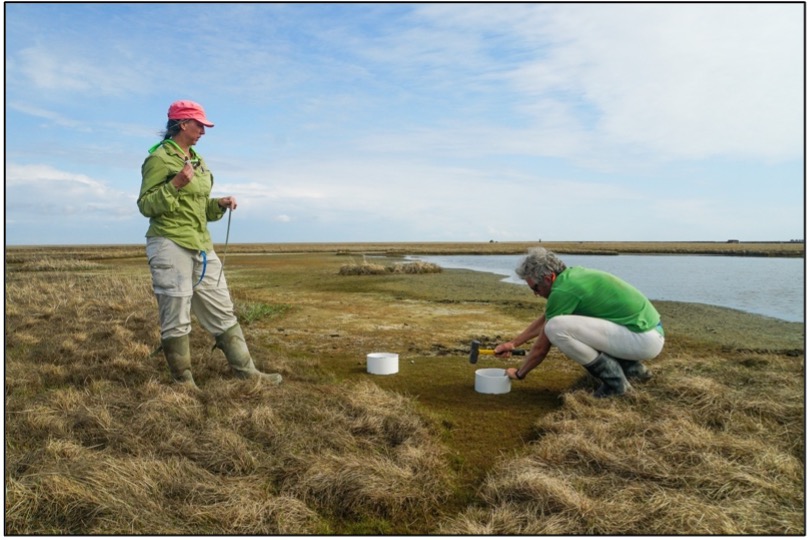
Danny and Kaylie sampling benthic animals

The activities are as follows:

Lagoons are areas along the coast where a shallow pocket of sea water is separated from the ocean most of the time. During some events, like high tides, the ocean water meets back up with the lagoon. Coastal lagoons are found all over the world – even in the most northern region of Alaska, called the High Arctic!

These High Arctic lagoons go through many extreme changes each season. In April, ice completely covers the surface. The mud at the bottom of the shorelines is frozen solid. In June, the ice begins to break up and the muddy bottoms of the lagoons begin to thaw. The melting ice adds freshwater to the lagoons and lowers the salt levels. In August, lagoon temperatures continue to rise until there is only open water and soft mushy sediment.

You would think these harsh conditions would make High Arctic lagoons not suitable to live in. However, these lagoons support a surprisingly wide range of marine organisms! Marine worms, snails, and clams live in the muddy sediment of these lagoons. This habitat is also called the bottom, or benthic, environment. Having a rich variety of benthic animals in these habitats supports fish, which migrate along the shoreline and eat these animals once the ice has left. And people who live in the Arctic depend on fishing for their food.

Ken, Danny, and Kaylie are a team of scientists from Texas interested in learning more about how the extreme seasons of the High Arctic affect the marine life that lives there. They want to know whether the total number of benthic species changes with the seasons. Or does the benthic community of worms, snails, and clams stay constant throughout the year regardless of ice, freezing temperatures, and large changes in salt levels? The science team thought that the extreme winter conditions in the Arctic lagoons cause a die-off each year, so there would be fewer species found at that time. Once the ice melts each year, benthic animals likely migrate back into the lagoons from deeper waters and the number of species would increase again.

Ken, Danny, and Kaylie had many discussions about how they could answer their questions. They decided the best approach would be to travel to Alaska to take samples of the benthic animals. To capture the changes in lagoon living conditions, they would need to collect samples during the three distinct seasons.

Benthic organisms from a sample

The science team chose to sample Elson Lagoon because it is in the village of Utqiaġvik, Alaska and much easier to reach than other Arctic lagoons. They visited three times. First, in April, during the ice-covered time, again in June when the ice was breaking up, and a final time in summer when the water was warmer. In April, they used a hollow ice drill to collect a core sample of the frozen sediment beneath the ice. In June and August, they deployed a Ponar instrument into the water, which snaps shut when it reaches the lagoon bottom to grab a sample. Each time they visited the lagoon, they collected two sediment samples.

Back in the lab, they rinsed the samples with seawater to remove the sediment and reveal the benthic animals. The team then sorted and identified the species present. They recorded the total number of different species, or species richness, found in each sample.

Featured scientists: Ken Dunton, Daniel Fraser, and Kaylie Plumb from the University of Texas Marine Science Institute

Written by: Maria McDonel from Flour Bluff and Corpus Christi Schools

Flesch–Kincaid Reading Grade Level = 8.9

Additional teacher resources related to this Data Nugget include:

Does more rain make healthy bison babies?

A bison mom and her calf.

The activities are as follows:

The North American Bison is an important species for the prairie ecosystem. They are a keystone species, which means their presence in the ecosystem affects many other species around them. For example, they roll on the ground, creating wallows. Those wallows can fill up with water and create a mini marsh ecosystem, complete with aquatic plants and animals. They also eat certain kinds of food – especially prairie grasses. What bison don’t eat are wildflowers, so where bison graze there will be more flowers present than in the areas avoided by bison. This affects many insects, especially the pollinators that are attracted to the prairie wildflowers that are abundant in in the bison area. 

Not only do bison affect their environment, but they are also affected by it. Because bison eat grass, they often move around because the tastiest meals might be scattered in different areas of the prairie. Also, as bison graze down the grass in one area they will leave it in search of a new place to find food. The amount of food available is largely dependent upon the amount of rain the area has received. The prairie ecosystem is a large complex puzzle with rain and bison being the main factors affecting life there. 

The Konza Prairie Biological Station in central Kansas has a herd of 300 bison. Scientists study how the bison affect the prairie, and how the prairie affects the bison. Jeff started at Konza as a student, and today he is the bison herd manager. As herd manager, if is Jeff’s duty to track the health of the herd, as well as the prairie. 

One of the main environmental factors that affect the prairie’s health is rainfall. The more rain that falls, the more plants that grow on the prairie. This also means that in wetter years there is more food for bison to eat. Heavier bison survive winters better, and then may have more energy saved up to have babies in the following spring. Jeff wanted to know if a wet summer would actually lead to healthier bison babies, called calves, the following year.

Jeff and other scientists collect data on the bison herd every year, including the bison calves. Every October, all the bison in the Konza Prairie herd are rounded up and weighed. Since most of the bison calves are born in April or May, they are about 6 months old by the time are weighed. The older and the healthier the calf is, the more it weighs. Very young calves, including those born late in the year, may be small and light, and because of this they may have a difficult time surviving the winter. 

Jeff also collects data on how much rain and snow, called precipitation, the prairie receives every year. Precipitation is measured daily at the biological station and then averaged for each year. Precipitation is important because it plays a direct role in how well the plants grow. 

Jeff and a herd of bison on the Konza prairie.
Konza LTER logo

Featured scientist: Jeff Taylor from the Konza Prairie Biological Station

Written by: Jill Haukos, Seton Bachle, and Jen Spearie

Flesch–Kincaid Reading Grade Level = 8.7

Additional teacher resources related to this Data Nugget include:

  • The full dataset for bison herd data is available online! The purpose of this study is to monitor long-term changes in individual animal weight. The datasets include an annual summary of the bison herd structure, end-of-season weights of individual animals, and maternal parentage of individual bison. The data in this activity came from the bison weight dataset (CBH012).
  • For more information on calf weight, check out the LTER Book Series book, The Autumn Calf, by Jill Haukos.

Mowing for monarchs, Part II

In Part I you explored data that showed monarchs prefer to lay their eggs on young milkweeds that have been mowed, compared to older milkweed plants. But, is milkweed age the only factor that was changed when Britney and Gabe mowed patches of milkweeds? You will now examine whether mowing also affected the presence of monarch predators.

A scientist measuring a milkweed plant.
A scientist, Lizz D’Auria, counting the number of monarch predators on milkweed plants in the experiment.

The activities are as follows:

The bright orange color of monarch butterflies signals to their enemies that they are poisonous. This is a warning that they do not make a tasty meal. Predators, like birds and spiders, that try to eat monarch butterflies usually become sick. Many people think that monarch butterflies have no enemies because they are poisonous. But, in fact they do have a lot of predators, especially when they are young.

Monarchs become poisonous from the food they eat. Adult monarchs lay their eggs on milkweed plants, which have poisonous sap. When the eggs hatch, the caterpillars chomp on the leaves. Young caterpillars are less poisonous because they haven’t eaten much milkweed yet. And monarch eggs are not poisonous at all to predators.

Britney and Gabe met with their friends, Doug and Nate, who are scientists. Doug and Nate thought that Britney and Gabe’s experiment might have changed more than just the age of the milkweed plants in the patches they mowed. By mowing their field sites they were also cutting down the plants in the rest of the community. These plants provide habitat for predators, so mowing all of the plants would affect the predators as well. These ideas led to another potential explanation for the results Britney and Gabe saw in their data. Because all plants were cut in the mowed patches, there was nowhere for monarch predators to hang out. Britney and Gabe came up with an alternative hypothesis that perhaps monarch butterflies were choosing to lay their eggs on young milkweed plants because there were fewer predators nearby. To test this new idea, Britney and Gabe went back to their experimental site and started collecting data on the presence of predators in addition to egg number. Remember that in each location, they had a control patch, which was left alone, and a treatment patch that they mowed. The control patches had older milkweed plants and a full set of plants in the community. The mowed patches had young milkweed plants with short, chopped plants nearby. For the whole summer, they went out weekly to all of the patches. They counted the number of predators found on the milkweed plants so they could compare the mowed and unmowed patches.

Predators of monarch butterflies.
There are many different species that eat monarch butterfly eggs and young caterpillars. These are just a few of the species that Gabe and Britney observed during their experiment.

Featured scientists: Doug Landis and Nate Haan from Michigan State University and Britney Christensen and Gabe Knowles from Kellogg Biological Station LTER.

Flesch–Kincaid Reading Grade Level = 8.2

Additional resources related to this Data Nugget:

  • A news article discussing declining monarch populations and the causes that might be contributing to this trend.

Ant wars!

Three pavement ants touch antennae to determine if they are nestmates. Photo courtesy Michael Greene.

The activities are as follows:

The ants crawling into and out of cracks along sidewalks are called pavement ants. They live in groups called colonies, which are made up of a few queens and many worker ants. A colony lives together inside a nest, a physical structure. Worker ants use their antennae to touch the bodies of other ants. Certain chemicals tell them if the ant is from their colony or a different colony. Nestmates are ants from the same colony, and non-nestmates are ants from other colonies. 

Neighboring colonies often compete for food, leading to tension. If an ant finds a non-nestmate, it organizes a large war against the nearby colony. This results in huge sidewalk battles that can include thousands of ants fighting for up to 12 hours! These ant wars often involve worker ants grabbing body parts of non-nestmate ants. 

Andrew, Jazmine, John, Mike, and Ken all work together to study the social and chemical cues that drive behaviors in animals. They were curious to learn more about the triggers that lead to colony wars. Worker ants don’t have a leader, so the scientists wanted to know how large wars are organized. The team started by reading lots of research articles and learned that there are several factors that may affect an ant’s decision to fight. These include the odor of other ants they meet, the size of the ant’s colony, and the season. The team also knew from their own experiments that if an ant meets a fellow nestmate before meeting a non-nestmate, it was more likely to fight.

A colony war involving thousands of pavement ants. Photo credit: Michael Greene.

All of this information helped the team realize that interactions with nestmates were an important part of the decisions that start ant wars with non-nestmakes. To build on this, they wanted to know whether the decision to fight was affected by ant density, which is the number of ants within an area. They thought that at higher densities the ants would be more likely to interact, leading to more fights with non-nestmates. If more wars are observed at higher ant densities, increased interactions with nestmates might be part of the story.

To answer their question, the team collected ants from different colonies in Denver, Colorado for two separate experiments. They brought them back to the lab to set up trials in a plastic tank arena.

Experiment 1: For the first set of behavioral trials, the researchers varied the number of ants in the tank, ranging from 2 to 20 ants. The size of the tank remained constant, and there were always equal numbers of nestmates and non-nestmates. This means the ratio of nestmates to non-nestmates was always 1:1, but the density varied by how many ants were included in the experiment. They performed 18 trials for each density treatment in their experiment.

At the start of every trial, ants from each colony were in separate areas so that they could interact with nestmates first. Earlier work had shown that when ants in each area interact, they touch antennae to another ant’s body. These interactions create a brain state that makes an ant more likely to fight an ant from another colony. Then the scientists removed a barrier revealing the ants from the other colony. They watched the ants for 3 minutes. During that time they recorded the number of ants that were fighting. This way they could compare how likely the ants were to fight at different densities. They predicted there would would be more fighting at higher ant densities.

Experiment 2: The scientists also wanted to measure the effect of density on the interaction rates between just nestmates. This experiment allowed the scientists to understand how the rate of interactions affected levels of neurochemicals in brains, creating the brain state that increased the likelihood that an ant would be aggressive. For these trials, they placed different densities of nestmate ants in a tank. They randomly picked an ant during each trial and counted the number of times it contacted a nestmate ant. Different groups of ants were used in each trial and each experiment. They observed the number of interactions at different densities and expected nestmate ants to have more interactions at higher densities.

Featured scientists: Andrew Bubak, Jazmine Yaeger, John Swallow, and Michael J. Greene from the University of Colorado-Denver; Kenneth Renner from the University of South Dakota. Written by: Gabrielle Welsh

Flesch–Kincaid Reading Grade Level = 9.0

Additional teacher resources related to this Data Nugget:

A news article about the research: