Data Nuggets are built using a simple and flexible format, and can be embedded throughout existing curriculum to help students develop their quantitative abilities over time. Content levels and graph types allow for differentiated learning for students with any science or reading background.
To request access to the Data Nugget teacher guides, please complete this form. We will respond to your request by e-mail within 1-3 business days.
Each Data Nugget comes with three versions of the student activity (A-C) and a Teacher Guide. Teacher Guides provide example student responses, links to resources, and additional information about the research and scientist. Following the same structure as the student versions, we designed these guides to enrich classroom discussions by including suggested stopping points for class discussion and clarifications. There are three types of stopping points:
-
Teacher Notes: Provide additional background information for teachers, as well as suggestions for discussion topics. For example, we may share information provided by the scientist, detailing what their next research steps were after collecting the data presented in the activity.
-
Checks for Understanding: Provide stopping points for teachers to assess student understanding. These are particularly useful after students finish reading the Background Information sections or have just started to view and work with the data.
-
Meta Moments: Provide stopping points for students to think about their own thinking. Stepping back from the research, students can discuss the decisions they are making as they work though the Data Nugget, such as the way they chose to visualize their data to ease interpretation and support their claims.
At the end of each Teacher Guide we provide a list of additional resources related to each Data Nugget. These may include primary literature, videos that the scientist has made about their research, blog posts or other popular articles about the research included in the Data Nugget, or additional photos and images.
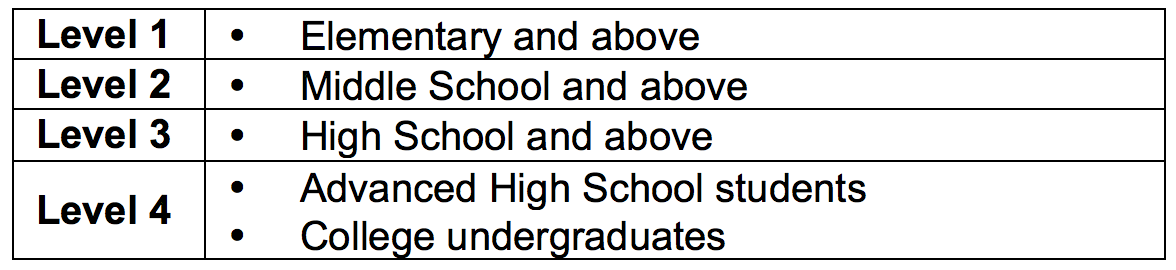
Content Levels (1-4)
Data Nugget activities are ranked from 1-4 according to the reading, vocabulary, and content level of the background information provided to students. Readability for each activity is determined using the Flesch–Kincaid Reading Grade Level, which calculates how difficult a reading passage in English is to understand. Content level is determined by aligning each activity with science standards and discussions with our advisor panel of K-12 teachers. Activities of the highest level (4) are probably inappropriate for younger students, but level 1 activities are still appropriate to use with higher-level students if the quantitative skills they teach are relevant.
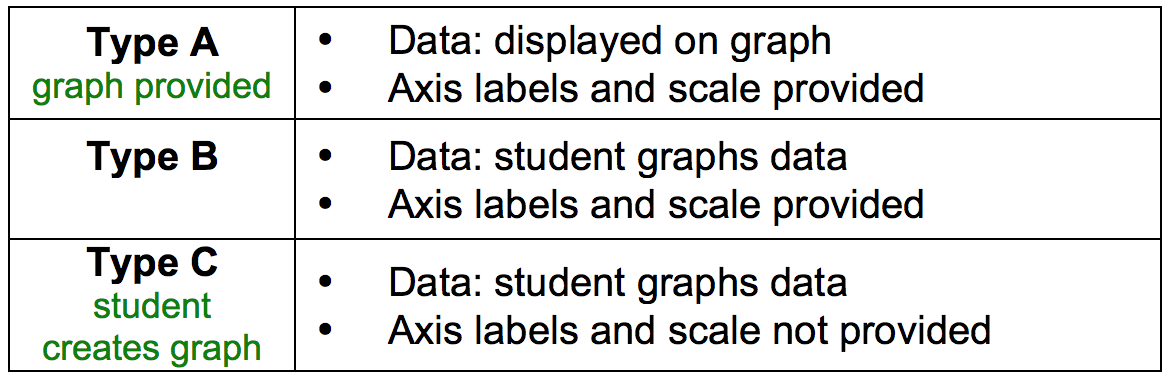
Graph Types (A-C)
Each Data Nugget comes with three student versions, based on the type of graphing skills required. Type A activities provide the graph for the students (allowing a focus on graph interpretation, making claims based on evidence, and explaining reasoning), Type B activities provide axis labels but requires students to graph the data, and Type C provides an unlabeled grid on which to draw a graph.