Guppies on the move

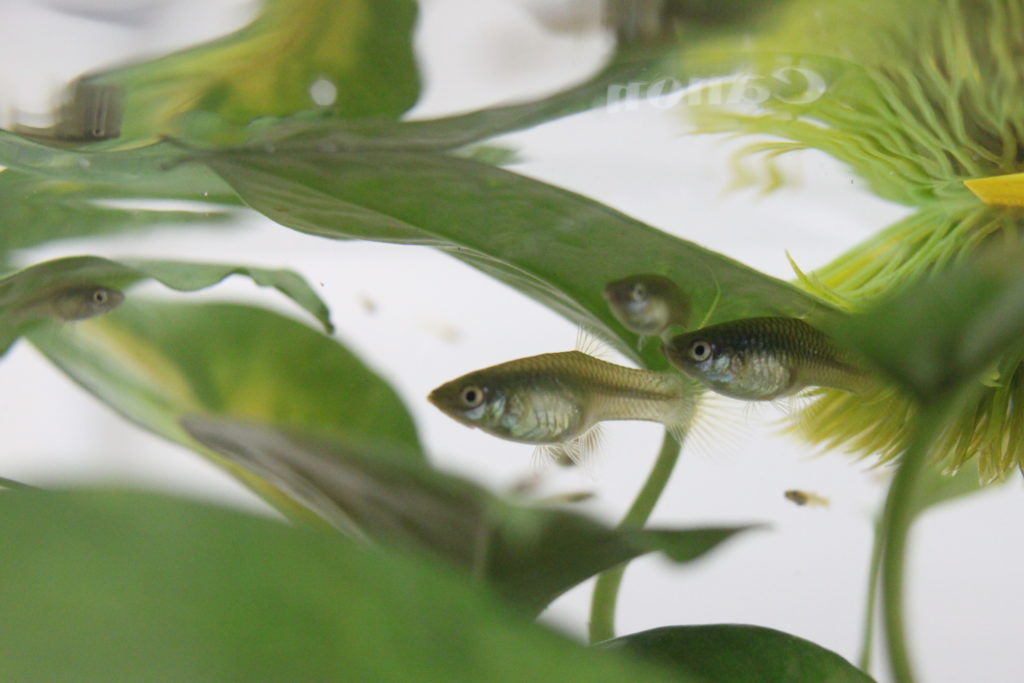
Guppies in the lab. Photo Credit: Eva Fischer.

The activities are as follows:

  • Teacher Guide
  • Student activity, Graph Type A, Level 3
  • Student activity, Graph Type B, Level 3
  • Student activity, Graph Type C, Level 3
  • Grading Rubric

Animal parents often choose where to have their offspring in the place that will give them the best chance at success. They look for places that have plentiful food, low risk of predation, and good climate.

Even though parents pick out these spots, individuals often move away from their birthplace at some point in their lives. Why do animals move away? There are risks that come with moving from one place to another. It can be dangerous to go through unknown places – potentially stumbling into predators or being exposed to diseases. But there can also be benefits to moving, such as discovering a better spot to live as an adult, finding mates, and spreading out to reduce competition.

As someone who loves to travel and has lived in four different countries, Isabela can relate! Isabela likes to see new places, try new foods, and learn new languages. But there can be drawbacks, and occasionally she finds it hard to be in a completely new place. Sometimes people don’t understand her accent, or she can’t understand them. She also misses her family when she is away. Knowing that traveling and moving can have such highs and lows for herself, Isabela wanted to know more about what motivates animals to seek out new places.

To follow her curiosity, Isabela found a graduate advisor who was also interested in animal movement. She joined Sarah’s lab because she had already collected data on the movement of small tropical fish called guppies. Sarah is part of a large collaborative project, where researchers from all over the world come together in Trinidad to study these fish populations.

When Sarah first started collecting data in this system, she wanted to track how far guppies move from one place to the next. She used established protocols from previous work in this system to set up a study. With the help of a team, she captured every fish in two similar streams for replication. Every fish that was caught was marked with a small tattoo so the research team could recognize it if it was found again in the future. She did this same procedure every month for 14 months. Each time she sampled the fish, she recorded the individuals that she found and where they were found.

Isabela used this dataset to ask whether guppies benefit from moving from one place to another. In this study, she focused on one type of benefit: having a higher number of offspring. It is through reproduction that animals are able to pass on their genes, so the more offspring an individual fish has, the more successful it is.

First, Isabela used the existing dataset to find out how far each fish moved: if Fish 1 was captured in Portion A of a stream in February and then in Portion B of the same stream in March, Isabela knew it had to move from A to B. She could use the timepoints to estimate how far each individual had traveled that month.

Second, Isabela used genetics to find out how many offspring each fish had. She looked at genetic markers to determine familial relationships between individuals in each stream. For example, two fish that shared 50% of their genes were probably a parent and an offspring. In this case, the older individual would be marked as the parent. Isabela used the genetic information to build a pedigree, or a chart that documents each generation of a population. That way she could track how many offspring each parent had produced.

She used these data to answer her question on whether there are benefits to traveling more. Isabela also wanted to compare whether the potential benefits of dispersal differed across the sexes. Males have to compete for females in order to mate. Isabela wanted to know if males that moved more were able to mate with more females and have more offspring.

Featured scientist:

Featured scientists: Isabela Borges (she/her) and Sarah Fitzpatrick (she/her) from the Kellogg Biological Station at Michigan State University.

Flesch–Kincaid Reading Grade Level = 

Additional teacher resources related to this Data Nugget include:

Do urchins flip out in hot water?

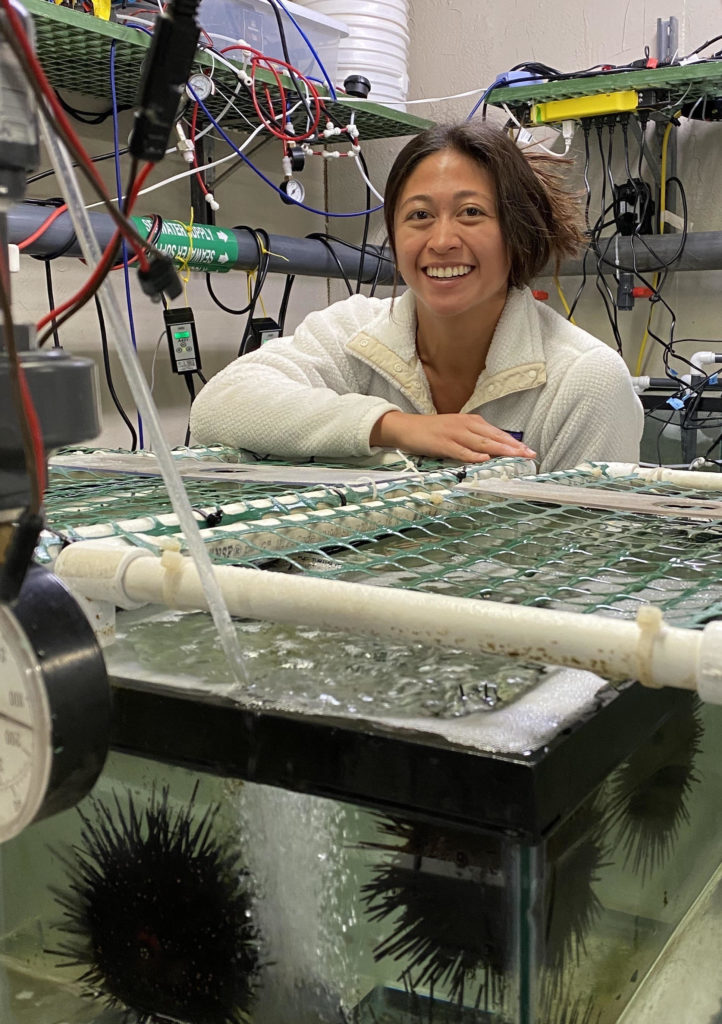
Erin in the urchin lab at UC-Santa Barbara.

The Reading Level 1 activities are as follows:

The Reading Level 3 activities are as follows:

Teacher Resources:

Imagine you are a sea urchin. You’re a marine animal that attaches to hard surfaces for stability. You are covered in spikes to protect you from predators. You eat giant kelp – a type of seaweed. You prefer temperate water, typically between 5 to 16°C. But you’ve noticed that some days the ocean around you feels too hot. 

These periods of unusual warming in the ocean are called marine heatwaves. During marine heatwaves, water gets 2-3 degrees hotter than normal. That might not sound like much, but for an urchin, it is a lot. The ocean’s temperature is normally very consistent, so urchins are used to a small range of temperatures. Urchins are cold-blooded. This means they can’t control their own body temperature and rely on the water around them. Whatever temperature the ocean water is, they are too!

Erin is a scientist who studies how environmental changes, like temperature, affect organisms. Erin first got excited about urchins when she interned with a research lab. When she started graduate school, she learned more about their biology and started to ask questions about how urchins would react to marine heatwaves. Hot water can speed up animals’ metabolisms, making them move and eat more. However, warmer temperatures can also cause stress, potentially causing urchins to be clumsier and confused.

Erin getting ready to scuba dive to look for urchins off the California coast.

One summer, two science teachers, Emily and Traci, came to California to work in the same lab as Erin. Emily and Traci wanted to do science research so they can share their experience with their students.  As a team, they decided to test whether marine heat waves could be stressing urchins by looking at a simple behavior that they could easily measure. Healthy urchins have a righting instinct to flip over to orient themselves “the right way” using their sticky tube feet.

The research team predicted that urchins would be slower to right themselves in warmer temperatures. However, they also thought the response could depend on the temperature the urchins were used to living in. If the urchins had been acclimated to higher temperatures, they might not be as strongly affected by the heatwaves.

Together, Erin, Emily, and Traci took 20 urchins into her lab and split them into 2 groups. Ten were kept at 15°C, the ocean’s normal temperature in summer. The other ten were kept at 18°C, a marine heatwave temperature. They let the urchins acclimate to these temperatures for 2 weeks. They tested how long it took each urchin to right itself after being flipped over. They did this at three temperatures for each urchin: 15°C (normal ocean), 18°C (heatwave), and 21°C (extreme heatwave). They worked together to test the urchins three times at each temperature to get three replicates. Then they calculated the average of each urchin’s responses.

Featured scientists: Erin de Leon Sanchez (she/her) from University of California – Santa Barbara, Emily Chittick (she/her), and Traci Kennedy (she/her) from Milwaukee Public Schools.

Flesch–Kincaid Reading Grade Level = The Content Level 3 activity has a score of 7.9 ; the Level 1 has a score of 5.9

Additional teacher resources related to this Data Nugget include:

  • Here is a video of a parrotfish finding and eating an urchin. Show this video to emphasize how important it is for urchins to be able to right themselves!
Video of a trial where the researchers flipped over an urchin and timed how long it took the urchin to flip back over.
Watch how sea urchins use items from their environment to cover themselves.

Mowing for Monarchs – Extension Activities

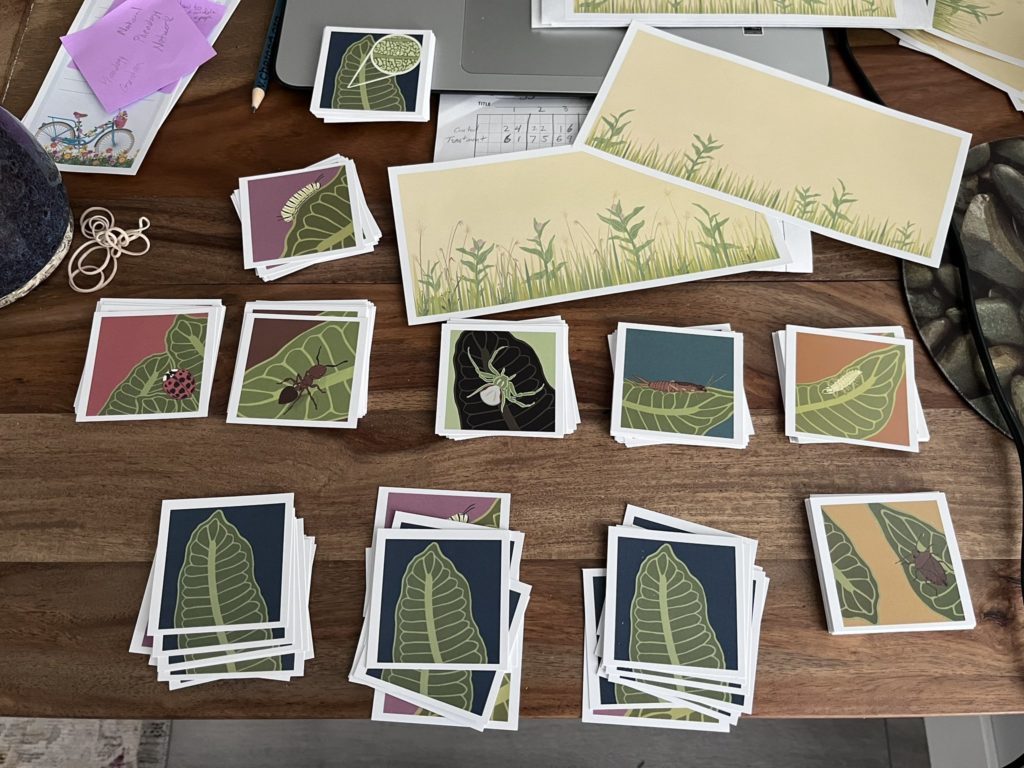
Gabe Knowles has developed and piloted several data activities to accompany these Data Nuggets activities. For the first activity, Gabe developed an extension to bring his data into elementary classrooms. Using beautiful art created by Corinn Rutkoski, the following are materials to print and use the activity in your classroom:

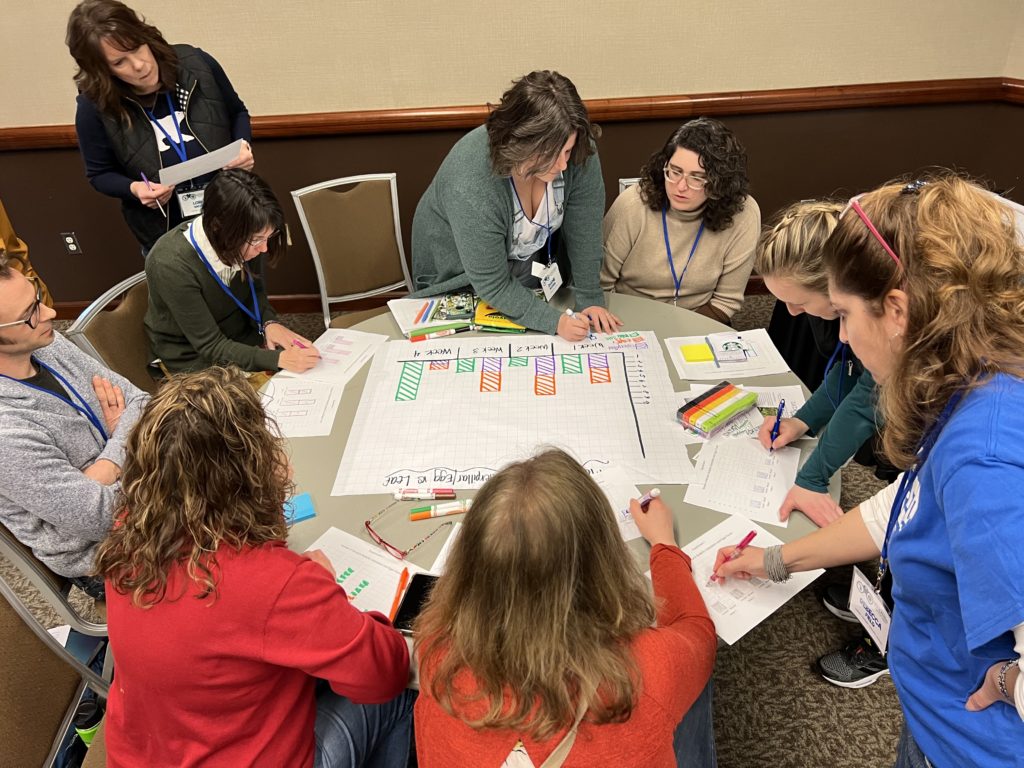
This activity was first piloted at Michigan Science Teachers Association Annual Meeting in 2023.

Mowing for monarchs, Part II

In Part I you explored data that showed monarchs prefer to lay their eggs on young milkweeds that have been mowed, compared to older milkweed plants. But, is milkweed age the only factor that was changed when Britney and Gabe mowed patches of milkweeds? You will now examine whether mowing also affected the presence of monarch predators.

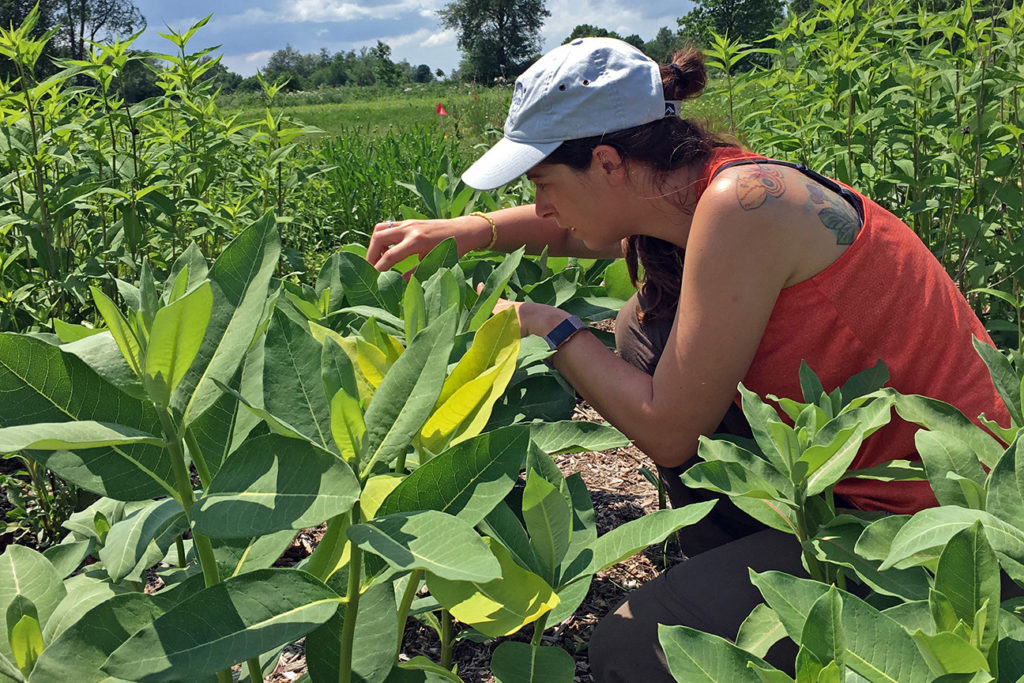
A scientist measuring a milkweed plant.
A scientist, Lizz D’Auria, counting the number of monarch predators on milkweed plants in the experiment.

The activities are as follows:

The bright orange color of monarch butterflies signals to their enemies that they are poisonous. This is a warning that they do not make a tasty meal. Predators, like birds and spiders, that try to eat monarch butterflies usually become sick. Many people think that monarch butterflies have no enemies because they are poisonous. But, in fact they do have a lot of predators, especially when they are young.

Monarchs become poisonous from the food they eat. Adult monarchs lay their eggs on milkweed plants, which have poisonous sap. When the eggs hatch, the caterpillars chomp on the leaves. Young caterpillars are less poisonous because they haven’t eaten much milkweed yet. And monarch eggs are not poisonous at all to predators.

Britney and Gabe met with their friends, Doug and Nate, who are scientists. Doug and Nate thought that Britney and Gabe’s experiment might have changed more than just the age of the milkweed plants in the patches they mowed. By mowing their field sites they were also cutting down the plants in the rest of the community. These plants provide habitat for predators, so mowing all of the plants would affect the predators as well. These ideas led to another potential explanation for the results Britney and Gabe saw in their data. Because all plants were cut in the mowed patches, there was nowhere for monarch predators to hang out. Britney and Gabe came up with an alternative hypothesis that perhaps monarch butterflies were choosing to lay their eggs on young milkweed plants because there were fewer predators nearby. To test this new idea, Britney and Gabe went back to their experimental site and started collecting data on the presence of predators in addition to egg number. Remember that in each location, they had a control patch, which was left alone, and a treatment patch that they mowed. The control patches had older milkweed plants and a full set of plants in the community. The mowed patches had young milkweed plants with short, chopped plants nearby. For the whole summer, they went out weekly to all of the patches. They counted the number of predators found on the milkweed plants so they could compare the mowed and unmowed patches.

Predators of monarch butterflies.
There are many different species that eat monarch butterfly eggs and young caterpillars. These are just a few of the species that Gabe and Britney observed during their experiment.

Featured scientists: Doug Landis and Nate Haan from Michigan State University and Britney Christensen and Gabe Knowles from Kellogg Biological Station LTER.

Flesch–Kincaid Reading Grade Level = 8.2

Additional resources related to this Data Nugget:

  • A news article discussing declining monarch populations and the causes that might be contributing to this trend.

Ant wars!

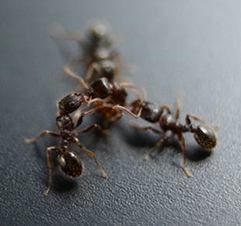
Three pavement ants touch antennae to determine if they are nestmates. Photo courtesy Michael Greene.

The activities are as follows:

The ants crawling into and out of cracks along sidewalks are called pavement ants. They live in groups called colonies, which are made up of a few queens and many worker ants. A colony lives together inside a nest, a physical structure. Worker ants use their antennae to touch the bodies of other ants. Certain chemicals tell them if the ant is from their colony or a different colony. Nestmates are ants from the same colony, and non-nestmates are ants from other colonies. 

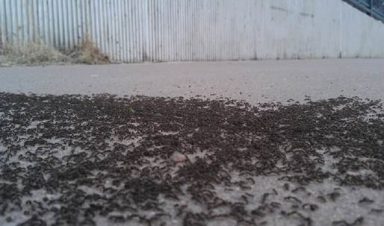
Neighboring colonies often compete for food, leading to tension. If an ant finds a non-nestmate, it organizes a large war against the nearby colony. This results in huge sidewalk battles that can include thousands of ants fighting for up to 12 hours! These ant wars often involve worker ants grabbing body parts of non-nestmate ants. 

Andrew, Jazmine, John, Mike, and Ken all work together to study the social and chemical cues that drive behaviors in animals. They were curious to learn more about the triggers that lead to colony wars. Worker ants don’t have a leader, so the scientists wanted to know how large wars are organized. The team started by reading lots of research articles and learned that there are several factors that may affect an ant’s decision to fight. These include the odor of other ants they meet, the size of the ant’s colony, and the season. The team also knew from their own experiments that if an ant meets a fellow nestmate before meeting a non-nestmate, it was more likely to fight.

A colony war involving thousands of pavement ants. Photo credit: Michael Greene.

All of this information helped the team realize that interactions with nestmates were an important part of the decisions that start ant wars with non-nestmakes. To build on this, they wanted to know whether the decision to fight was affected by ant density, which is the number of ants within an area. They thought that at higher densities the ants would be more likely to interact, leading to more fights with non-nestmates. If more wars are observed at higher ant densities, increased interactions with nestmates might be part of the story.

To answer their question, the team collected ants from different colonies in Denver, Colorado for two separate experiments. They brought them back to the lab to set up trials in a plastic tank arena.

Experiment 1: For the first set of behavioral trials, the researchers varied the number of ants in the tank, ranging from 2 to 20 ants. The size of the tank remained constant, and there were always equal numbers of nestmates and non-nestmates. This means the ratio of nestmates to non-nestmates was always 1:1, but the density varied by how many ants were included in the experiment. They performed 18 trials for each density treatment in their experiment.

At the start of every trial, ants from each colony were in separate areas so that they could interact with nestmates first. Earlier work had shown that when ants in each area interact, they touch antennae to another ant’s body. These interactions create a brain state that makes an ant more likely to fight an ant from another colony. Then the scientists removed a barrier revealing the ants from the other colony. They watched the ants for 3 minutes. During that time they recorded the number of ants that were fighting. This way they could compare how likely the ants were to fight at different densities. They predicted there would would be more fighting at higher ant densities.

Experiment 2: The scientists also wanted to measure the effect of density on the interaction rates between just nestmates. This experiment allowed the scientists to understand how the rate of interactions affected levels of neurochemicals in brains, creating the brain state that increased the likelihood that an ant would be aggressive. For these trials, they placed different densities of nestmate ants in a tank. They randomly picked an ant during each trial and counted the number of times it contacted a nestmate ant. Different groups of ants were used in each trial and each experiment. They observed the number of interactions at different densities and expected nestmate ants to have more interactions at higher densities.

Featured scientists: Andrew Bubak, Jazmine Yaeger, John Swallow, and Michael J. Greene from the University of Colorado-Denver; Kenneth Renner from the University of South Dakota. Written by: Gabrielle Welsh

Flesch–Kincaid Reading Grade Level = 9.0

Additional teacher resources related to this Data Nugget:

A news article about the research:

David vs. Goliath

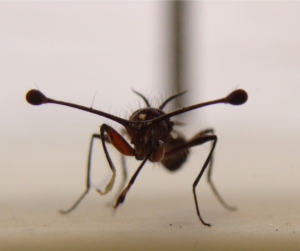
Stalk-eyed flies have their eyes at the end of long stalks on the sides of their head. These stalks are used by males when fighting for resources.

The activities are as follows:

Animals in nature often compete for limited resources, like food, territory, and mates. To compete for these resources, they use aggressive behaviors to battle with others of the same species. Aggressive behaviors are meant to overpower and defeat an opponent. The outcome of a battle depends on many different factors. In insects, one important factor is body size. Larger individuals are usually more aggressive and often win more battles. Chemicals in the brain can also influence who wins a fight. One chemical, called serotonin, can cause insects to have more aggressive behaviors. It is found in the brains of all animals, including humans.

Andrew had always been curious about what makes an animal decide to use aggressive behaviors in battle, or when to end one. He worked with researchers Nathan, Michael, Ken, and John to study the role that chemicals in the brain have on behaviors. The team was interested in how brain chemicals, like serotonin, affect aggression. They have been studying an insect species called stalk-eyed flies. These flies have eyes on the ends of long eyestalks that protrude from their heads. Male stalk-eyed flies use these eyestalks when battling each other. In a previous experiment, they found that serotonin can cause these flies to have more aggressive behaviors. They also knew that flies with shorter eyestalks usually lose fights to larger flies. 

This made them curious about whether extra serotonin could make flies with shorter eyestalks act more aggressive and help them win fights against flies with longer eyestalks. The team of researchers discussed what they knew from past research and predicted that if they gave serotonin to short eyestalk flies, it might help them win fights against long eyestalk flies. They thought this made sense because they already knew that serotonin make flies more aggressive, and more aggressive behaviors could help the shorter flies win more fights. 

The fighting arena where stalk-eyed flies battle. The camera is set up to help the scientists observe both the high intensity behaviors and retreats.

The team designed a lab study to look into this question about the importance of eyestalk length and serotonin for battles in stalk-eyed flies. First, the researchers raised male stalk-eyed flies in the lab. They made sure the flies were around the same age and were raised in a similar lab environment from the time they were born. Then, they measured the eyestalk length for each fly and divided them into two groups. One group had flies with longer eyestalks (Goliaths) and one group had flies with shorter eyestalks (Davids). They took the group of Davids with shorter eyestalks and fed half of them food with a dose of serotonin. This became the treatment group. They fed the other half of the Davids group food, but without serotonin. This was the control group. The treatment group and control group each had 20 flies.

To prepare the flies for battle, all flies were all starved for 12 hours before the competition to increase their motivation to fight over food. The researchers paired each David with a Goliath in a fighting arena. They observed the flies and recorded aggressive behaviors shown by each opponent. The researchers labeled any behavior where the fighting flies touch each other as a “high intensity behavior”. They labeled any behavior where the flies backed away as a “retreat”. Flies that retreated less than their opponent were declared the winners.

Featured scientists: Andrew Bubak, Nathan Rieger, and John Swallow from the University of Colorado, Denver; Michael Watt and Kenneth Renner from the University of South Dakota. Written by: Gabrielle Welsh.

Flesch–Kincaid Reading Grade Level = 9.3

Mowing for monarchs, Part I

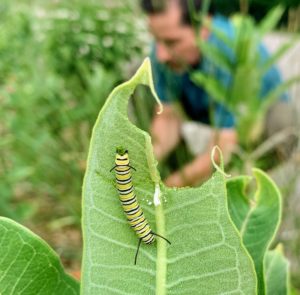
A monarch caterpillar on a milkweed leaf.

The activities are as follows:

With their orange wings outlined with black lines and white dots, monarch butterflies are one of the most recognizable insects in North America. They are known for their seasonal migration when millions of monarch butterflies migrate from the United States and Canada south to Mexico in the fall. Then, in the spring the monarch butterflies migrate back north. Monarch butterflies are pollinators, which means they get their food from the pollen and nectar of flowering plants that they visit. The milkweed plant is one of the most important flowering plants that monarch butterflies depend on.

During the spring and summer months female butterflies will lay their eggs on milkweed plants. Milkweed plays an important role in the monarch butterfly’s life cycle. It is the only plant that monarchs will lay their eggs on. Caterpillars hatch from the butterfly eggs and eat the leaves of the milkweed plant. The milkweed is the only food that monarch caterpillars will eat until they become butterflies.

A problem facing many pollinators, including monarch butterflies, is that their numbers have been going down for several years. Scientists are concerned that we will lose pollinators to extinction if we don’t find solutions to this problem. Doug and Nate are scientists at Michigan State University trying to figure out ways to increase the number of monarch butterflies. They think that they found something that might work. Doug and Nate have learned that if you cut old milkweed plants at certain times of the year, then younger milkweed plants will quickly grow in their place. These new milkweed plants are softer and more tender than the old plants. It appears that monarch butterflies prefer to lay their eggs on the younger plants. It also seems that the monarch caterpillars prefer to eat the younger plants.

Britney and Gabe are two elementary teachers interested in monarch butterfly conservation. They learned about Doug and Nate’s research and wanted to participate in their experiment. The team of four met and designed an experiment that Britney and Gabe could do in open meadows throughout their community.

Britney and Gabe chose ten locations for their experiment. In each location they set aside a milkweed patch that was left alone, which they called the control.  At the same location they set aside another milkweed patch where they mowed the milkweed plants down. After a while, milkweed plants would grow back in the mowed patches. This means they had control patches with old milkweed plants, and treatment patches with young milkweed plants. Gabe and Britney made weekly observations of all the milkweed patches at each location. They recorded the number of monarch eggs in each of the patches. By the end of the summer, they had made 1,693 observations!

Featured scientists: Doug Landis and Nate Haan from Michigan State University and Britney Christensen and Gabe Knowles from Kellogg Biological Station LTER.

Flesch–Kincaid Reading Grade Level = 8.2

Additional resources related to this Data Nugget:

  • This research is part of the ReGrow Milkweed citizen science project. To learn more, visit their website or follow them on Twitter at @ReGrowMilkweed.
  • Britney, one of the scientists in this study, wrote a blog post about her experience in the NSF LTER RET Program (National Science Foundation’s Research Experience for Teachers) working with Doug Landis.
  • Learn about how this group of scientists responded to the COVID-19 pandemic to pivot to a virtual citizen science program in this blog post.
  • A news article discussing declining monarch populations and the causes that might be contributing to this trend.

Clique wars: social conflict in daffodil cichlids

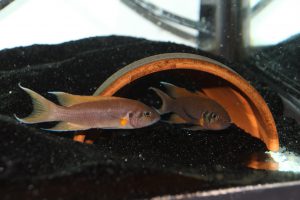
A male and female daffodil cichlid

The activities are as follows:

Have you ever thought about what it would be like to live completely alone, without contact with other people? Nowadays, humans are constantly connected by phones, texting, and social media. Our social interactions affect us in many unexpected ways. Strong social relationships can increase human lifespan, and lower the risk of cancer, cardiovascular disease, and depression. Social relationships are so important that they are actually a stronger predictor of premature death than smoking, obesity, or physical inactivity! Like humans, social interactions are important for other animals as well.

Jennifer is a behavioral ecologist who is interested in daffodil cichlids, a social species of fish from Lake Tanganyika, a Great Lake in Africa. Daffodil cichlids live in social groups of several small fish and one breeding pair. Each group defends its own rock cluster in the lake. The breeding male and female are the largest fist in the group, and the smaller fish help defend territory against predators and help care for newly hatched baby fish. About 200 social groups together make up a colony.

Social groups of daffodil cichlids in Lake Tanganyika

Behavior within a social group may be influenced by the presence of other groups in the colony. For example, neighboring groups can be a threat because they may try to take away territory or resources. After reading about previous research on social interactions in species that live in groups, Jennifer noticed there were very few studies that looked at how neighboring groups affected behavior within the group. Jennifer thought that the presence of neighboring groups may force the breeding pair to be less aggressive towards each other and work together to protect their group’s resources against the outside threat.

To test her idea, Jennifer formed breeding pairs of daffodil cichlids in an aquarium laboratory. She first observed the breeding pairs for any aggressive behaviors when they were isolated and could not see other groups. She observed each group for 30 minutes a day for 10 days. Next, Jennifer set up a clear barrier between the breeding pair and a neighboring group. The fish could see each other but not physically interact. Jennifer again watched the breeding pair and documented any aggressive behaviors to see how the presence of a neighboring group affected conflict within the pair. She again observed each group with neighbors for 30 minutes a day for 10 days.

During these behavioral tests, Jennifer counted the total number of behaviors done by the breeding pair. She measured several behaviors. Physical attacks were counted every time contact between the fish was made (biting or ramming each other). Aggressive displays were counted when fish give signals of aggression without making physical contact (raising their fins or swimming rapidly at another fish). Submissive behaviors, or actions used to prevent aggression between the breeding pair, were also counted. Finally, behaviors used to encourage social bonding were counted and are called affiliative behaviors. Jennifer predicted that the breeding pair would perform fewer physical attacks and aggressive displays when a neighboring group was present compared to when the breeding pair was alone. She also thought the breeding pair would perform more submissive and affiliative behaviors when the neighboring group was present. In this way, the presence of an outside group would impact the behaviors within a group.

Featured scientist: Jennifer Hellmann from The Ohio State University

Flesch–Kincaid Reading Grade Level = 11.3

Which would a woodlouse prefer?

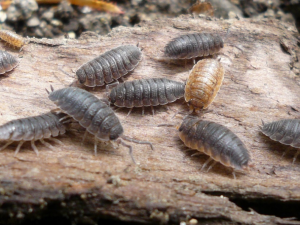
Woodlice are small crustaceans that live on land. They look like bugs, but are actually more closely related to crabs and lobsters! Photo credit Liz Henwood.

The activities are as follows:

Woodlice are small crustaceans that live on land. They look like bugs, but are actually more closely related to crabs and lobsters. To escape predators they hide in dark places. They spend most of their time underground and have very poor eyesight.

One day, when digging around in the dark dirt of her compost pile, Nora noticed that there were many, many woodlice hiding together. This made her wonder how woodlice decide where to live. Because woodlice have very simple eyesight, Nora thought that maybe they use dark and light colors to decide where to go. They might choose to move towards darker colors and away from lighter colors to prevent ending up above ground where predators can easily find them.

Nora collecting woodlice from the compost pile.

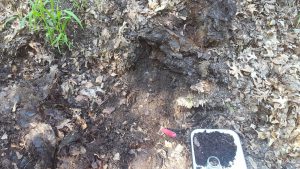
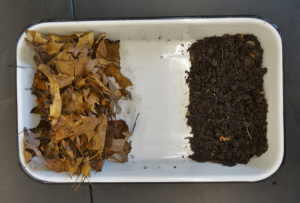
Nora, along with classmates in her ecology class at Michigan State University, decided to run an experiment to study woodlice behavior. She collected 10 woodlice from her compost pile and placed them in a jar. She brought the jar into the lab. Then she chose a set of trays to work with from what she had in the lab – white, with tall sides. The sides of the tray were tall and smooth so the woodlice were not able to climb out. On one end of the tray Nora put some dark soil, and on the other side she put lighter leaves. If her hypothesis was correct, Nora predicted that woodlice would more often choose to move towards the dark soil habitat, compared to the lighter leaves habitat.

For each trial, Nora gently picked up a single woodlouse with forceps. She then placed it in the center of the tray. All the woodlice were positioned so they started facing the top of the tray, not at either habitat type. The woodlice then chose to move towards one end of the tray or the other. When they reached one of the piles the students recorded which habitat they chose. It was then picked up with forceps. Nora and her classmates recorded its length and placed it in a new jar so it could be released back into the compost pile once the experiment was done.

The tray where the preference trials were conducted. To the right of the tray is the soil pile, and to the left is the leaf pile. The center was purposefully left empty and wiped down before each run.

After running this experiment and looking at the data, Nora realized it did not work. The small sample size of only 10 individuals was not enough to see a pattern. Also, she realized that after one woodlouse went a certain way, all the others would follow it, maybe because they were following a scent trail. She decided she had to do the experiment again, this time with more woodlice and in a way that would prevent them following each other’s scent trails.

For her second try, Nora collected 51 woodlice from a different compost pile. Just like the first experiment, Nora placed lighter leaves on one end of a white tray and dark soil on the other. All the methods were the same, except for a few important changes. To get rid of scent trails, this time Nora wiped down the middle of the tray with a clean wet paper towel between trials. She also added equal amounts of water to both habitats to control for humidity. This ensured that if woodlice did show a preference for either habitat it would be due to habitat color, not humidity. This time Nora used a stopwatch and recorded how long it took for an individual to choose one of the two habitats.

Featured scientist: Nora Straquadine from Michigan State University

 Flesch–Kincaid Reading Grade Level = 7.7

Additional teacher resource related to this Data Nugget:

  • PowerPoint slideshow of images of woodlice and Nora’s experiment.
  • A great video to show before the Data Nugget to engage students with the activity – gives background on woodlice and describes the role that water plays for these crustaceans that live on land:

  • A video of woodlice on a fallen tree. This video has no audio, but can be useful for students to observe woodlice behavior:


About Nora: Nora is currently an undergraduate getting her B.S. in Zoology with a concentration in Zoo and Aquarium as well as a minor in Marine Ecosystem Management from Michigan State University. Although aquatic life is her main interest, she think it’s important to appreciate other animal groups and take a break to play and explore the nature around you. That curiosity was how she was able to volunteer in labs on campus from entomology to genetics, and how she came to spend a summer at the Kellogg Biological Station in Michigan.

SaveSave

SaveSave

SaveSave

SaveSave

SaveSave

SaveSave

SaveSave

To bee or not to bee aggressive

A honey bee (Apis mellifera) collecting nectar to bring back to the hive. Photo by Andreas Trepte.

The activities are as follows:

Honey bees are highly social creatures that live in large colonies of about 40,000 individuals and one queen. Every member of the hive works together to benefit the colony. Some of the tasks adult bees perform include making honey, nursing young, foraging for food, building honey comb structures, and defending the colony.

From spring through fall, the main task is turning nectar from plants to honey. The honey is stored and eaten over the winter, so it is vital for the colony’s survival. Because honey is an energy-rich food source, hives are targets for break-ins from animals, like bears, skunks, and humans that want to steal the honey. Bees even have to fight off bees from other colonies that try to steal honey. Research shows that colonies adjust their defenses to match threats found in their environment. Hives in high risk areas respond by becoming more aggressive, and hives that do not face a lot of threats are able to lower their aggression. This flexibility makes sure they do not waste energy on unnecessary behaviors.

Clare is a scientist studying the behavior of social animals. There is an interesting pattern seen in other social animals, including humans, that Clare wanted to test in honey bees. In these species, the social environment experienced when an individual is young can have lasting effects on their behavior later in life. This may be because this is the time that the brain is developing. She thought this would likely be the case with honey bees for two reasons. First, bees can use social information to help coordinate group defense. Second, young bees rely completely on adult bees to bring them food and incubate them, so there are a lot of social interactions when they are young. After reading the literature and speaking with other honey bee experts, Clare found out that no one had ever tested this before!

Honey bee larva (top) and an emerging adult (bottom).

Clare chose to look at aggression level as a behavioral trait of individual bees within a colony. She predicted that young honey bees raised in an aggressive colony would be more aggressive as adults, compared to honey bees raised in a less aggressive colony. To test her predictions, Clare used 500 honey bee eggs from 18 different queens. To get these 500 eggs she collected three times in the summer, for two years. Each time she collected, she went to two different locations. Collecting from so many different queens helped Clare make sure her study included eggs with a large genetic diversity.

To test her questions, she used these eggs to set up an experiment. Eggs from each of the 18 queens were split into two groups. Each group was put into one of two types of foster colonies – high aggression and low aggression. Clare determined whether each foster colony was considered high or low aggression using a test. Because half of each queen’s eggs went into a low aggression foster colony, and the other half in a high aggression foster colony, this represents the experimental treatment.

Clare left the foster colonies alone and waited for the bees to develop in the hives. Eggs hatch and turn into larvae. These larvae mature into pupae and then into adults. Just before the young bees emerged from their pupal stage to adulthood, Clare removed them from the foster colonies and brought them into the lab. This way the bees would spend their whole adult life in the lab together, sharing a common environment.

After a week in the lab, Clare tested the aggressiveness of each individual bee. Her test measured aggressive behaviors used by a bee to defend against a rival bee from another colony. Clare observed and counted a range of behaviors including attempts to sting the rival and bites to the rival’s wings and legs. She used these values to calculate an offspring aggression score for each bee.

To select high and low aggression foster colonies to be used in her experiment, Clare first had to identify which colonies were aggressive and which were not. To do this, she put a small amount of a chemical that makes bees aggressive on a piece of paper at the front of the colony entrance. The top two photos show two colony entrances before the chemical. The bottom two photos show the same two colonies 60 seconds after the chemical. The more bees that come out, the more aggressive the colony. You can see from these images that the colony on the right is much more aggressive than the colony on the left. Clare counted the number of bees and used this value to calculate the colony’s aggression score.

Featured scientist: Clare C. Rittschof from the University of Kentucky

Flesch–Kincaid Reading Grade Level = 9.2

SaveSave

SaveSave

SaveSave