Trees and the city

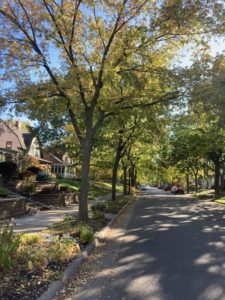
A neighborhood with many tree species and a lot of tree cover.

The activities are as follows:

We often imagine nature as being a place outside of cities. But within our cities, we are surrounded by nature – in fact, most human interactions with nature happen within urban areas. Picturing a tree, we might imagine it in a remote forest, yet many trees are planted by residents and local governments within cities. Trees provide important benefits, such as beauty and shade. The number and types of tree species that are planted in a neighborhood can increase the benefits received from trees in urban areas.

When Adrienne first moved to the Twin Cities in Minnesota, she started exploring Minneapolis and St. Paul by bike. Biking is done at a slow enough pace that she can travel long distances but still make observations about neighborhoods in these cities. As an ecologist, she naturally found herself looking for patterns in trees. For example, she noticed some older neighborhoods in St. Paul have a lot of large trees that provide plenty of shade and tree cover. In other neighborhoods, Adrienne saw fewer types of trees and noticed that she spent less time shaded by branches and leaves.

Adrienne biking around Minneapolis-St. Paul.

Adrienne started conversations with her colleagues about their observations of differences in urban landscapes. They discussed the ways in which laws, policies, and practices (“the way things are done”) give advantages to certain groups of people over others. These advantages are woven into our cultural systems.

Adrienne and her fellow researchers expected that neighborhoods with wealthier and more white residents would have benefited from a long history of greater investment.

Therefore, these neighborhoods were expected to have greater tree cover from the large old trees that have been growing there for many years. They also expected these neighborhoods would have more types of trees. In contrast, the researchers expected that less wealthy neighborhoods and those with a greater percentage of Black, Indigenous, and other People of Color (BIPOC) would have less tree cover and fewer types of trees because of chronic lower investment in these neighborhoods.

To research these ideas, Adrienne and her colleagues combined three different sources of publicly available data:

  • U.S. Census data, used to estimate % BIPOC and average median household income per ‘Block Group’ (similar to a neighborhood).
  • Satellite images, which are often used to estimate % tree cover, measure the percent of land area covered by the tree canopy. Adrienne looked at tree cover in the Block Group areas used in the Census.
  • City data that include the location and species for each tree planted along public streets to calculate tree species richness in each Block Group. Tree species richness is the number of different tree species in an area and is a measure of tree biodiversity used by many ecologists.

Featured scientists: Adrienne Keller (she/her) from the University of Minnesota

The data in this activity are from the MSP Long-term Ecological Research Site. The focus of the research at this site is centered on ecological interactions in urban environments. You can learn more here.

Flesch–Kincaid Reading Grade Level = 9.4

Additional teacher resources related to this Data Nugget include:

  • You can have students read more about environmental justice research from the MSP LTER in this peer-reviewed article (email us at datanuggetsk16@gmail.com if you need a downloadable version):
    • Rebecca H. Walker, Hannah Ramer, Kate D. Derickson & Bonnie L. Keeler (2023) Making the City of Lakes: Whiteness, Nature, and Urban Development in Minneapolis. Annals of the American Association of Geographers, DOI: 10.1080/24694452.2022.2155606
  • This short video features Adrienne as she describes the motivation and process behind her research study.

Mowing for Monarchs – Extension Activities

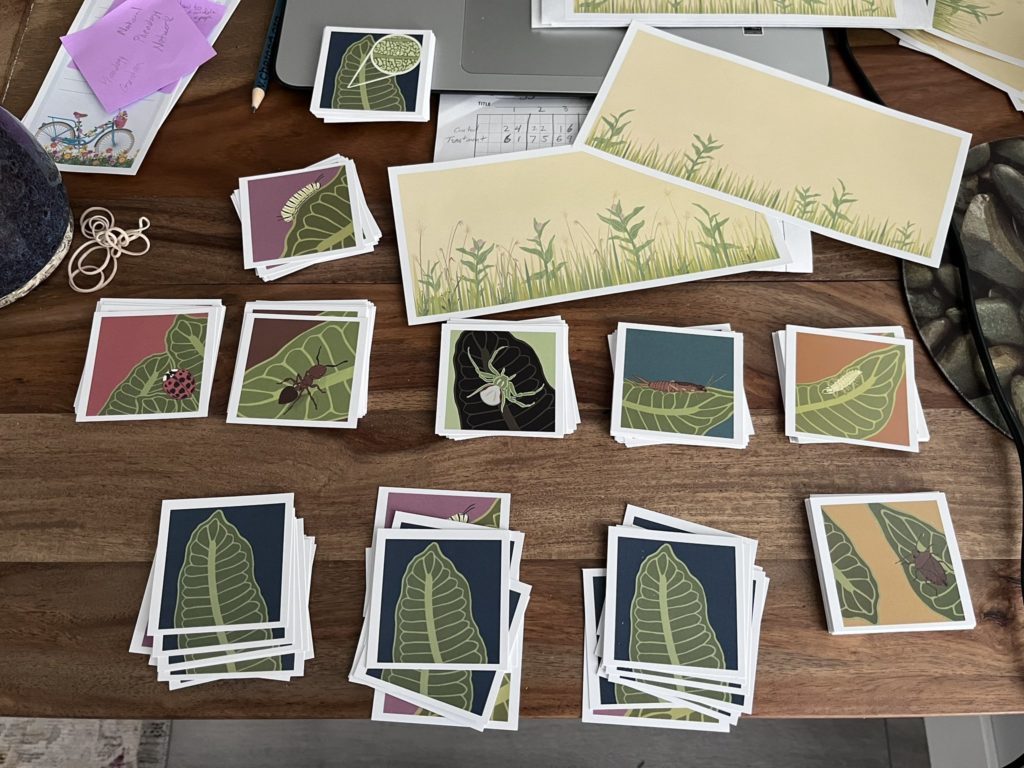
Gabe Knowles has developed and piloted several data activities to accompany these Data Nuggets activities. For the first activity, Gabe developed an extension to bring his data into elementary classrooms. Using beautiful art created by Corinn Rutkoski, the following are materials to print and use the activity in your classroom:

This activity was first piloted at Michigan Science Teachers Association Annual Meeting in 2023.

Benthic buddies

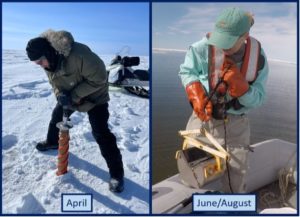
Danny and Kaylie sampling benthic animals

The activities are as follows:

Lagoons are areas along the coast where a shallow pocket of sea water is separated from the ocean most of the time. During some events, like high tides, the ocean water meets back up with the lagoon. Coastal lagoons are found all over the world – even in the most northern region of Alaska, called the High Arctic!

These High Arctic lagoons go through many extreme changes each season. In April, ice completely covers the surface. The mud at the bottom of the shorelines is frozen solid. In June, the ice begins to break up and the muddy bottoms of the lagoons begin to thaw. The melting ice adds freshwater to the lagoons and lowers the salt levels. In August, lagoon temperatures continue to rise until there is only open water and soft mushy sediment.

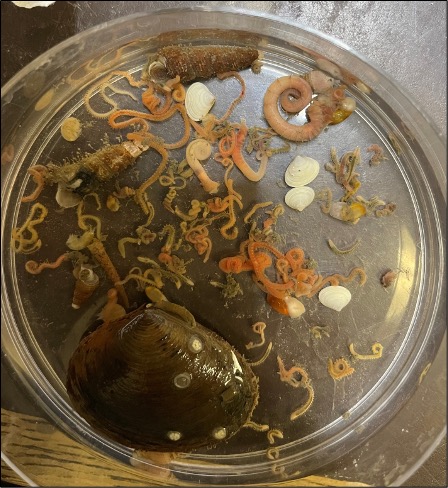
You would think these harsh conditions would make High Arctic lagoons not suitable to live in. However, these lagoons support a surprisingly wide range of marine organisms! Marine worms, snails, and clams live in the muddy sediment of these lagoons. This habitat is also called the bottom, or benthic, environment. Having a rich variety of benthic animals in these habitats supports fish, which migrate along the shoreline and eat these animals once the ice has left. And people who live in the Arctic depend on fishing for their food.

Ken, Danny, and Kaylie are a team of scientists from Texas interested in learning more about how the extreme seasons of the High Arctic affect the marine life that lives there. They want to know whether the total number of benthic species changes with the seasons. Or does the benthic community of worms, snails, and clams stay constant throughout the year regardless of ice, freezing temperatures, and large changes in salt levels? The science team thought that the extreme winter conditions in the Arctic lagoons cause a die-off each year, so there would be fewer species found at that time. Once the ice melts each year, benthic animals likely migrate back into the lagoons from deeper waters and the number of species would increase again.

Ken, Danny, and Kaylie had many discussions about how they could answer their questions. They decided the best approach would be to travel to Alaska to take samples of the benthic animals. To capture the changes in lagoon living conditions, they would need to collect samples during the three distinct seasons.

Benthic organisms from a sample

The science team chose to sample Elson Lagoon because it is in the village of Utqiaġvik, Alaska and much easier to reach than other Arctic lagoons. They visited three times. First, in April, during the ice-covered time, again in June when the ice was breaking up, and a final time in summer when the water was warmer. In April, they used a hollow ice drill to collect a core sample of the frozen sediment beneath the ice. In June and August, they deployed a Ponar instrument into the water, which snaps shut when it reaches the lagoon bottom to grab a sample. Each time they visited the lagoon, they collected two sediment samples.

Back in the lab, they rinsed the samples with seawater to remove the sediment and reveal the benthic animals. The team then sorted and identified the species present. They recorded the total number of different species, or species richness, found in each sample.

Featured scientists: Ken Dunton, Daniel Fraser, and Kaylie Plumb from the University of Texas Marine Science Institute

Written by: Maria McDonel from Flour Bluff and Corpus Christi Schools

Flesch–Kincaid Reading Grade Level = 8.9

Additional teacher resources related to this Data Nugget include:

Mowing for monarchs, Part II

In Part I you explored data that showed monarchs prefer to lay their eggs on young milkweeds that have been mowed, compared to older milkweed plants. But, is milkweed age the only factor that was changed when Britney and Gabe mowed patches of milkweeds? You will now examine whether mowing also affected the presence of monarch predators.

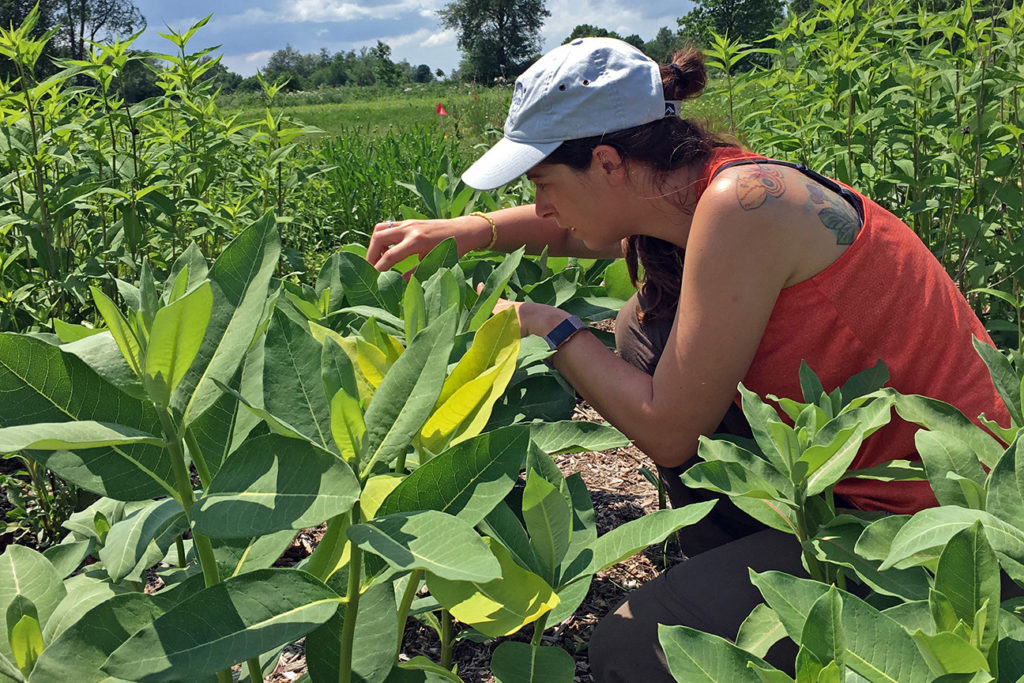
A scientist measuring a milkweed plant.
A scientist, Lizz D’Auria, counting the number of monarch predators on milkweed plants in the experiment.

The activities are as follows:

The bright orange color of monarch butterflies signals to their enemies that they are poisonous. This is a warning that they do not make a tasty meal. Predators, like birds and spiders, that try to eat monarch butterflies usually become sick. Many people think that monarch butterflies have no enemies because they are poisonous. But, in fact they do have a lot of predators, especially when they are young.

Monarchs become poisonous from the food they eat. Adult monarchs lay their eggs on milkweed plants, which have poisonous sap. When the eggs hatch, the caterpillars chomp on the leaves. Young caterpillars are less poisonous because they haven’t eaten much milkweed yet. And monarch eggs are not poisonous at all to predators.

Britney and Gabe met with their friends, Doug and Nate, who are scientists. Doug and Nate thought that Britney and Gabe’s experiment might have changed more than just the age of the milkweed plants in the patches they mowed. By mowing their field sites they were also cutting down the plants in the rest of the community. These plants provide habitat for predators, so mowing all of the plants would affect the predators as well. These ideas led to another potential explanation for the results Britney and Gabe saw in their data. Because all plants were cut in the mowed patches, there was nowhere for monarch predators to hang out. Britney and Gabe came up with an alternative hypothesis that perhaps monarch butterflies were choosing to lay their eggs on young milkweed plants because there were fewer predators nearby. To test this new idea, Britney and Gabe went back to their experimental site and started collecting data on the presence of predators in addition to egg number. Remember that in each location, they had a control patch, which was left alone, and a treatment patch that they mowed. The control patches had older milkweed plants and a full set of plants in the community. The mowed patches had young milkweed plants with short, chopped plants nearby. For the whole summer, they went out weekly to all of the patches. They counted the number of predators found on the milkweed plants so they could compare the mowed and unmowed patches.

Predators of monarch butterflies.
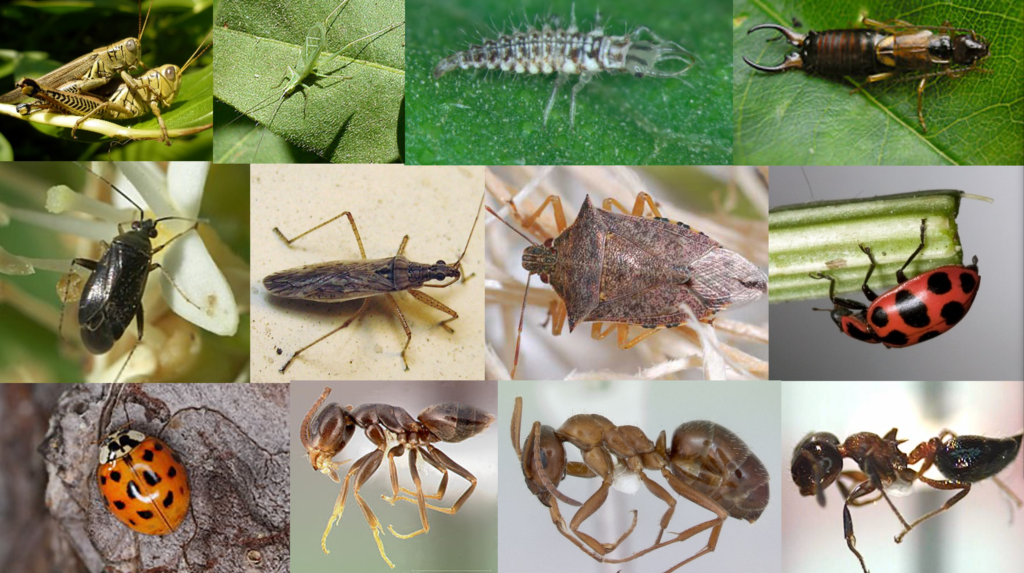
There are many different species that eat monarch butterfly eggs and young caterpillars. These are just a few of the species that Gabe and Britney observed during their experiment.

Featured scientists: Doug Landis and Nate Haan from Michigan State University and Britney Christensen and Gabe Knowles from Kellogg Biological Station LTER.

Flesch–Kincaid Reading Grade Level = 8.2

Additional resources related to this Data Nugget:

  • A news article discussing declining monarch populations and the causes that might be contributing to this trend.

Mowing for monarchs, Part I

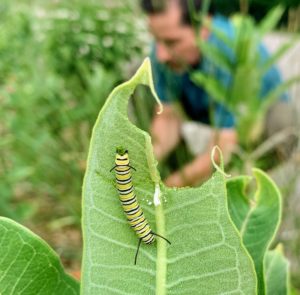
A monarch caterpillar on a milkweed leaf.

The activities are as follows:

With their orange wings outlined with black lines and white dots, monarch butterflies are one of the most recognizable insects in North America. They are known for their seasonal migration when millions of monarch butterflies migrate from the United States and Canada south to Mexico in the fall. Then, in the spring the monarch butterflies migrate back north. Monarch butterflies are pollinators, which means they get their food from the pollen and nectar of flowering plants that they visit. The milkweed plant is one of the most important flowering plants that monarch butterflies depend on.

During the spring and summer months female butterflies will lay their eggs on milkweed plants. Milkweed plays an important role in the monarch butterfly’s life cycle. It is the only plant that monarchs will lay their eggs on. Caterpillars hatch from the butterfly eggs and eat the leaves of the milkweed plant. The milkweed is the only food that monarch caterpillars will eat until they become butterflies.

A problem facing many pollinators, including monarch butterflies, is that their numbers have been going down for several years. Scientists are concerned that we will lose pollinators to extinction if we don’t find solutions to this problem. Doug and Nate are scientists at Michigan State University trying to figure out ways to increase the number of monarch butterflies. They think that they found something that might work. Doug and Nate have learned that if you cut old milkweed plants at certain times of the year, then younger milkweed plants will quickly grow in their place. These new milkweed plants are softer and more tender than the old plants. It appears that monarch butterflies prefer to lay their eggs on the younger plants. It also seems that the monarch caterpillars prefer to eat the younger plants.

Britney and Gabe are two elementary teachers interested in monarch butterfly conservation. They learned about Doug and Nate’s research and wanted to participate in their experiment. The team of four met and designed an experiment that Britney and Gabe could do in open meadows throughout their community.

Britney and Gabe chose ten locations for their experiment. In each location they set aside a milkweed patch that was left alone, which they called the control.  At the same location they set aside another milkweed patch where they mowed the milkweed plants down. After a while, milkweed plants would grow back in the mowed patches. This means they had control patches with old milkweed plants, and treatment patches with young milkweed plants. Gabe and Britney made weekly observations of all the milkweed patches at each location. They recorded the number of monarch eggs in each of the patches. By the end of the summer, they had made 1,693 observations!

Featured scientists: Doug Landis and Nate Haan from Michigan State University and Britney Christensen and Gabe Knowles from Kellogg Biological Station LTER.

Flesch–Kincaid Reading Grade Level = 8.2

Additional resources related to this Data Nugget:

  • This research is part of the ReGrow Milkweed citizen science project. To learn more, visit their website or follow them on Twitter at @ReGrowMilkweed.
  • Britney, one of the scientists in this study, wrote a blog post about her experience in the NSF LTER RET Program (National Science Foundation’s Research Experience for Teachers) working with Doug Landis.
  • Learn about how this group of scientists responded to the COVID-19 pandemic to pivot to a virtual citizen science program in this blog post.
  • A news article discussing declining monarch populations and the causes that might be contributing to this trend.

Round goby, skinny goby

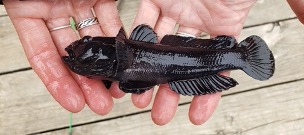
An invasive round goby from the Kalamazoo River, Michigan.

The activities are as follows:

Animals often have adaptations, or traits that help them live in certain environments. For fish, that can mean having a body shape that allows them to feed on available prey, better hide from predators, or swim more effortlessly. When these traits vary within the same species from one location to another, they are called local adaptations. Such adaptations were once thought to only evolve slowly over hundreds or thousands of generations. However, new evidence shows that evolution can result in meaningful adaptations much more quickly than originally thought, sometimes in just a few generations!

Invasive species are those that have been moved by humans to areas where they do not usually exist and cause disruptions to native ecosystems. Because they have been moved to new places where they did not evolve, invasive species often have traits that aren’t matched to their new habitats. When mismatches occur, species may be able to adapt in just a few generations in their new locations.

Several invasive species have been problematic in the Great Lakes of North America. The round goby is a small invasive fish species that arrived in the Great Lakes around 1990. It is a bottom-dwelling species that is able to quickly reproduce and crowd out native fish species. Both avid anglers, Jared and Bailey observed the increasing numbers of round gobies during their time spent outdoors. They noticed that sometimes round gobies would even outnumber all other native fish in an area.

Originally appearing just in the Great Lakes themselves, the species is increasingly being found in rivers throughout the region. Jared and Bailey were surprised this species did so well in both river and large lake habitats since they are very different environments for fish to live. For example, water is constantly flowing downstream in rivers, whereas lakes can be still or have waves near the shore. Also, these two habitats have different predator and prey species living in them and differ in water chemistry characteristics. With the spread of more and more round gobies into rivers, Jared and Bailey set out to learn how this species is successful in both habitats. They thought that round gobies found in rivers would have adaptations to help navigate fast flowing waters. Fish with narrower body shapes can move more easily in flowing waters, giving narrow-bodied individuals an advantage over those with bulkier bodies. Over time, those individuals with such an advantage would be more likely to survive and reproduce in the rivers, eventually shifting the entire river-dwelling population to a narrow body shape. They predicted that round gobies from rivers would have shorter body depths and narrower caudal peduncles, which is the area between the fish’s body and tail. To test their idea, Jared and Bailey captured and measured hundreds of round gobies from both Great Lakes and inland river habitats.

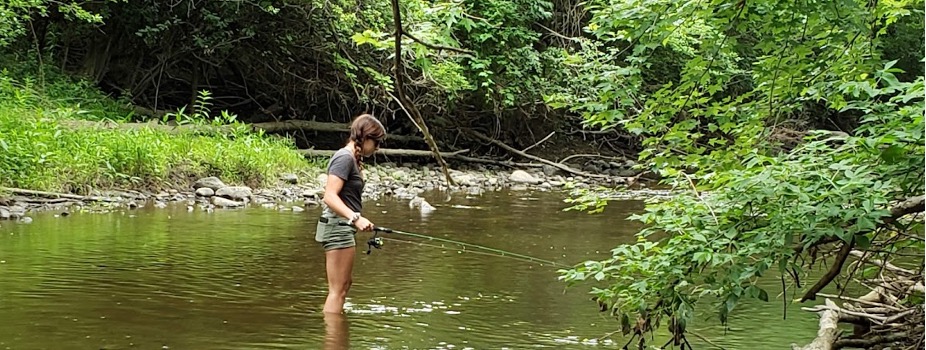
Michigan State University researcher Bailey Lorencen fishing for gobies in a Michigan river.

Featured scientists: Jared Homola (he/him) and Bailey Lorencen (she/her) from Michigan State University

Flesch–Kincaid Reading Grade Level = 11.2

Trees and bushes, home sweet home for warblers

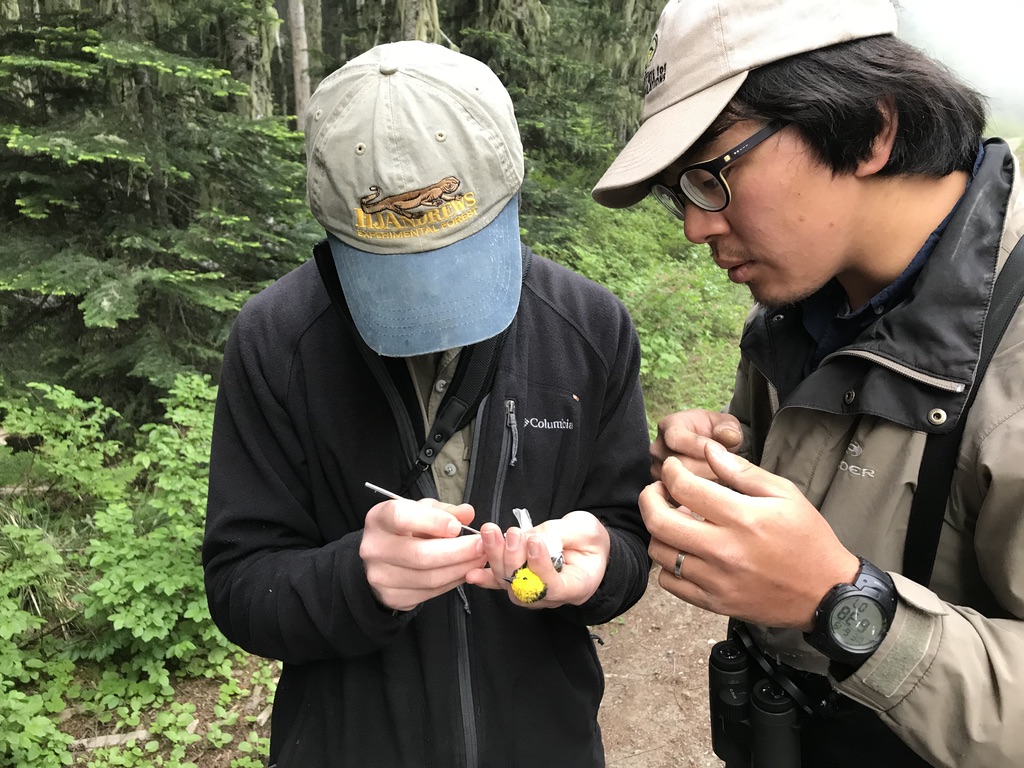
Matt, Sarah, and Hankyu – a team of scientists at Andrews Forest, measuring bird populations.

The activities are as follows:

The birds at a beach are very different from those in the forest. This is because each bird species has their own set of needs that allows them to thrive where they live. Habitats must have the right collection of food to eat, places to shelter and raise young, safety from predators, and the right environmental conditions like temperature and moisture. 

The vast coniferous forests of the Pacific Northwest provide rich and diverse habitat types for birds. These forests are also a large source of timber, meaning they are economically valuable for people. Disturbances from logging and natural events result in a forest that has many different habitat types for birds to choose from. In general, areas of forest that have been harvested more recently will have more understory, such as shrubs and short trees. Old-growth forests usually have higher plant diversity and larger trees. They are also more likely to have downed trees or standing dead trees, which are important for some bird species. Other disturbances like wildfire, wind, large snow events, and forest disease also have large impacts on bird habitat.

At the Andrews Forest Long-Term Ecological Research site in the Cascade Mountains of Oregon, scientists have spent decades studying how the plants, animals, land use, and climate are all connected. In the past, Andrews Forest had experiments manipulating timber harvesting and forest re-growth. This land use history has large impacts on the habitats found in an area. Many teams of scientists work in this forest, each with their own area of research. Piece by piece, like assembling a puzzle, they combine their data to try to understand the whole ecosystem. 

Collecting data on a warbler.

Matt, Sarah, and Hankyu have been collecting long-term data on the number, type, and location of birds in Andrews Forest since 2009. Early each morning, starting in May and continuing until late June, teams of trained scientists hike along transects that go through different forest types. Transects are parallel lines along which data are collected. At specific points along the transect, the team would stop and listen for bird songs and calls for 10 minutes. There are 184 survey locations, and they are visited multiple times each year.

At each sampling point, Matt, Sarah, and Hankyu carefully recorded a count for each bird species that they hear within 100 meters. They then averaged these data for each location along the transect to get an average number for the year. The scientists were also interested in the habitats along the transect, which includes the amount of understory plants and tall trees, two forest characteristics that are very important to birds. They measured the percent cover of understory vegetation, which shows how many bushes and small plants were around. They also measured the size of trees in the area, called basal area. 

Using these data, the research team is looking for patterns that will help them identify which habitat conditions are best for different bird species. With a better understanding of where bird species are successful, they can predict how changes in the forest could affect the number and types of birds living in Andrews Forest and nearby.  

Wilson’s Warblers and Hermit Warblers are two of the many songbirds that these scientists have recorded at Andrews Forests. Wilson’s Warblers are small songbirds that make their nests in the understory of the forests. Therefore, the team predicted that they would see more of Wilson’s Warblers in forest areas with more understory than in forest areas with less understory. Hermit Warblers, on the other hand, build nests in dense foliage of tall coniferous trees and search for spiders and insects in those coniferous trees. The team predicted that the Hermit Warblers would be observed more often in forest plots where there are larger trees.  

Featured scientists: Hankyu Kim, Matt Betts, and Sarah Frey from Oregon State University. Written with Eric Beck from Realms Middle School and Kari O’Connell from Oregon State University.

Flesch–Kincaid Reading Grade Level = 10.5

Additional teacher resource related to this Data Nugget:

Fertilizer and fire change microbes in prairie soil

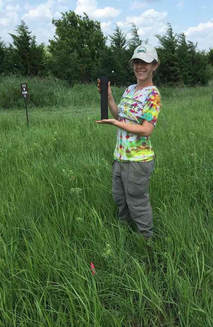
Christine collecting samples from the experimental plots to measure root growth.

The activities are as follows:

Stepping out into a prairie feels like looking at a sea of grass, with the horizon evoking a sense of eternity. Grasses and other prairie plants provide important benefits, such as creating habitat for many unique plants, mammals, insects, and microbes. They also help keep our water clean by using nutrients from the soil to grow. When plants take up these nutrients, they prevent them from going into streams. High levels of plant growth also keeps carbon bound up in the bodies of plants instead of in the atmosphere.  

Prairies grow where three environmental conditions come together – a variable climate, frequent fires, and large herbivores roaming the landscape. However, prairies are experiencing many changes. For example, people now work to prevent fires, which allows forest species to establish and eventually take over the prairie. In addition, a lot of land previously covered in prairie is now being used for agriculture. When land is used for agriculture, farmers add nutrients through fertilizer. With all these changes, prairie ecosystems have been declining globally. Scientists are concerned that as they disappear so will the benefits they provide. 

Lydia and Christine are two scientists contributing to the effort to learn more about how to preserve prairies. They both became interested in studying soil because of their appreciation for prairies at a young age. For Lydia, she lived in an area that was covered by trees and farmland, but knew at one time it used to be prairie. This made her want to learn more about prairie environments and how places like where she grew up have changed through history. For Christine, she grew up surrounded by prairies where she developed a passion and curiosity for the natural world. Especially for the organisms living in the soil that you cannot see, called microbes. 

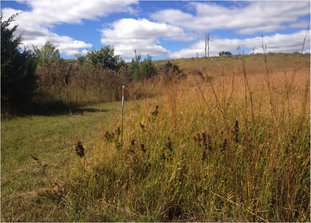
These are two different experimental plots within the large field experiment at Konza Prairie Biological Station. The one with lots of trees is an unburned plot, the one with lots of grass is a burned plot.

Lydia and Christine read about how grassland scientists have been doing research to learn more about what happens when fire is stopped and excess nutrients are added. These changes reduce biodiversity and affect which species of plants can grow in the prairie. However, Lydia and Christine noticed that the research had been mostly focused on what happens aboveground.  Lydia and Christine had a hunch that the aboveground communities were not the only things changing. They thought that belowground components would be changed by fire and fertilizer too. They turned their focus to microbes in the soil, because they also use nutrients. In addition, they thought these microorganism would be affected by the changes in aboveground plant biodiversity. 

To see if this was true, they used data that they and other scientists collected at Konza Prairie Biological Station from a large field experiment. The experiment was set up in 1986 and the treatments were applied at the field site every year until 2017! Lydia and Christine focused on the fertilizer (nitrogen) addition and prescribed burning treatments to answer their questions. The nitrogen treatment had eight plots where nitrogen had been added and eight with no nitrogen as a control. Similarly, the prescribed burn treatment was applied to eight plots, while eight plots had no burning as a control. These two treatments were also crossed with each other, meaning that some plots were burned and nitrogen was added.

Lydia and Christine expected the types of microbes in the soil to change in response to the nitrogen and burning treatments because of the different aboveground plant communities and difference in soil nutrients. Soil microbial communities can change in multiple ways. First, the number of unique species can increase or decrease, measured as richness. The other way is how many individuals of each species there are in the community, measured as evenness. Taken together, richness and evenness give a measure of diversity, which can be summarized using the Shannon-Wiener index. The value will get bigger if either richness or evenness increases because it incorporates both. For example, a community with five species that has equal abundance of each will have a larger Shannon-Wiener index than a community with five species where one species has a lot more individuals than the other four.  

Featured Scientists: Lydia Zeglin and Christine Carson from the Konza Prairie Biological Station. Written By: Jaide Allenbrand

Flesch–Kincaid Reading Grade Level = 10.4

Candid camera: Capturing the secret lives of carnivores

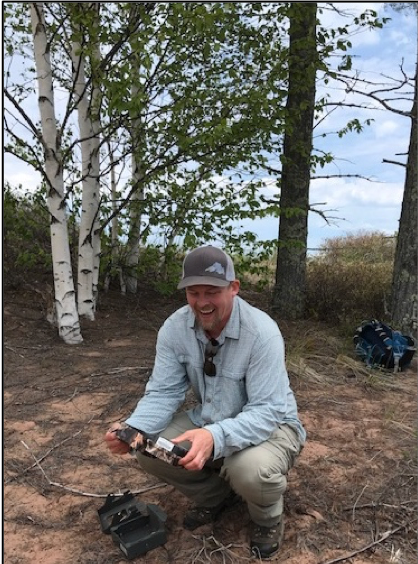
Erik demonstrating how to place a camera trap on a tree on Stockton Island.

The activities are as follows:

Carnivores, animals that eat meat, captivate people’s interest for many reasons – they are charismatic, stealthy, and can be dangerous. Not only are they fascinating, they’re also ecologically important. Carnivores help keep prey populations in balance. They often target old, sick, or weak individuals. This results in more resources for healthier prey. Carnivores also impact prey’s behavior and population sizes, which can have further effects down the food web. For example, if there are too many herbivores, such as deer, the plants in an ecosystem may be eaten to a point where they can’t survive. In this way, carnivores help the plant community by either reducing the number of herbivores in an ecosystem, or changing how or where prey forage for food. 

Despite their importance and our interest in carnivores, they are very hard to monitor. Not only do they have naturally low population sizes because they are at the top of the food chain, they also have a natural ability to hide and blend into their environment. Erik is a wildlife biologist who is interested in taking on this challenge. He wants to learn more about carnivores and what factors affect where they live. Learning more about where carnivores are found can help scientists with conservation efforts.

Erik lives on the southern shore of Lake Superior, the largest lake (by area) in the world. This area is home to the Apostle Islands National Lakeshore – including 21 islands and a 12-mile stretch of the mainland in northern Wisconsin. The Apostle Islands vary in many ways – size, distance from the mainland, highest elevation, historical and current human use, plant communities, and even small differences in climate. The islands are so remote that scientists really didn’t know which carnivores lived on the islands. There is evidence from historical reports that red fox and coyotes lived on some of the islands. More recently, black bears have been observed by visitors as they are hiking or camping. Erik wanted to know which species of carnivores are on each island. As he began to explore methods to document wildlife on the islands, Erik and his collaborators were shocked to discover that American martens, Wisconsin’s only state endangered species, live on some of the islands.

Erik thought a promising step in learning more about what drives carnivores to live on different islands in the archipelago would be to apply what has been learned from islands in the ocean. He referred to a fundamental theory in ecology called the theory of island biogeography. This theory predicts that island size and its distance to the mainland affects the biodiversity, or number of species, found on that island. Specifically, larger islands will have higher carnivore biodiversity because there are more resources and space to support more species than smaller areas. In contrast, islands farther away from the mainland will have lower carnivore biodiversity because more isolated islands are harder for wildlife to reach. 

Erik wanted to test whether the theory of island biogeography also applied to the Apostle Islands. Just like the classic research on island biogeography, some islands are closer to the mainland and they range in size. To inventory where each carnivore is found, Erik and his collaborators and students set up 164 wildlife cameras on 19 of the islands. They made their way out to the remote islands by boat and then bushwhacked their way to the sites, which are not along trails. Often this means they have to push through thick brush and climb over fallen trees, but it’s important to put the cameras in all habitat types, not just those that are enjoyable to walk through. When the research team arrived at a site, they mounted a camera on a tree at waist height. Whenever an animal came into the frame of a camera, a photo was taken and stored on a memory card. The cameras were left on the islands year-round from 2014-2019. Every 6 months Erik and his collaborators would traverse through the thick woods to swap out memory cards and batteries. During this time, they noticed that four of the cameras had not worked properly, so they used the pictures from 160 of the cameras. 

Back at the college, the research team spent countless hours identifying which animals triggered the cameras. The cameras had taken over 200,000 photos over three years including 7,000 wildlife visits. Of these visits, 1,970 were from carnivores! They found 10 different kinds of carnivores, including: American marten, black bear, bobcat, coyote, fisher, gray fox, gray wolf, raccoon, red fox and weasels. After the pictures were processed, Erik used this information to map out which islands the animals were found. For this study, he used species richness, or the number of different species observed on each island, to answer his question. 

Map of the Apostle Islands with the richness, or number of different carnivore species, detected on each island.

Featured scientists: Erik Olson from Northland College, Tim Van Deelen, and Julie Van Stappen from the National Park Service. Support for this lesson was provided by the National Park Service with funding from the Great Lakes Restoration Initiative.

Flesch–Kincaid Reading Grade Level = 11.2

Additional teacher resources related to this Data Nugget:

The study and results described in this Data Nugget have been published:

  • Allen, M.L., Farmer, M.J., Clare, J.J., Olson, E.R., Van Stappen, J., Van Deelen, T.R. 2018. Is there anybody out there? Occupancy of the carnivore guild in a temperate archipelago. Community Ecology 19(3): 272-280.

Citizen science site where students can view and identify animals found in pictures from cameras placed around Wisconsin.

There have been several news articles about this research:

Tree-killing beetles

A Colorado forest impacted by a mountain pine beetle outbreak. Notice the dead trees mixed with live trees. Forests like this with dead trees from mountain pine beetle outbreaks cover millions of acres across western North America.

The activities are as follows:

A beetle the size of a grain of rice seems insignificant compared to a vast forest. However, during outbreaks the number of mountain pine beetles can skyrocket, leading to the death of many trees. The beetles bore their way through tree bark and introduce blue stain fungi. The blue stain fungi kills the tree by blocking water movement. Recent outbreaks of mountain pine beetles killed millions of acres of lodgepole pine trees across western North America. Widespread tree death caused by mountain pine beetles can impact human safety, wildfires, nearby streamflow, and habitat for wildlife.

Mountain pine beetles are native to western North America and outbreak cycles are a natural process in these forests. However, the climate and forest conditions have been more favorable for mountain pine beetles during recent outbreaks than in the past. These conditions caused more severe outbreaks than those seen before.

Logs from mountain pine beetle killed lodgepole pine trees. The blue stain fungi is visible around the edge of each log. Mountain pine beetles introduce this fungus to the tree.

When Tony moved to Colorado, he drove through the mountains eager to see beautiful forests. The forest he saw was not the green forest he expected. Many of the trees were dead! Upon closer examination he realized that some forests had fewer dead trees than others. This caused him to wonder why certain areas were greatly impacted by the mountain pine beetles while others had fewer dead trees. Tony later got a job as a field technician for Colorado State University. During this job he measured trees in mountain forests. He carefully observed the forest and looked for patterns of where trees seemed to be dead and where they were alive.

Tony thought that the size of the trees in the forest might be related to whether they were attacked and killed by beetles. A larger tree might be easier for a beetle to find and might be a better source of food.To test this idea, Tony and a team of scientists visited many forests in northern Colorado. At each site they recorded the diameter of each tree’s trunk, which is a measure of the size of the tree. They also recorded the tree species and whether it was alive or dead. They then used these values to calculate the average tree size and the percent of trees killed for each site.

Featured scientist: Tony Vorster from Colorado State University

Flesch–Kincaid Reading Grade Level = 8.3

There is one scientific paper associated with the data in this Data Nugget. The citation and PDF of the paper is below:

Students can complete this Data Nugget along with Tony! In this video, Tony provides more background on how he became interested in doing research, how he collects his data, and details on how to construct graphs.