- Teacher Guide
- Student activity, Graph Type A, Level 3
- Student activity, Graph Type B, Level 3
- Student activity, Graph Type C, Level 3
- PowerPoint of images
- Grading Rubric
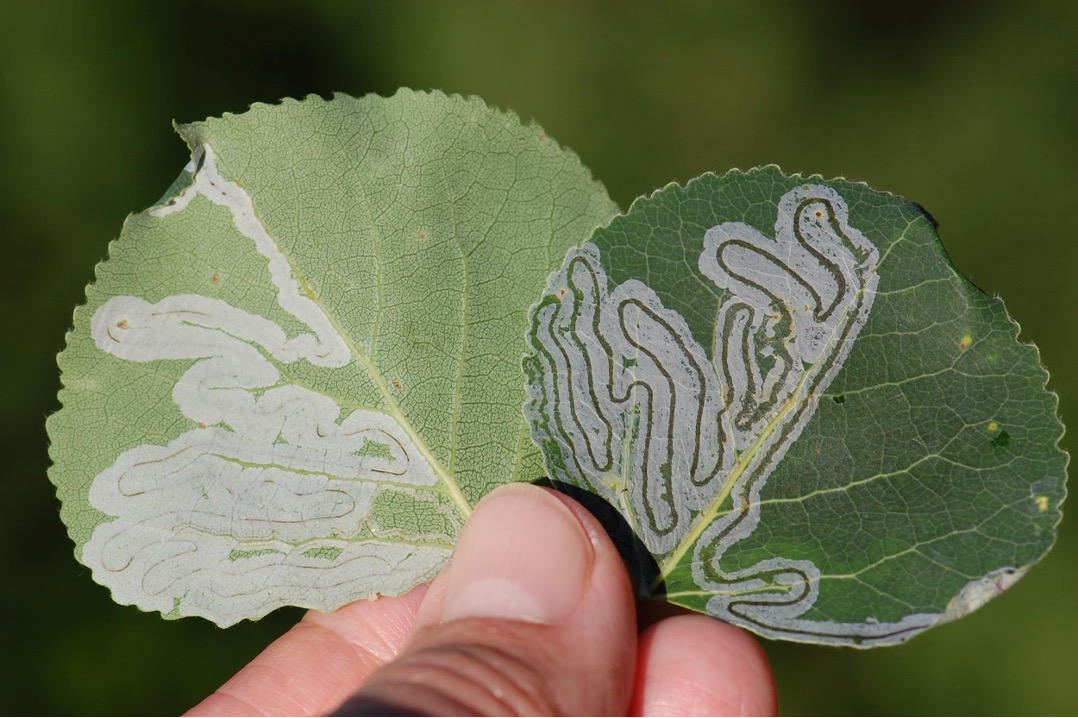
Caterpillars might look small, but can they actually be harmful? Yes, if there are enough of them! Aspen leaf miners are moths as adults, but before that, aspen leaf miner caterpillars are incredible herbivores. In the spring, they lay their eggs on the surface of leaves, and they sink into the outer cell layer. When they hatch, the caterpillars quickly get to work. Using their blade-like mouth parts, they slash through the surface cell layer and drink the contents that are released. They leave a trail of silver, damaged cells in their path.
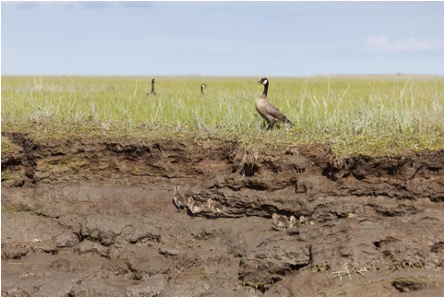
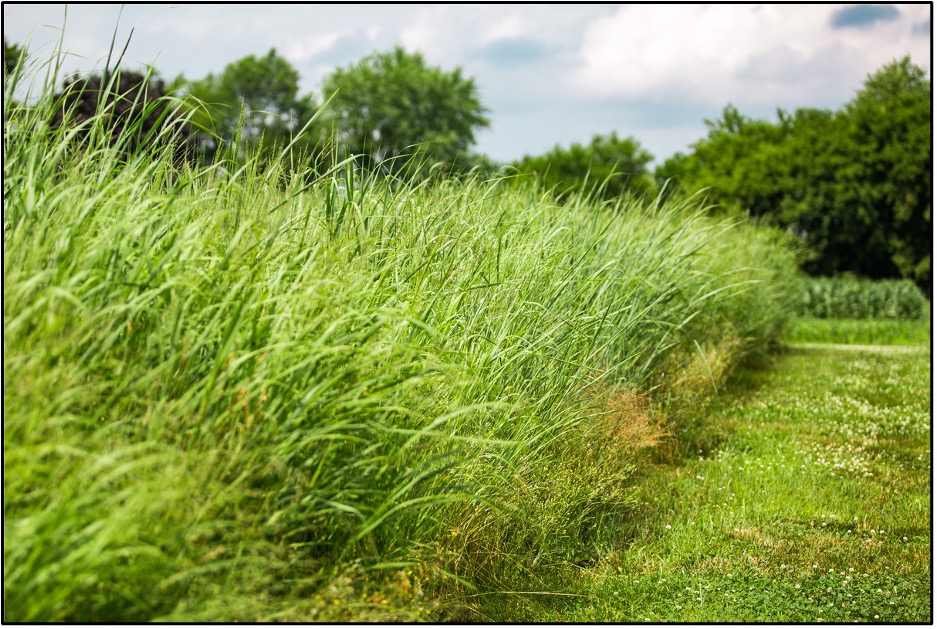
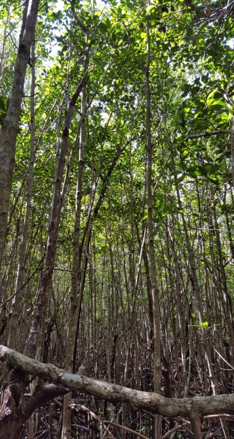
In recent years, aspen leaf miners have been increasing in numbers in Alaska and Canada. Aspen trees are an important component of the boreal forest, providing nutritious food for wildlife, supporting a diverse ecosystem, and capturing carbon dioxide (CO2) from the atmosphere at a high rate. Jenifer and Diane are two plant biologists who want to know if the aspen leaf miners are affecting leaves’ ability to do their job. Trees rely on their leaves to capture light energy for photosynthesis. During this process, cells convert CO2 gas from the atmosphere into sugar. Gases enter and leave through pores called stomata – CO2 comes in, and water vapor leaves.
To avoid excessive water loss, leaves carefully control when the stomata are open. Stomata are surrounded by two sausage-shaped cells, called guard cells. The default position keeps the stomata closed. Different signals can cue the guard cells to open, but if too much water escapes, the stomata will close up again.
In aspen trees, the guard cells are only on the bottom of the leaf. Jenifer and Diane suspected that leaf miners on the bottom side of the leaf would be destroying guard cells as they feed. They thought that if guard cells are no longer able to function properly, they would get stuck in the default closed position. This would limit photosynthesis because they would no longer be able to take in CO2 or let out water vapor.
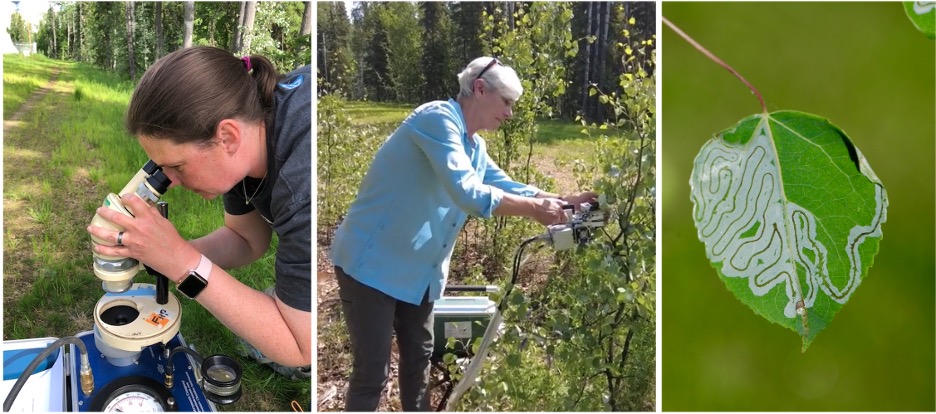
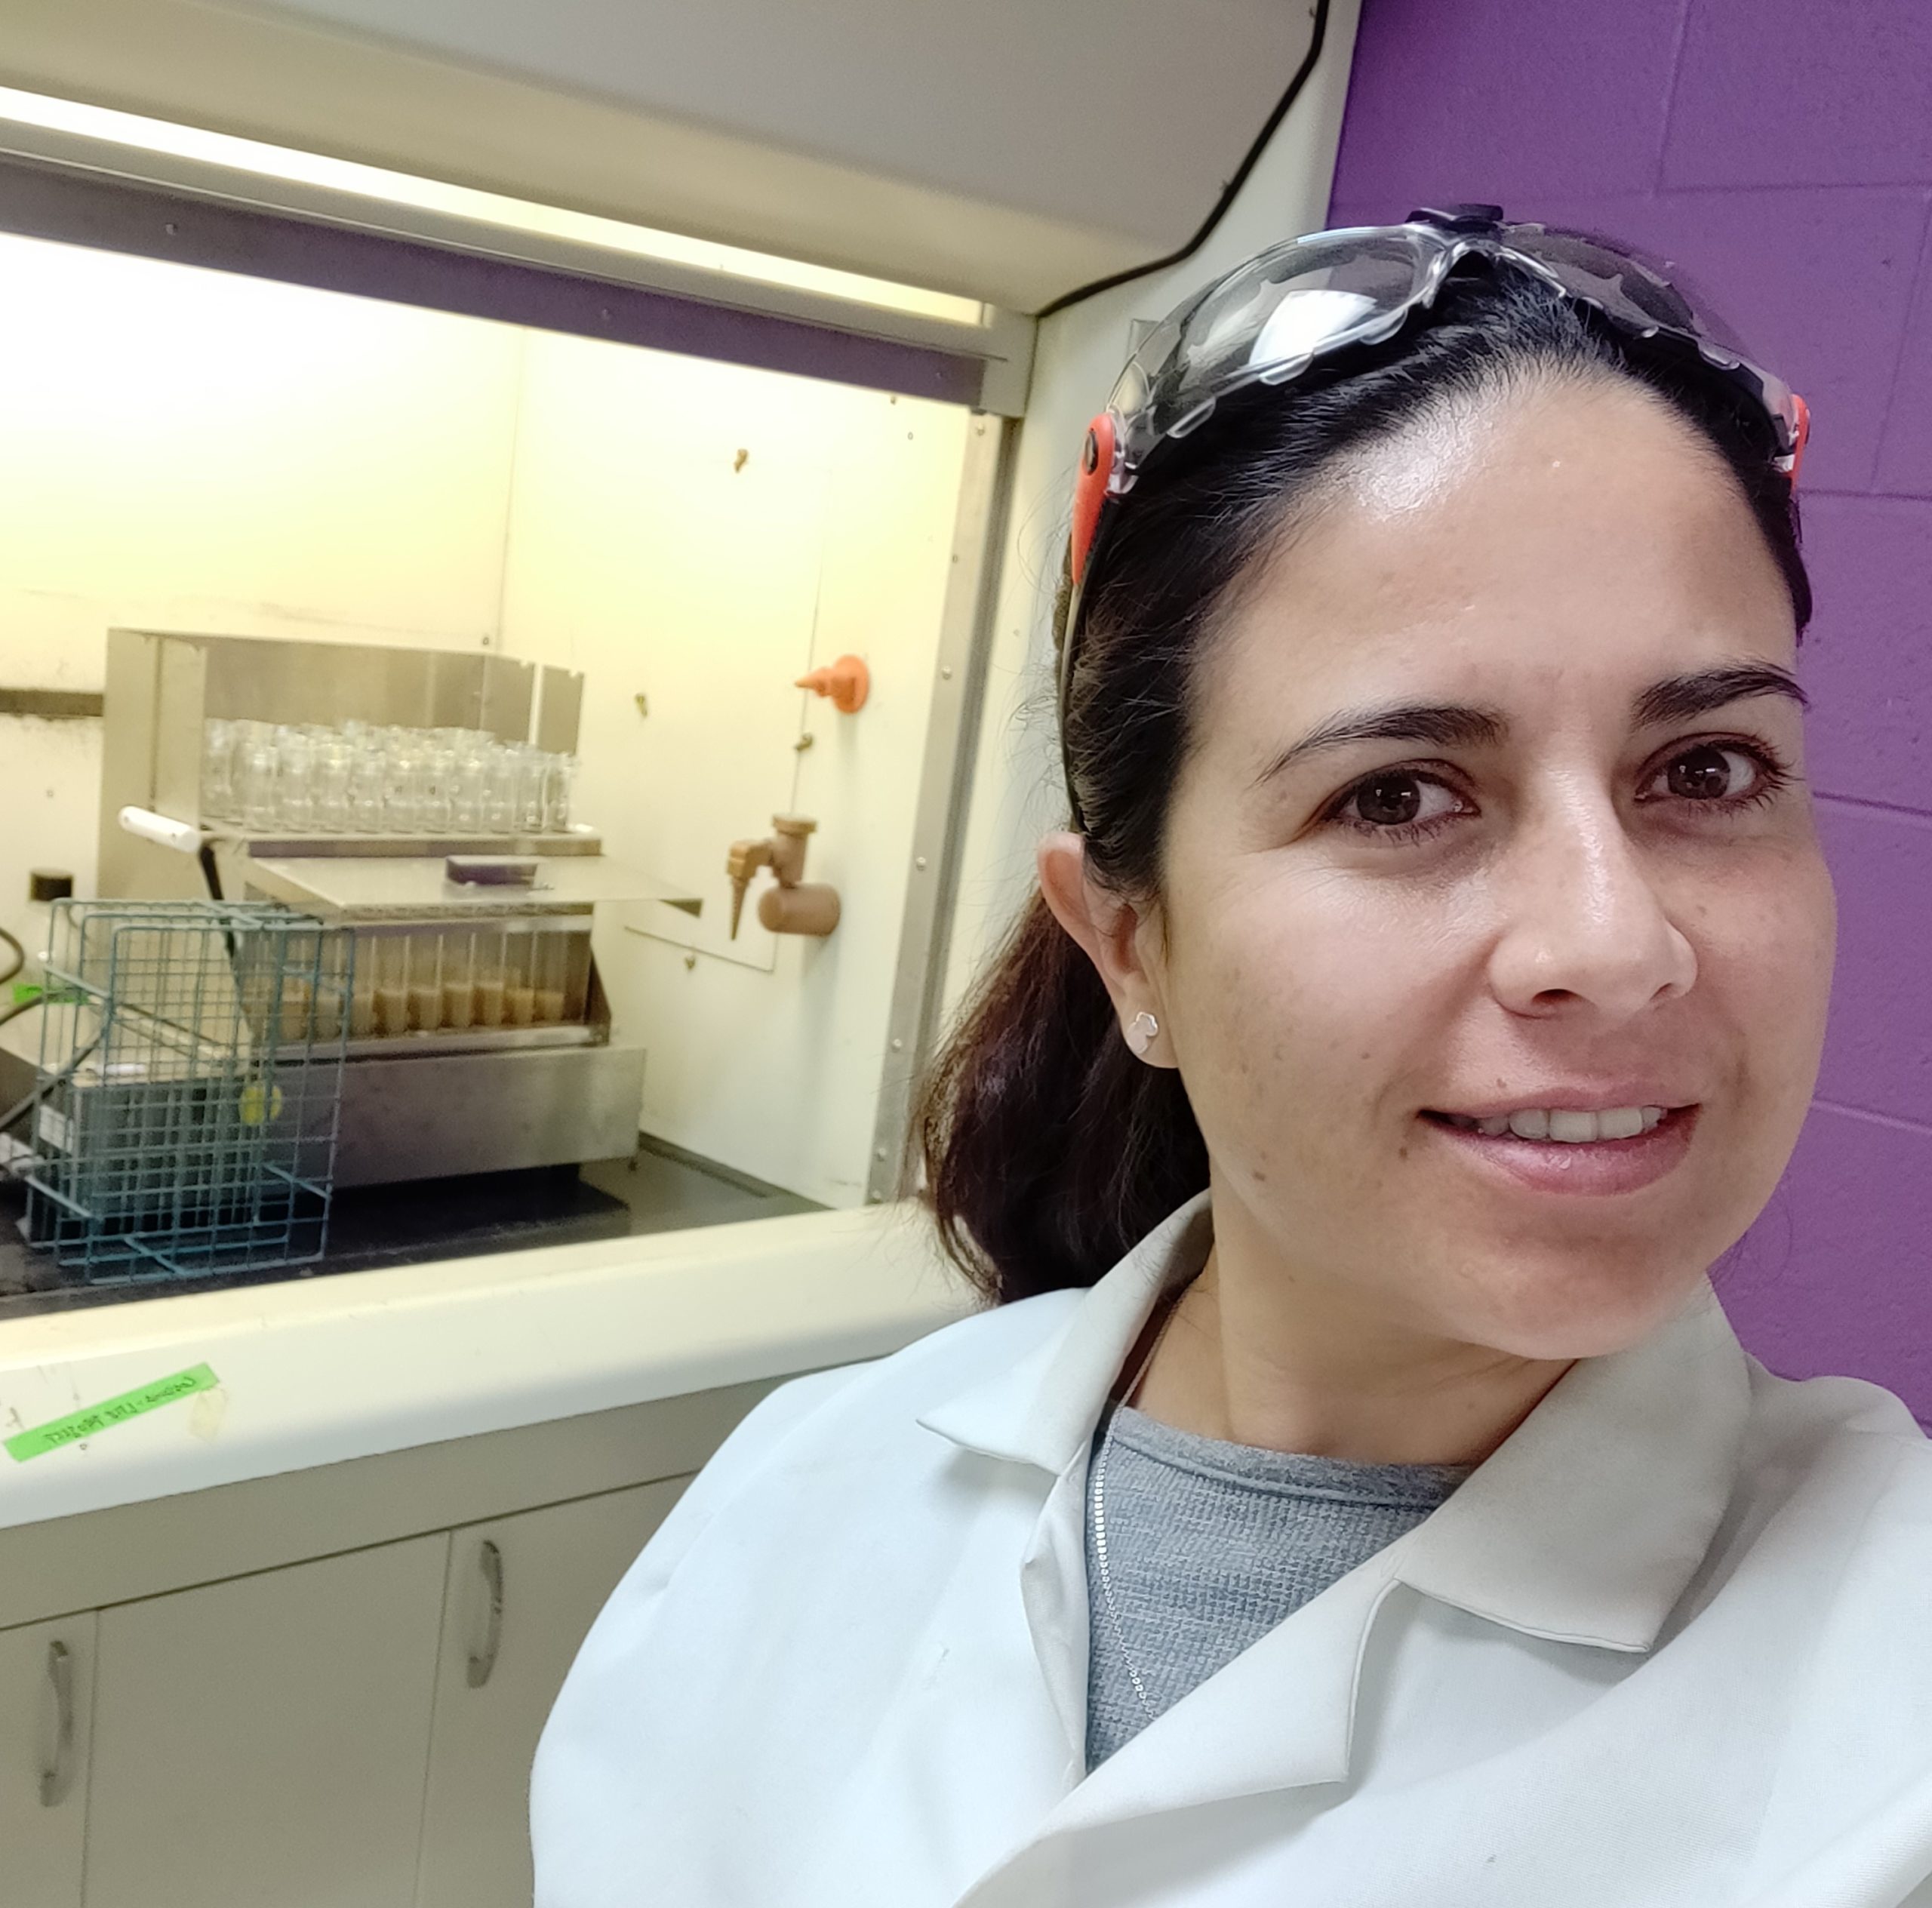
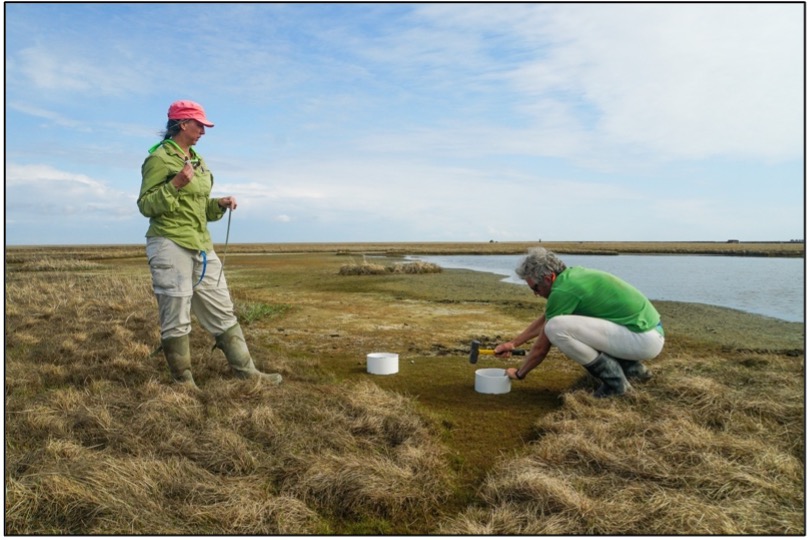
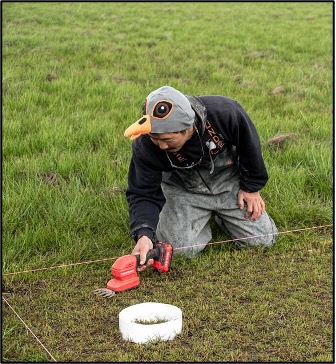
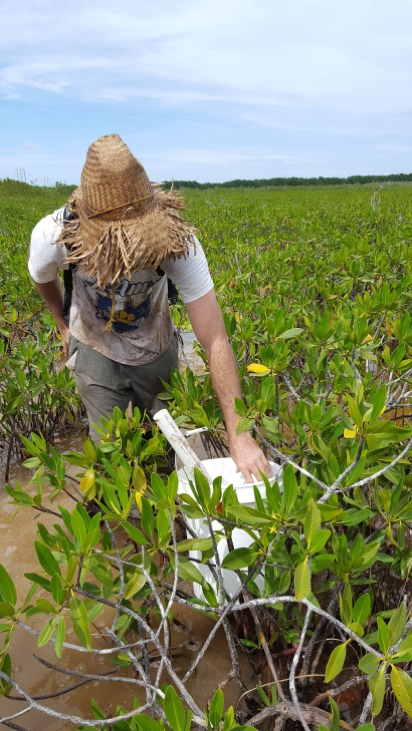
To test their idea, Jenifer and Diane set up an experiment on the University of Alaska campus in Fairbanks. Jenifer and Diane let leaf miners lay eggs on leaves, like normal. Each caterpillar is so small that it stays on a single leaf side to eat. Jenifer and Diane removed eggs and marked about 10 leaves on each of 14 aspen trees. They randomly assigned each leaf to one of three treatments by removing the leaf miner eggs from either the top, bottom, or both sides of the leaves. To remove eggs from leaves, they wore magnifying headsets, just as a jeweler might wear, and carefully scraped each tiny egg off the leaf using a sharp probe. By doing so, they had leaves that were 1) mined on the bottom surface only, 2) mined on the top surface only, and 3) unmined (control) leaves.
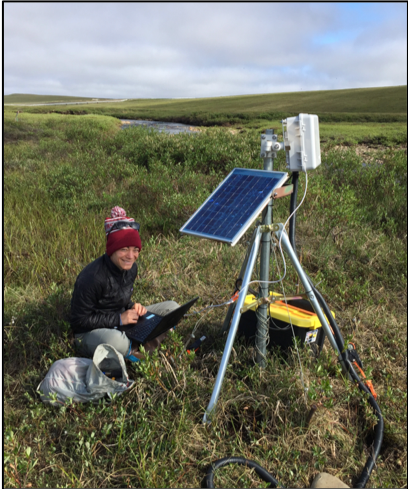
After the leaf miner caterpillars were finished feeding for the season, Jenifer and Diane came back to assess the damage. To understand the effect of the leaf mining damage on the leaves, they measured the photosynthesis and stomatal conductance of water vapor in the different treatments. To do this, they used a special piece of equipment called a portable infrared gas analyzer. The analyzer has two chambers – one that can be clamped onto a single leaf and one that is a control with no leaf. Gas is pumped through both chambers, and the gas concentrations from the leaf and the control are recorded and compared. The difference in CO2 concentration between the chambers is used to calculate the rate that CO2 is taken in by the leaf from photosynthesis. The difference in water vapor is used to measure how easily water vapor is passing out of the leaf through the stomata.
Jenifer and Diane predicted that if the stomata are stuck closed, less CO2 would be taken from the atmosphere and less water vapor would be lost from the stomata. In other words, leaves with leaf miners on the bottom would have lower photosynthesis rates and decreased stomatal conductance of water vapor compared to the other treatments.
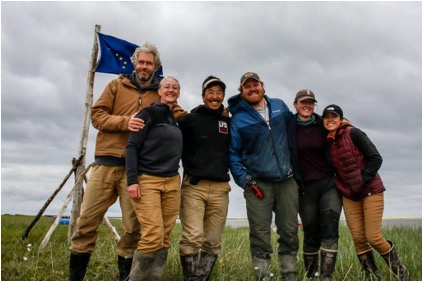
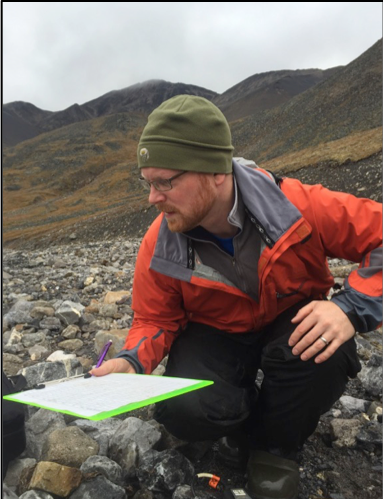
Featured scientists: Jenifer Wheeler (she/her) and Diane Wagner (she/her) from the University of Alaska Fairbanks. Written with Denise Kind (she/her).
Flesch–Kincaid Reading Grade Level = 9.3
Additional Teacher Resources:
There are short videos with background information on the study of aspen leaf miners in Alaska:
- Aspen Ecology
- The Herbivore: Aspen Leaf Miner
- Leaf Structure and Function
- Measuring Leaf Gas Exchange
A scientific journal article about this research project: https://doi.org/10.1093/treephys/tpz109. Access the pdf here.
An additional educational module on the effects of the aspen leaf miners is available through the AKDatUM website.
The original data file can be found on the Bonanza Creek Long Term Ecological Research website, in the Data Catalog. Under Title, search for “leaf miner feeding damage”. There are many additional leaf physiology variables included in the data set.