Melissa and Liz heading to the classroom to present their research!
Data Nuggets are free classroom activities, co-designed by scientists and teachers. When using Data Nuggets students are provided with the details of authentic science research projects, and then get to work through an activity that gives them practice looking for patterns and developing explanations about natural phenomena using the scientific data from the study. The goals of the Data Nuggets project are to (1) help scientists increase the broader impacts of their research by sharing their “science story” and data with the public, and (2) to engage students in the practices of science through an innovative approach that combines scientific content from authentic research with key concepts in quantitative reasoning.
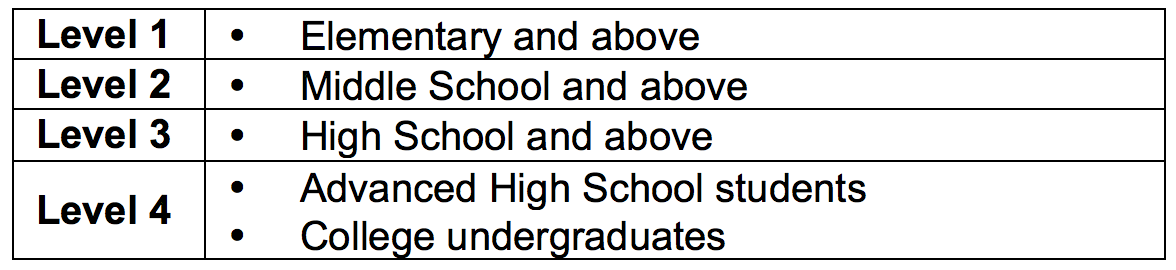
Content Levels and Graph Types:
Because of their simplicity and flexibility, Data Nuggets can be used throughout the school year as students build confidence in their quantitative skills. Reading and graphing levels allow for differentiated learning for students with any science background.
Data Nugget activities are ranked from 1-4 according to the reading, vocabulary, and content level of the background information provided to students. Readability for each activity is determined using the Flesch–Kincaid Reading Grade Level, which calculates how difficult a reading passage in English is to understand. Content level is determined by aligning each activity with science standards and discussions with our advisor panel of K-12 teachers. Activities of the highest level (4) are probably inappropriate for younger students, but level 1 activities are still appropriate to use with higher-level students if the quantitative skills they teach are relevant.
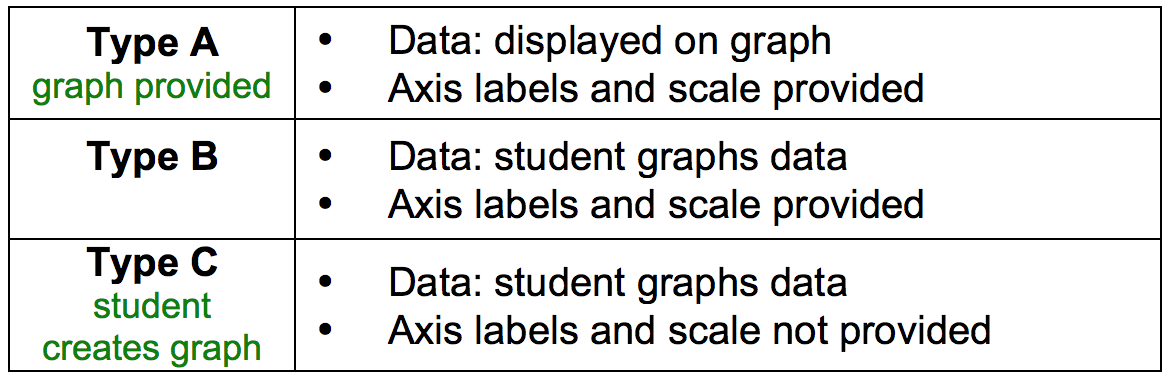
Each Data Nugget comes with three student versions, based on the type of graphing skills required. Type A activities provide the graph for the students (allowing a focus on graph interpretation, making claims based on evidence, and explaining reasoning), Type B activities provide axis labels but requires students to graph the data, and Type C provides an unlabeled grid on which to draw a graph.
History:
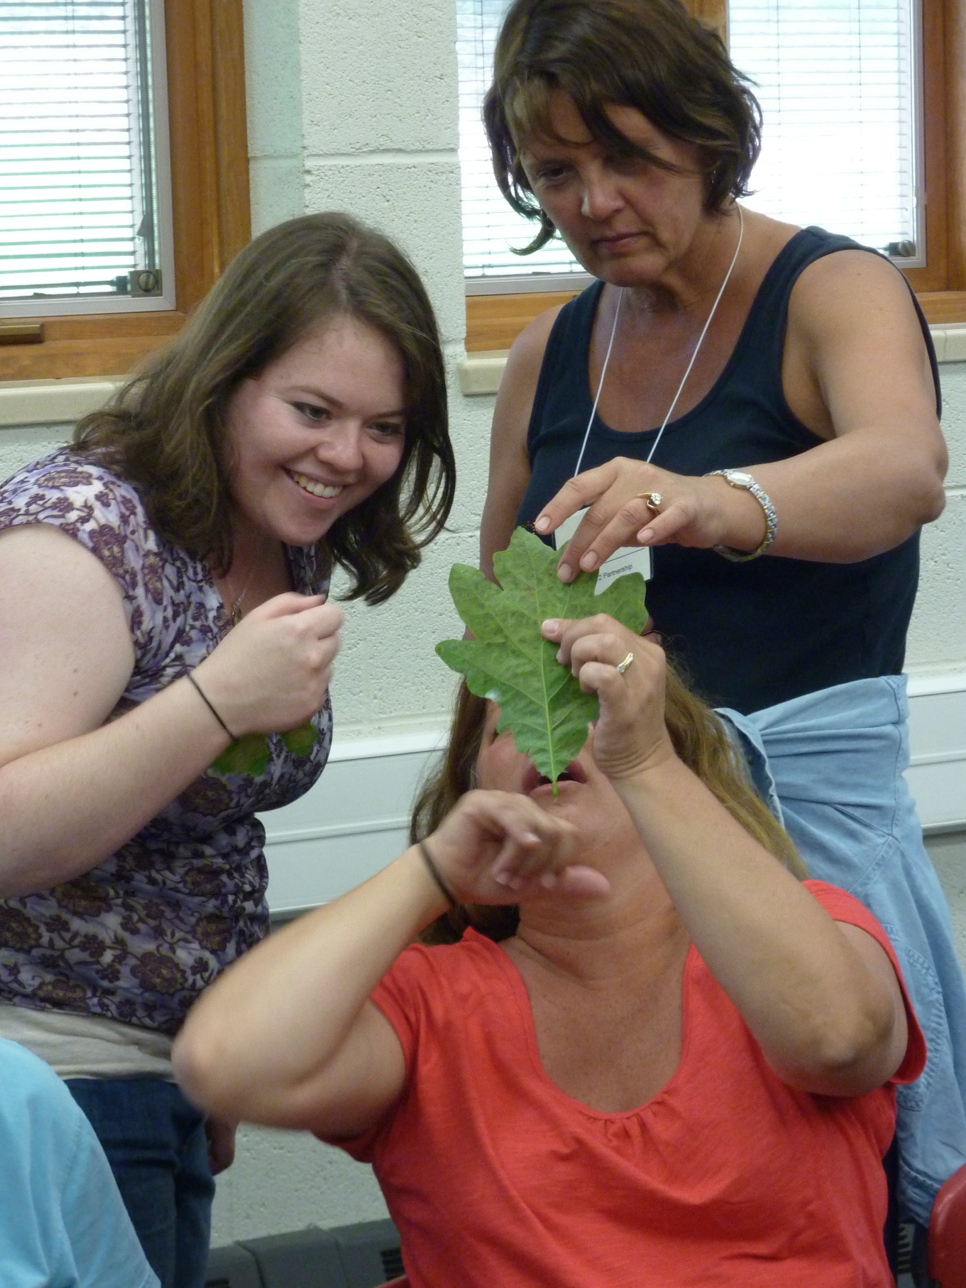
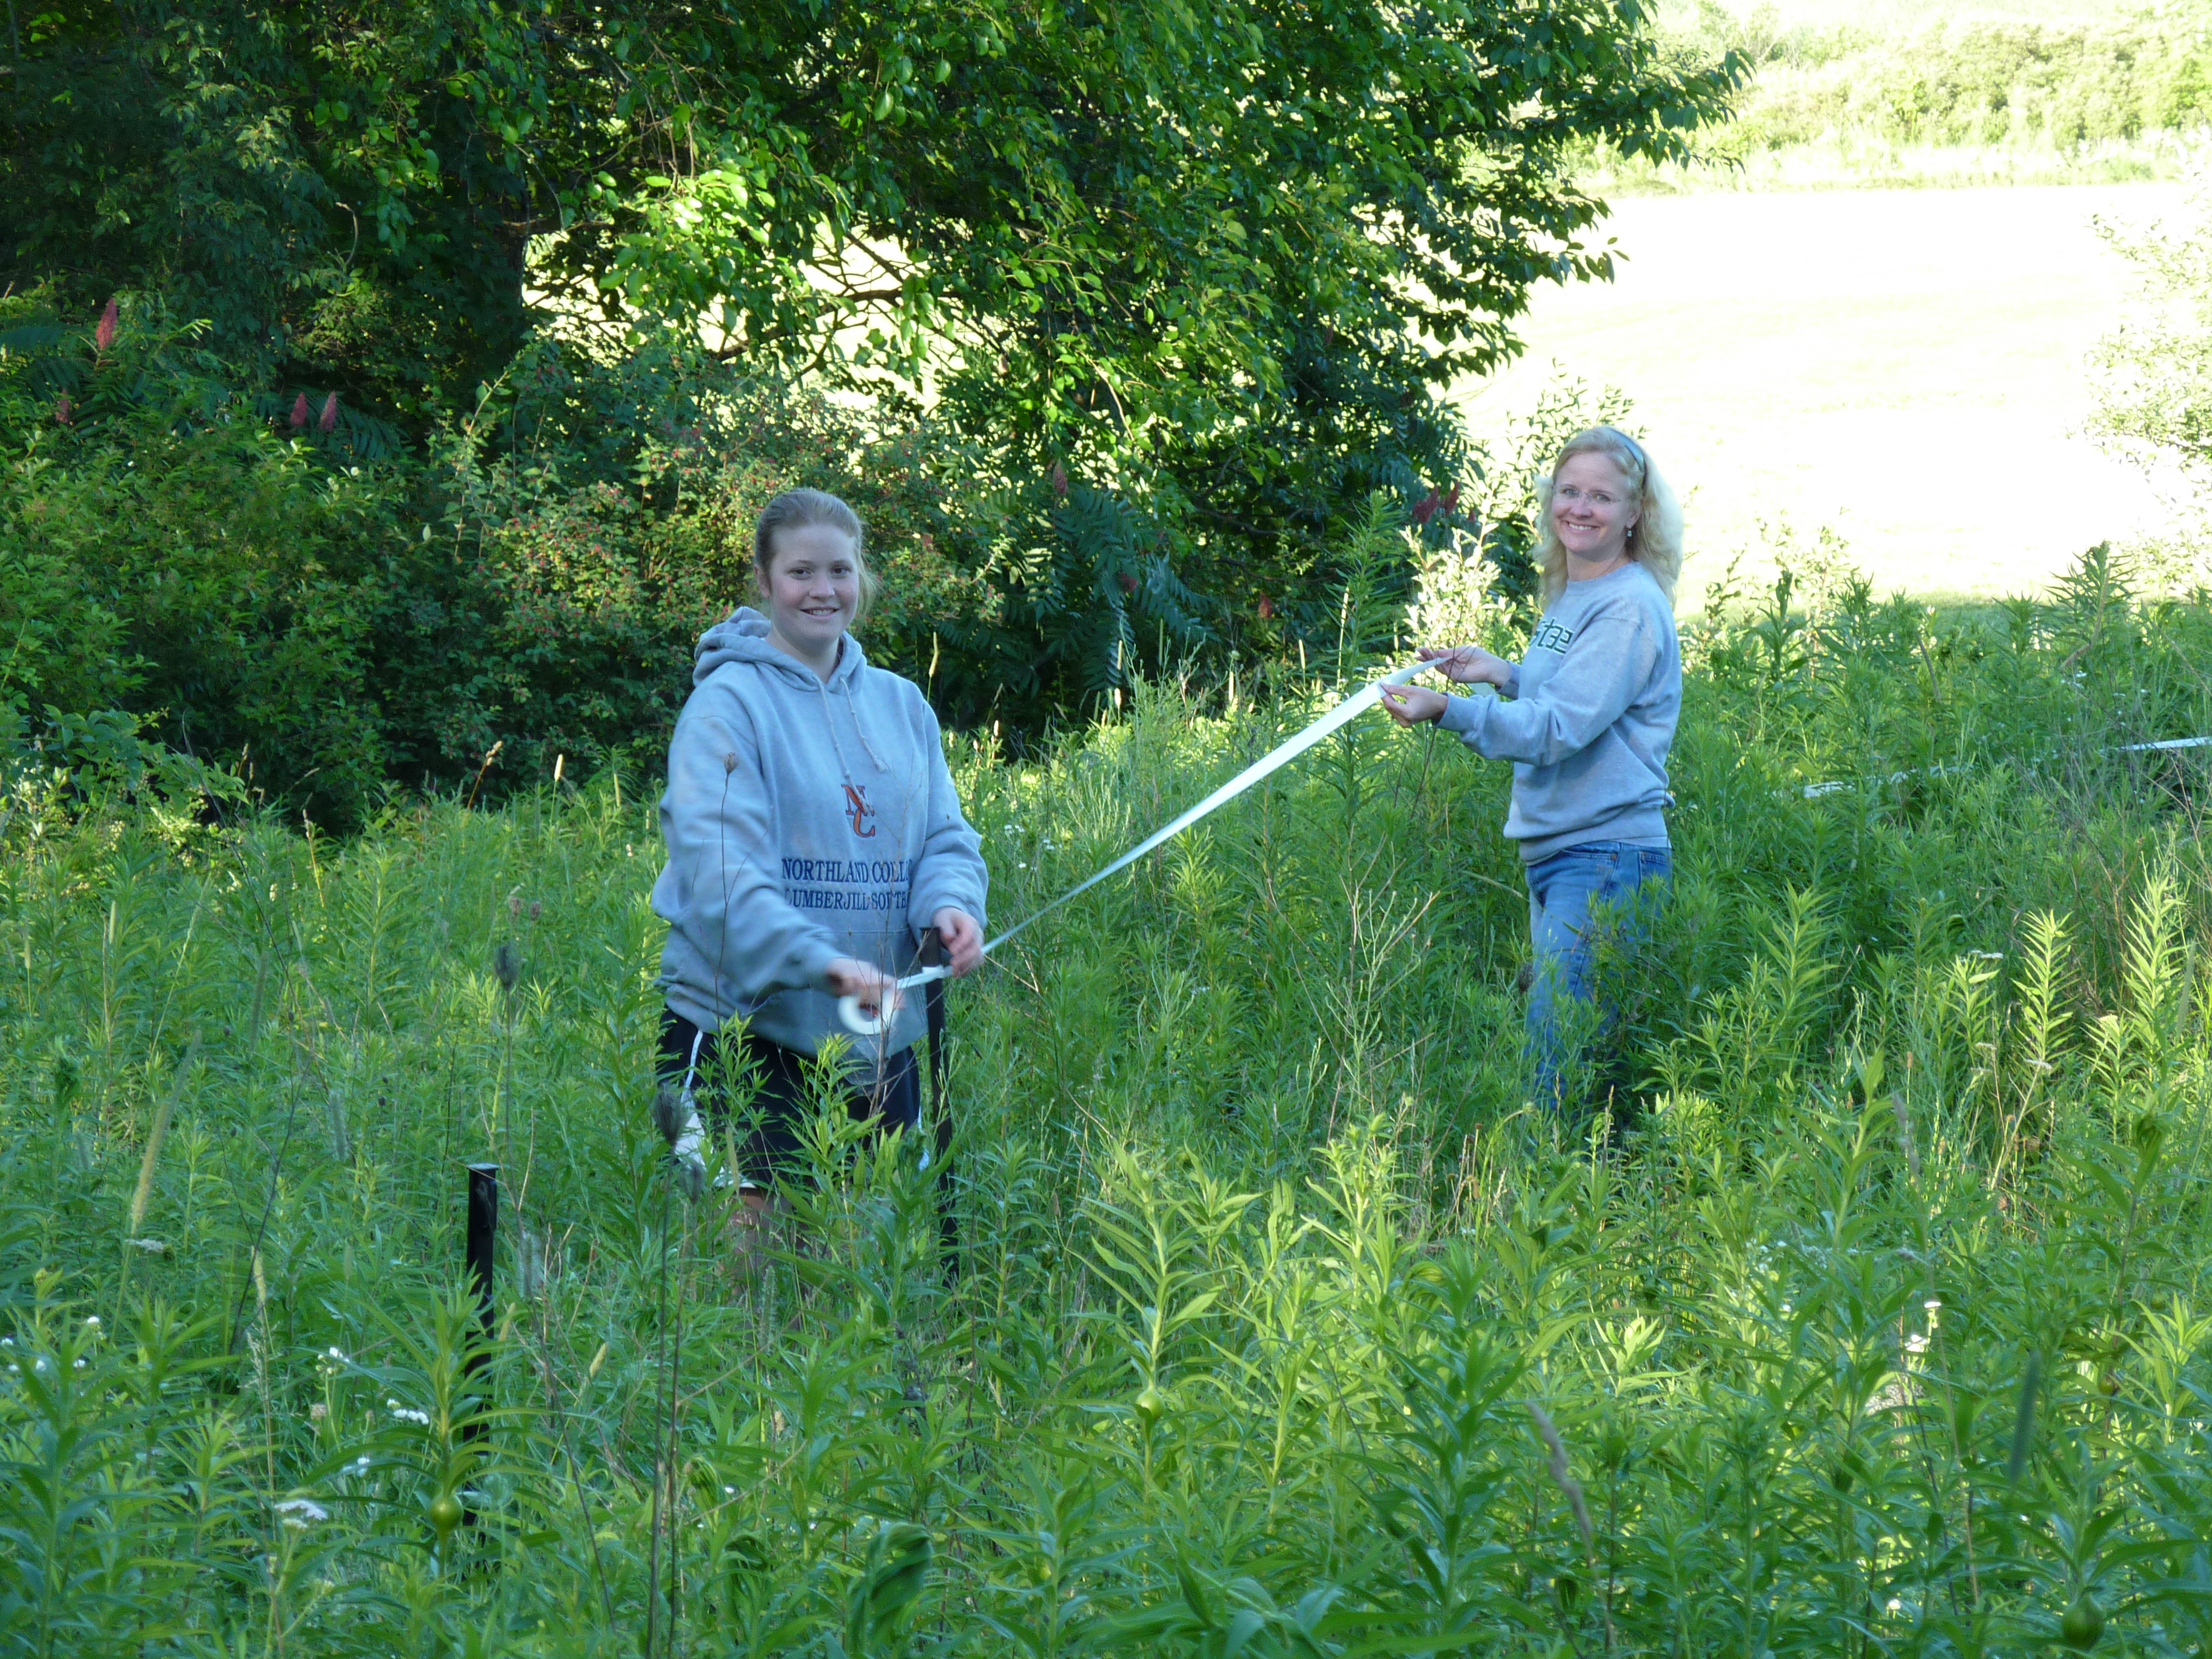
Liz Schultheis working with teachers to collect herbivory data.
Data Nuggets are designed and developed by Elizabeth Schultheis and Melissa Kjelvik from Michigan State University. They have been under development since 2011 and originated through conversations between science teachers and graduate students during the NSF GK-12 project “New GK-12: Using the STEM Dimensions of Bioenergy Sustainability to Bring Leading-edge Graduate Research to K-12 Learning Settings”. This unique opportunity for collaboration between teachers and scientists led to the creation of teacher-inspired resources. Teachers shared that they were lacking educational resources that helped their students practice working with real, messy data like that collected during classroom inquiry-based projects. Graduate students in the sciences, not surprisingly, have lots of practice working with messy data and surprising results. Through this collaboration, Data Nuggets were created to bring real data from current and ongoing research into the classroom and take students through the process of science, from the inception of ideas to the analysis and interpretation of data.
From 2013-2015, Data Nuggets were funded with seed grants from the NSF BEACON Center Study of Evolution in Action. These funds allowed us to greatly expand Data Nuggets as a resource, with activities developed from workshops held across the BEACON consortium. The funding has also provided opportunities to collaborate with science educators at Understanding Science (UCMP), National Institute for Mathematical and Biological Synthesis (NIMBioS), and Biological Sciences Curriculum Study (BSCS) to further refine the template and to align Data Nuggets with current science standards and reform, making them easier to integrate into existing curriculum.
Data Nuggets are currently funded by a 4-year NSF DRK-12 grant, awarded to MSU and BSCS in 2015, to conduct a research study to evaluate the effectiveness of integrating Data Nuggets into science curriculum. This research will help to determine whether these short activities can increase the quantitative abilities of students and their ability to think scientifically and support claims using data as evidence. They are also currently funded by the KBS LTER to develop new activities that focus on available long-term datasets, and expand students’ exposure to data of different levels of complexity.
Melissa Kjelvik and teacher Connie High working together to collect scientific data.
Melissa and Elizabeth will continue to develop and revise Data Nuggets to help teachers bring data from real, cutting-edge research into their classroom, and help students become comfortable working with messy data and unexpected results. Data Nuggets have gone through an iterative development process, where materials developed by scientists were used in the classroom and modified based on teacher and student experiences and feedback. We continue to present Data Nuggets at national and local education conferences where teachers and science educators can provide feedback on the structure and content of each activity. Our innovative and iterative development approach has led to a product that teachers and students find easy to work with and integrate into existing curriculum.
For more information on Data Nuggets, see our paper in the American Biology Teacher: Click here for a PDF!
