The activities are as follows:
- Teacher Guide
- Student activity, Graph Type A, Level 2
- Student activity, Graph Type B, Level 2
- Student activity, Graph Type C, Level 2
- PowerPoint of images
- Grading Rubric
- Scientist profile
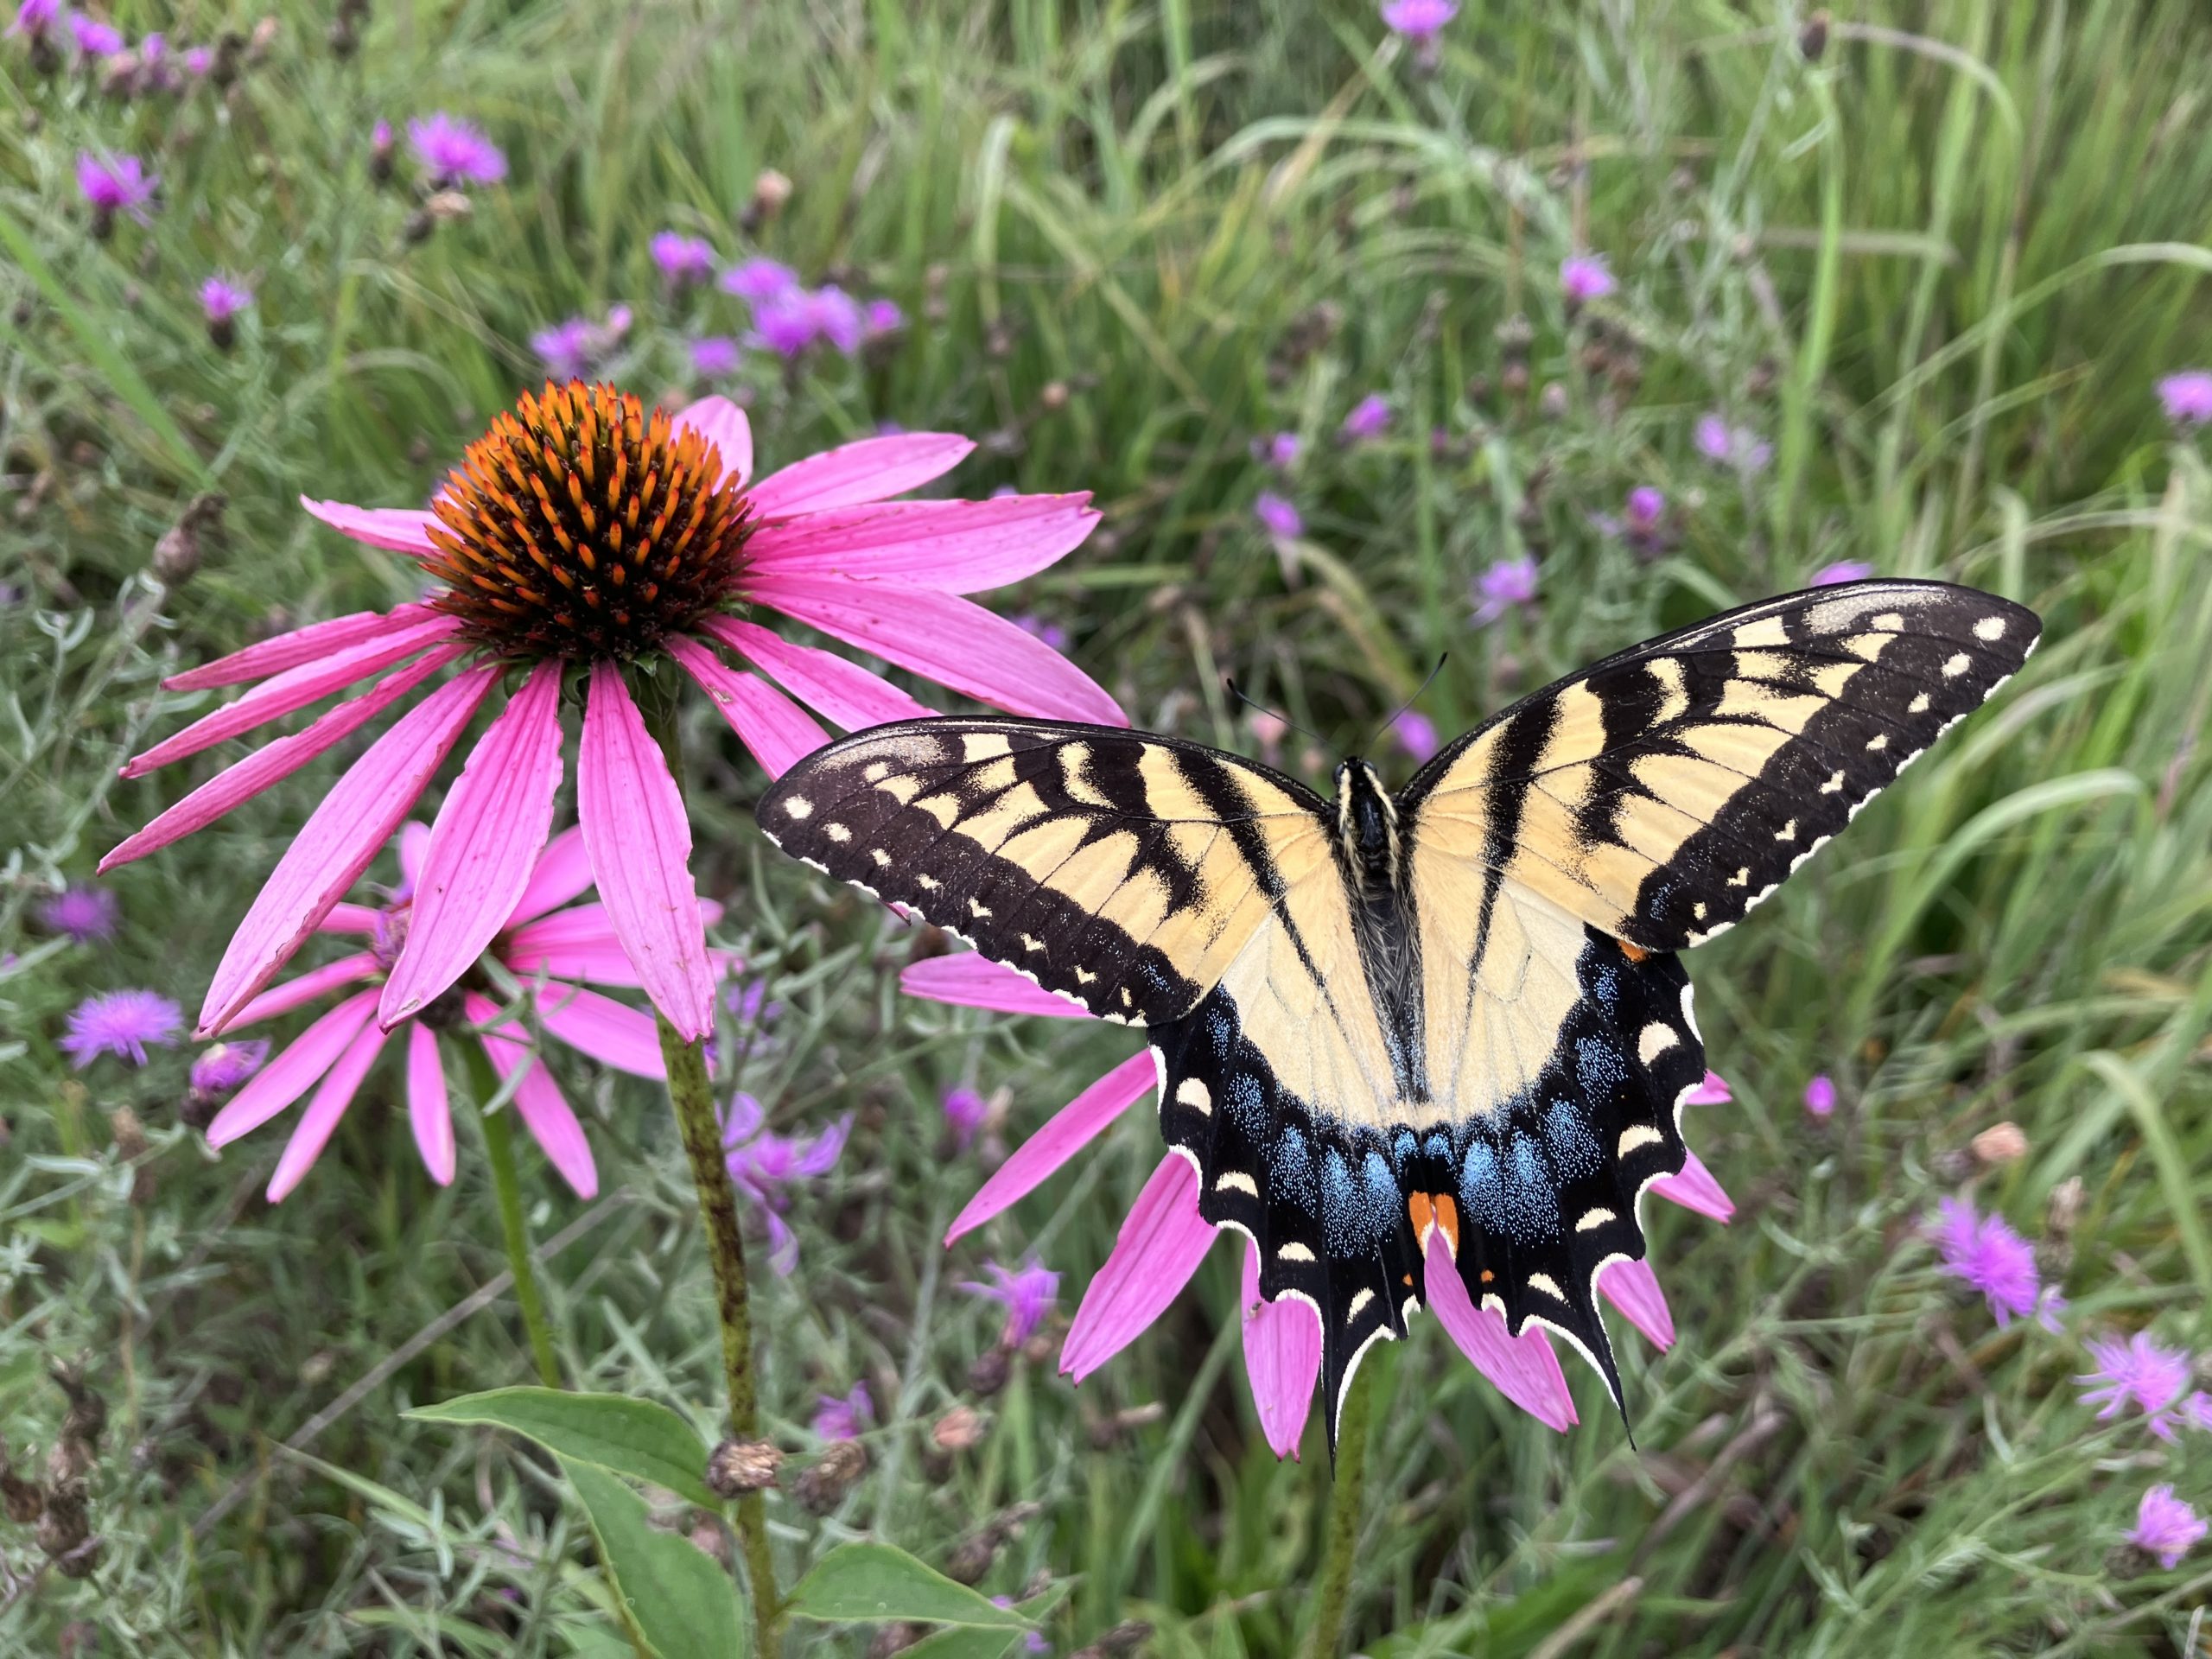
Butterflies are insects with colorful wings. You will often see them in a field, flying from flower to flower. Butterflies eat a sugary food made by flowers, called nectar. In return, the butterflies help the plants make seeds by moving pollen. As they travel from flower to flower, pollen is dropped off. This helps plants reproduce and make seeds. This is called pollination, and butterflies are pollinators. We need pollinators to grow many of the fruits and vegetables that we eat!
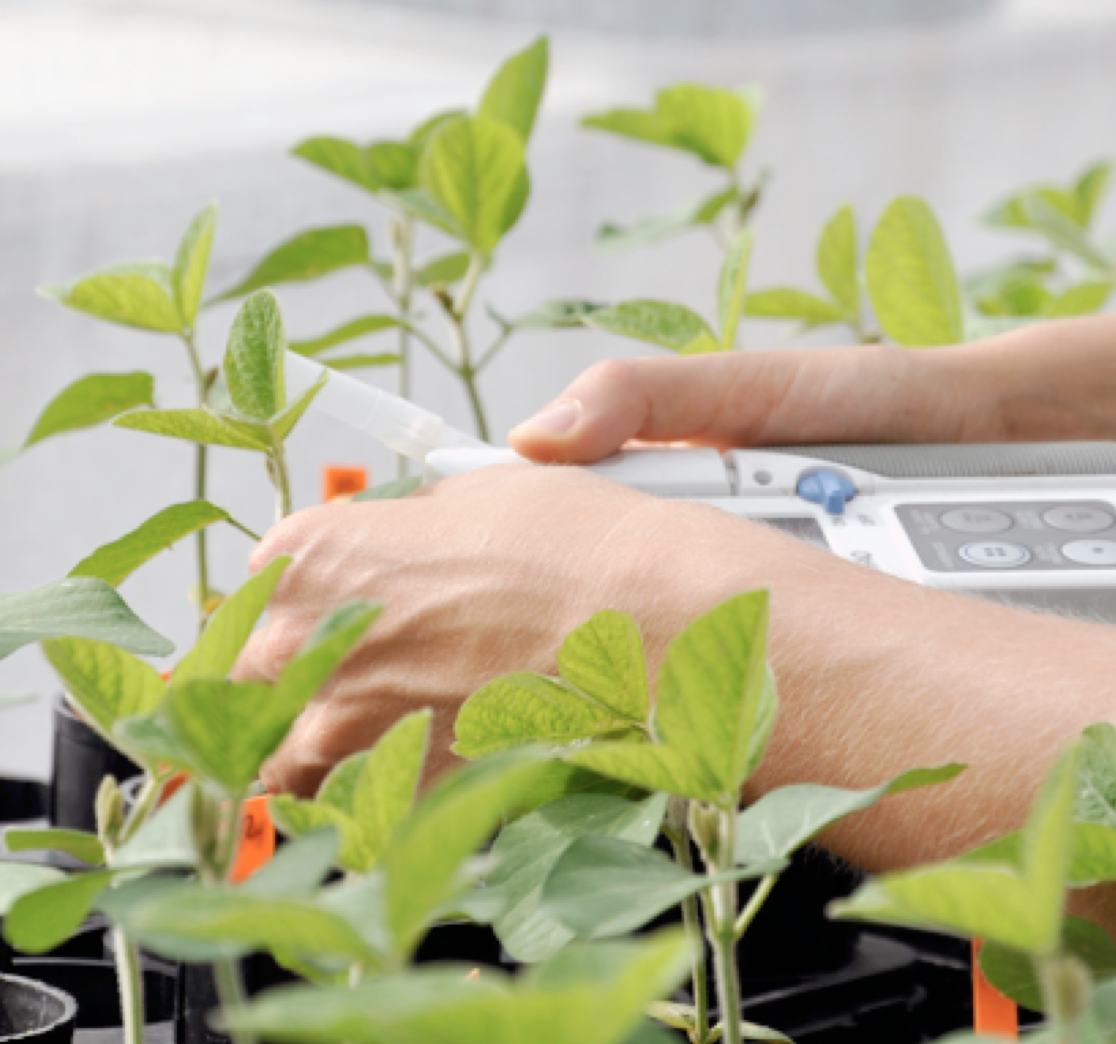
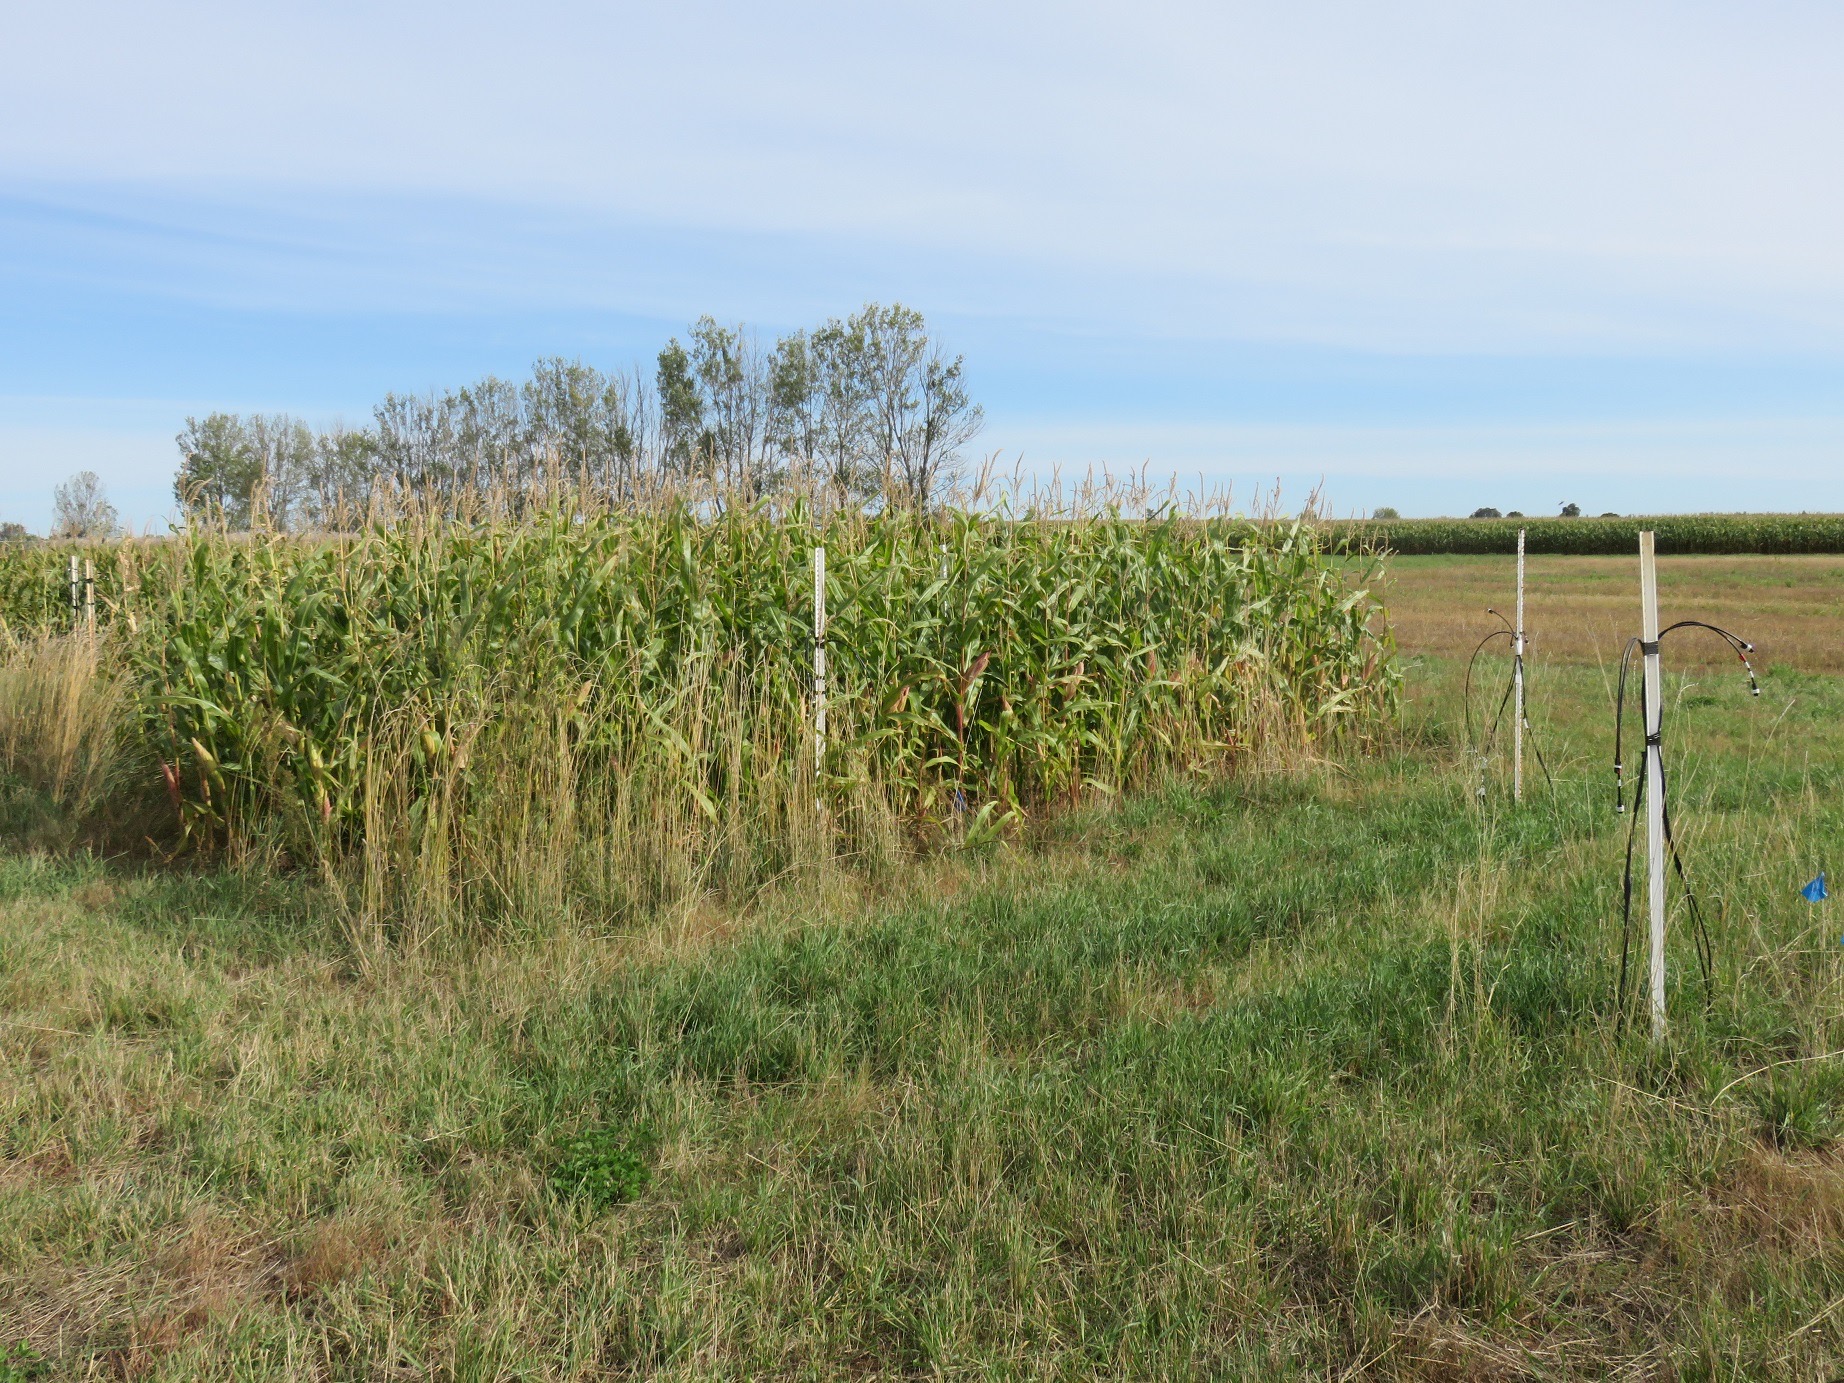
Prairies are habitats filled with many types of flowers. The Midwestern United States used to be covered in prairies. Today, most have been replaced by farm fields. Crops like corn and soybeans are commonly planted in the Midwest. Farm fields are important because we need land to grow our food. But this also means there is less food and habitat for butterflies.
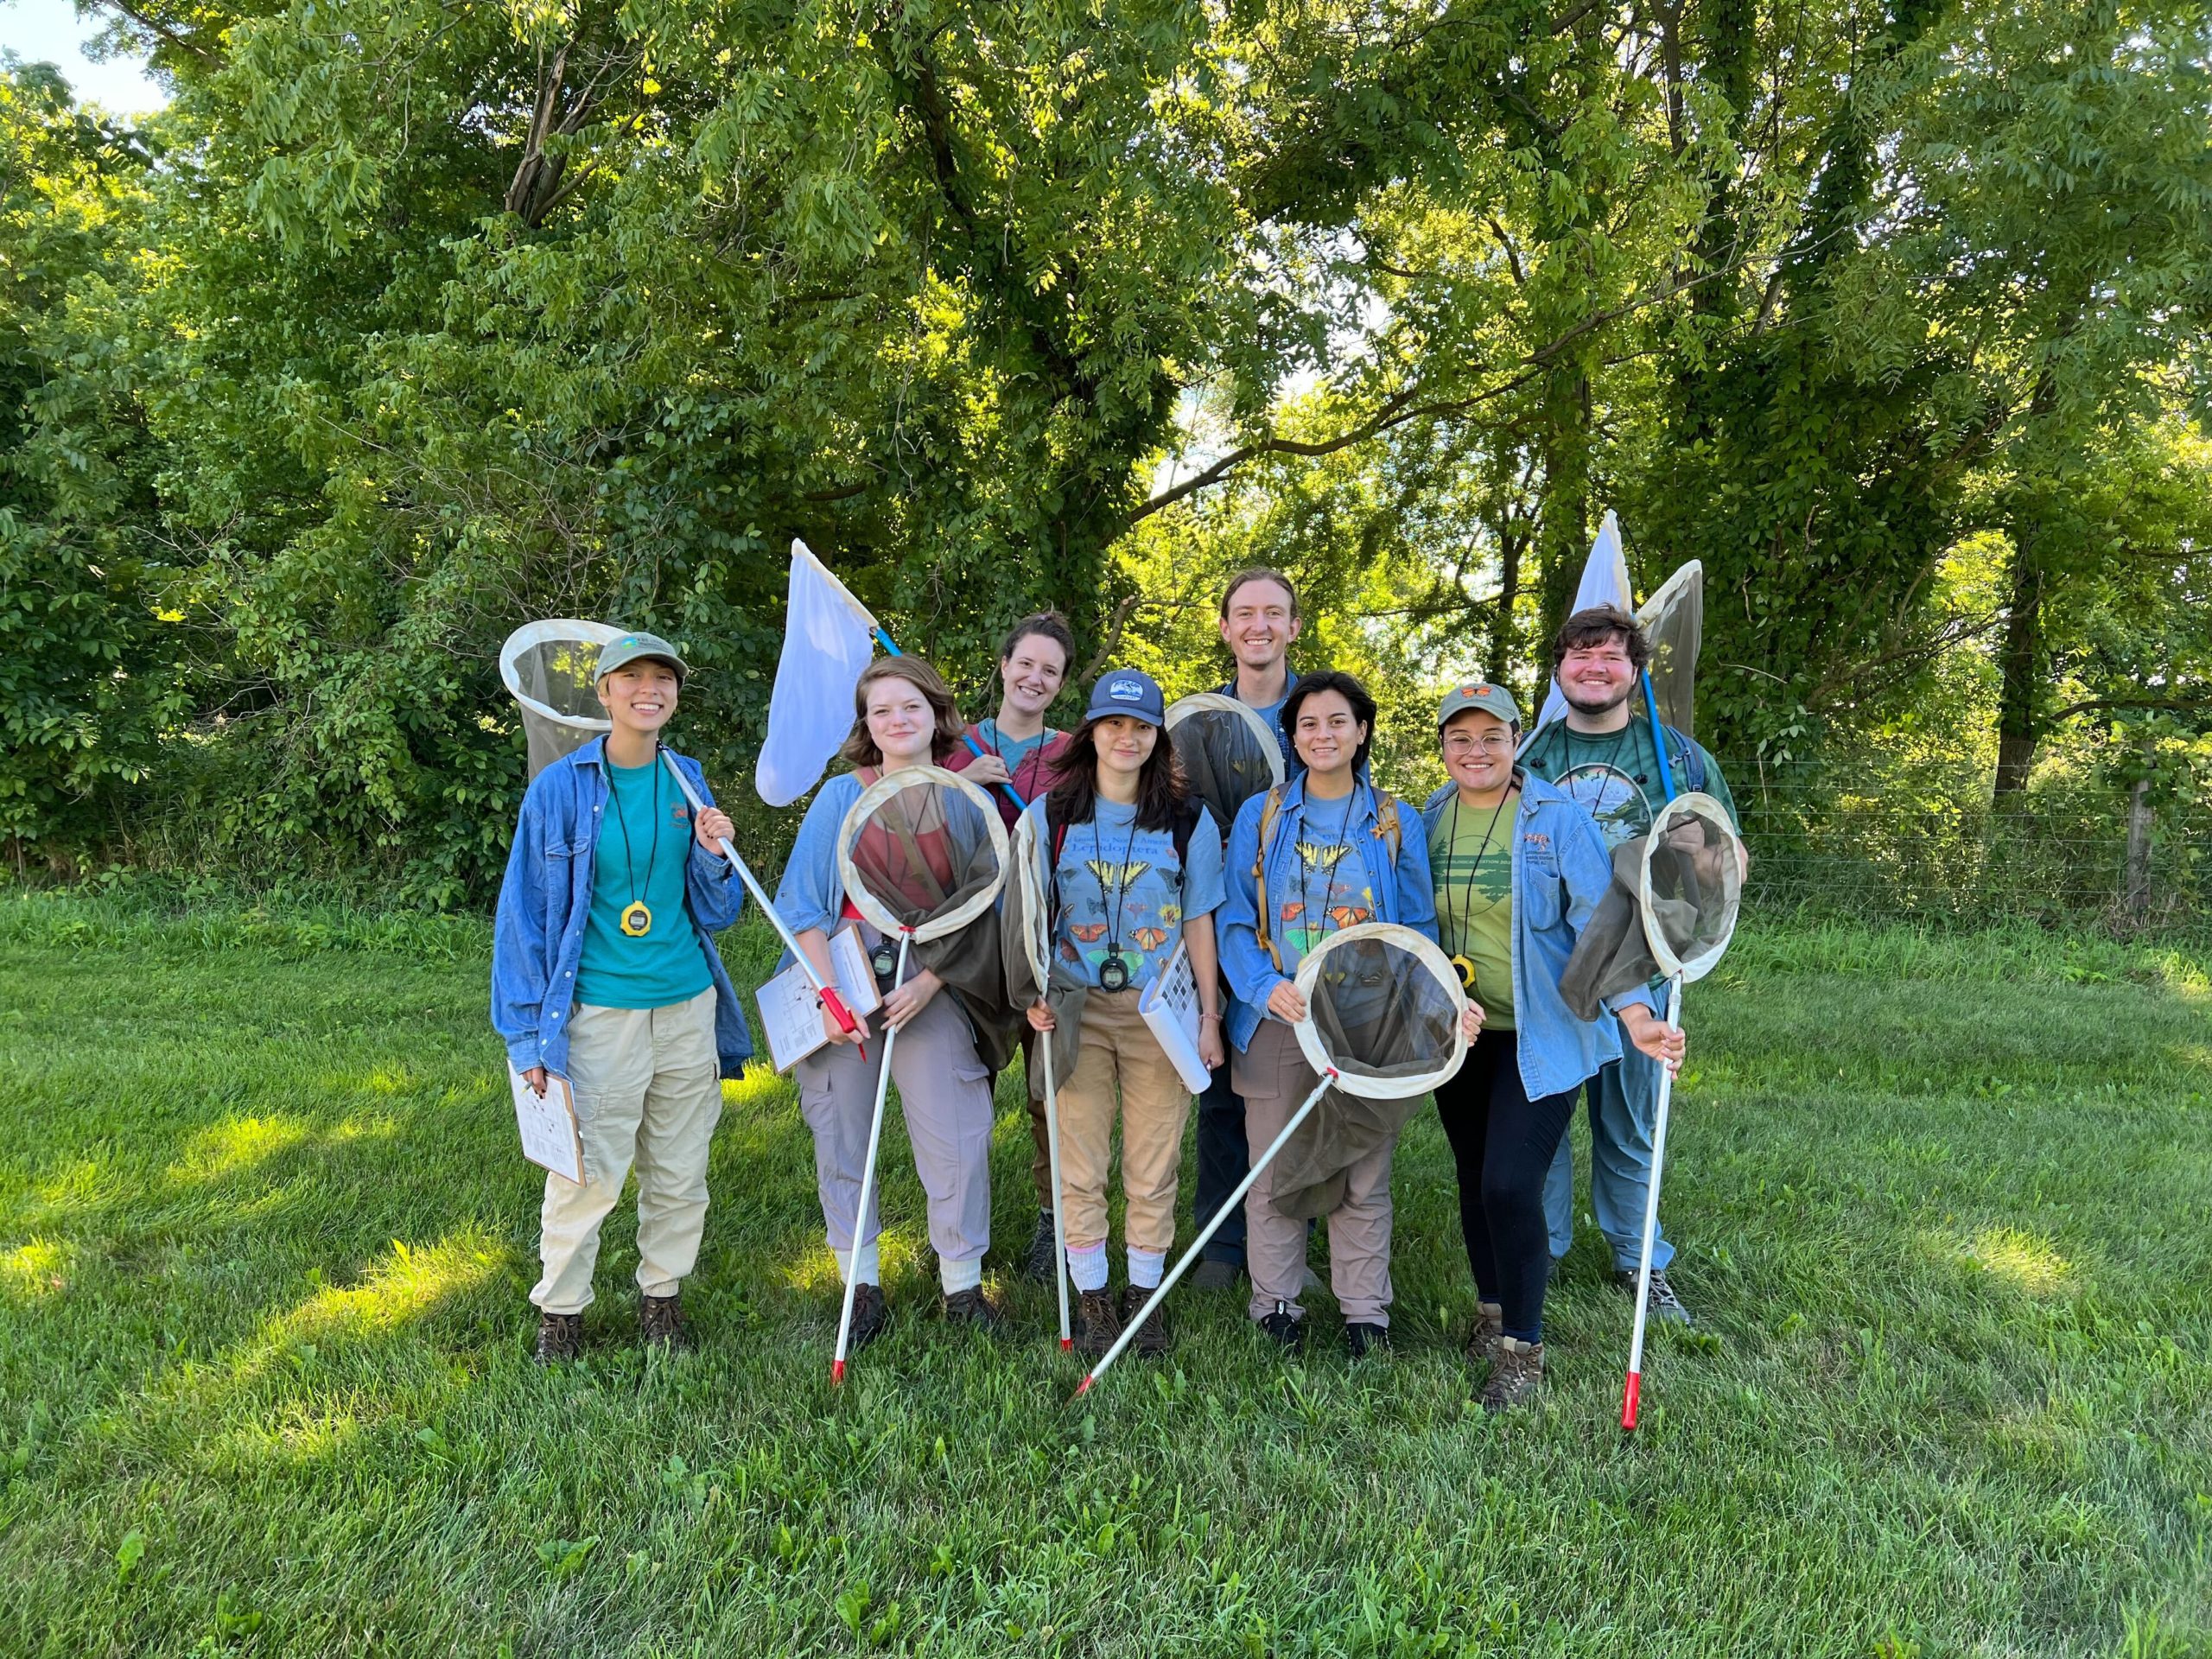
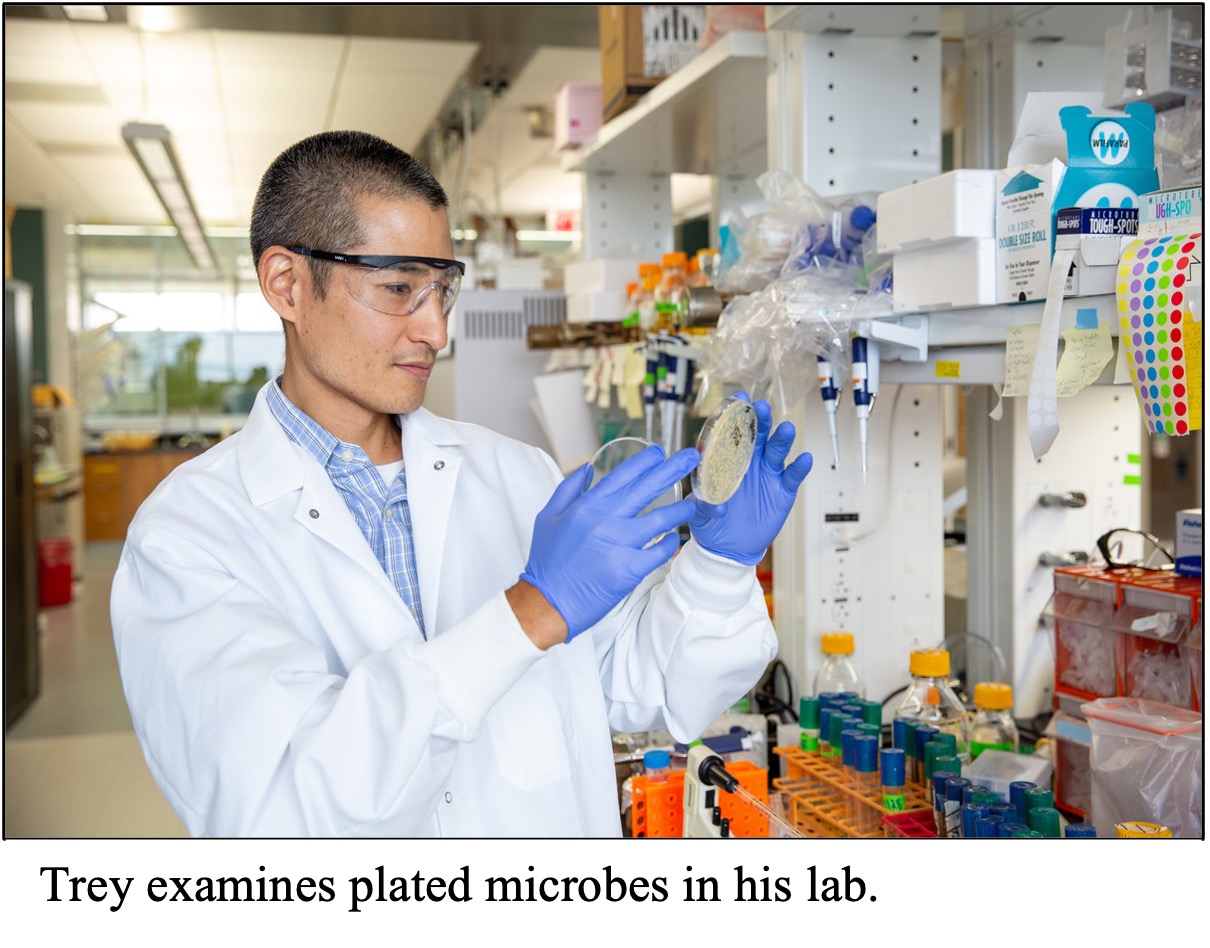
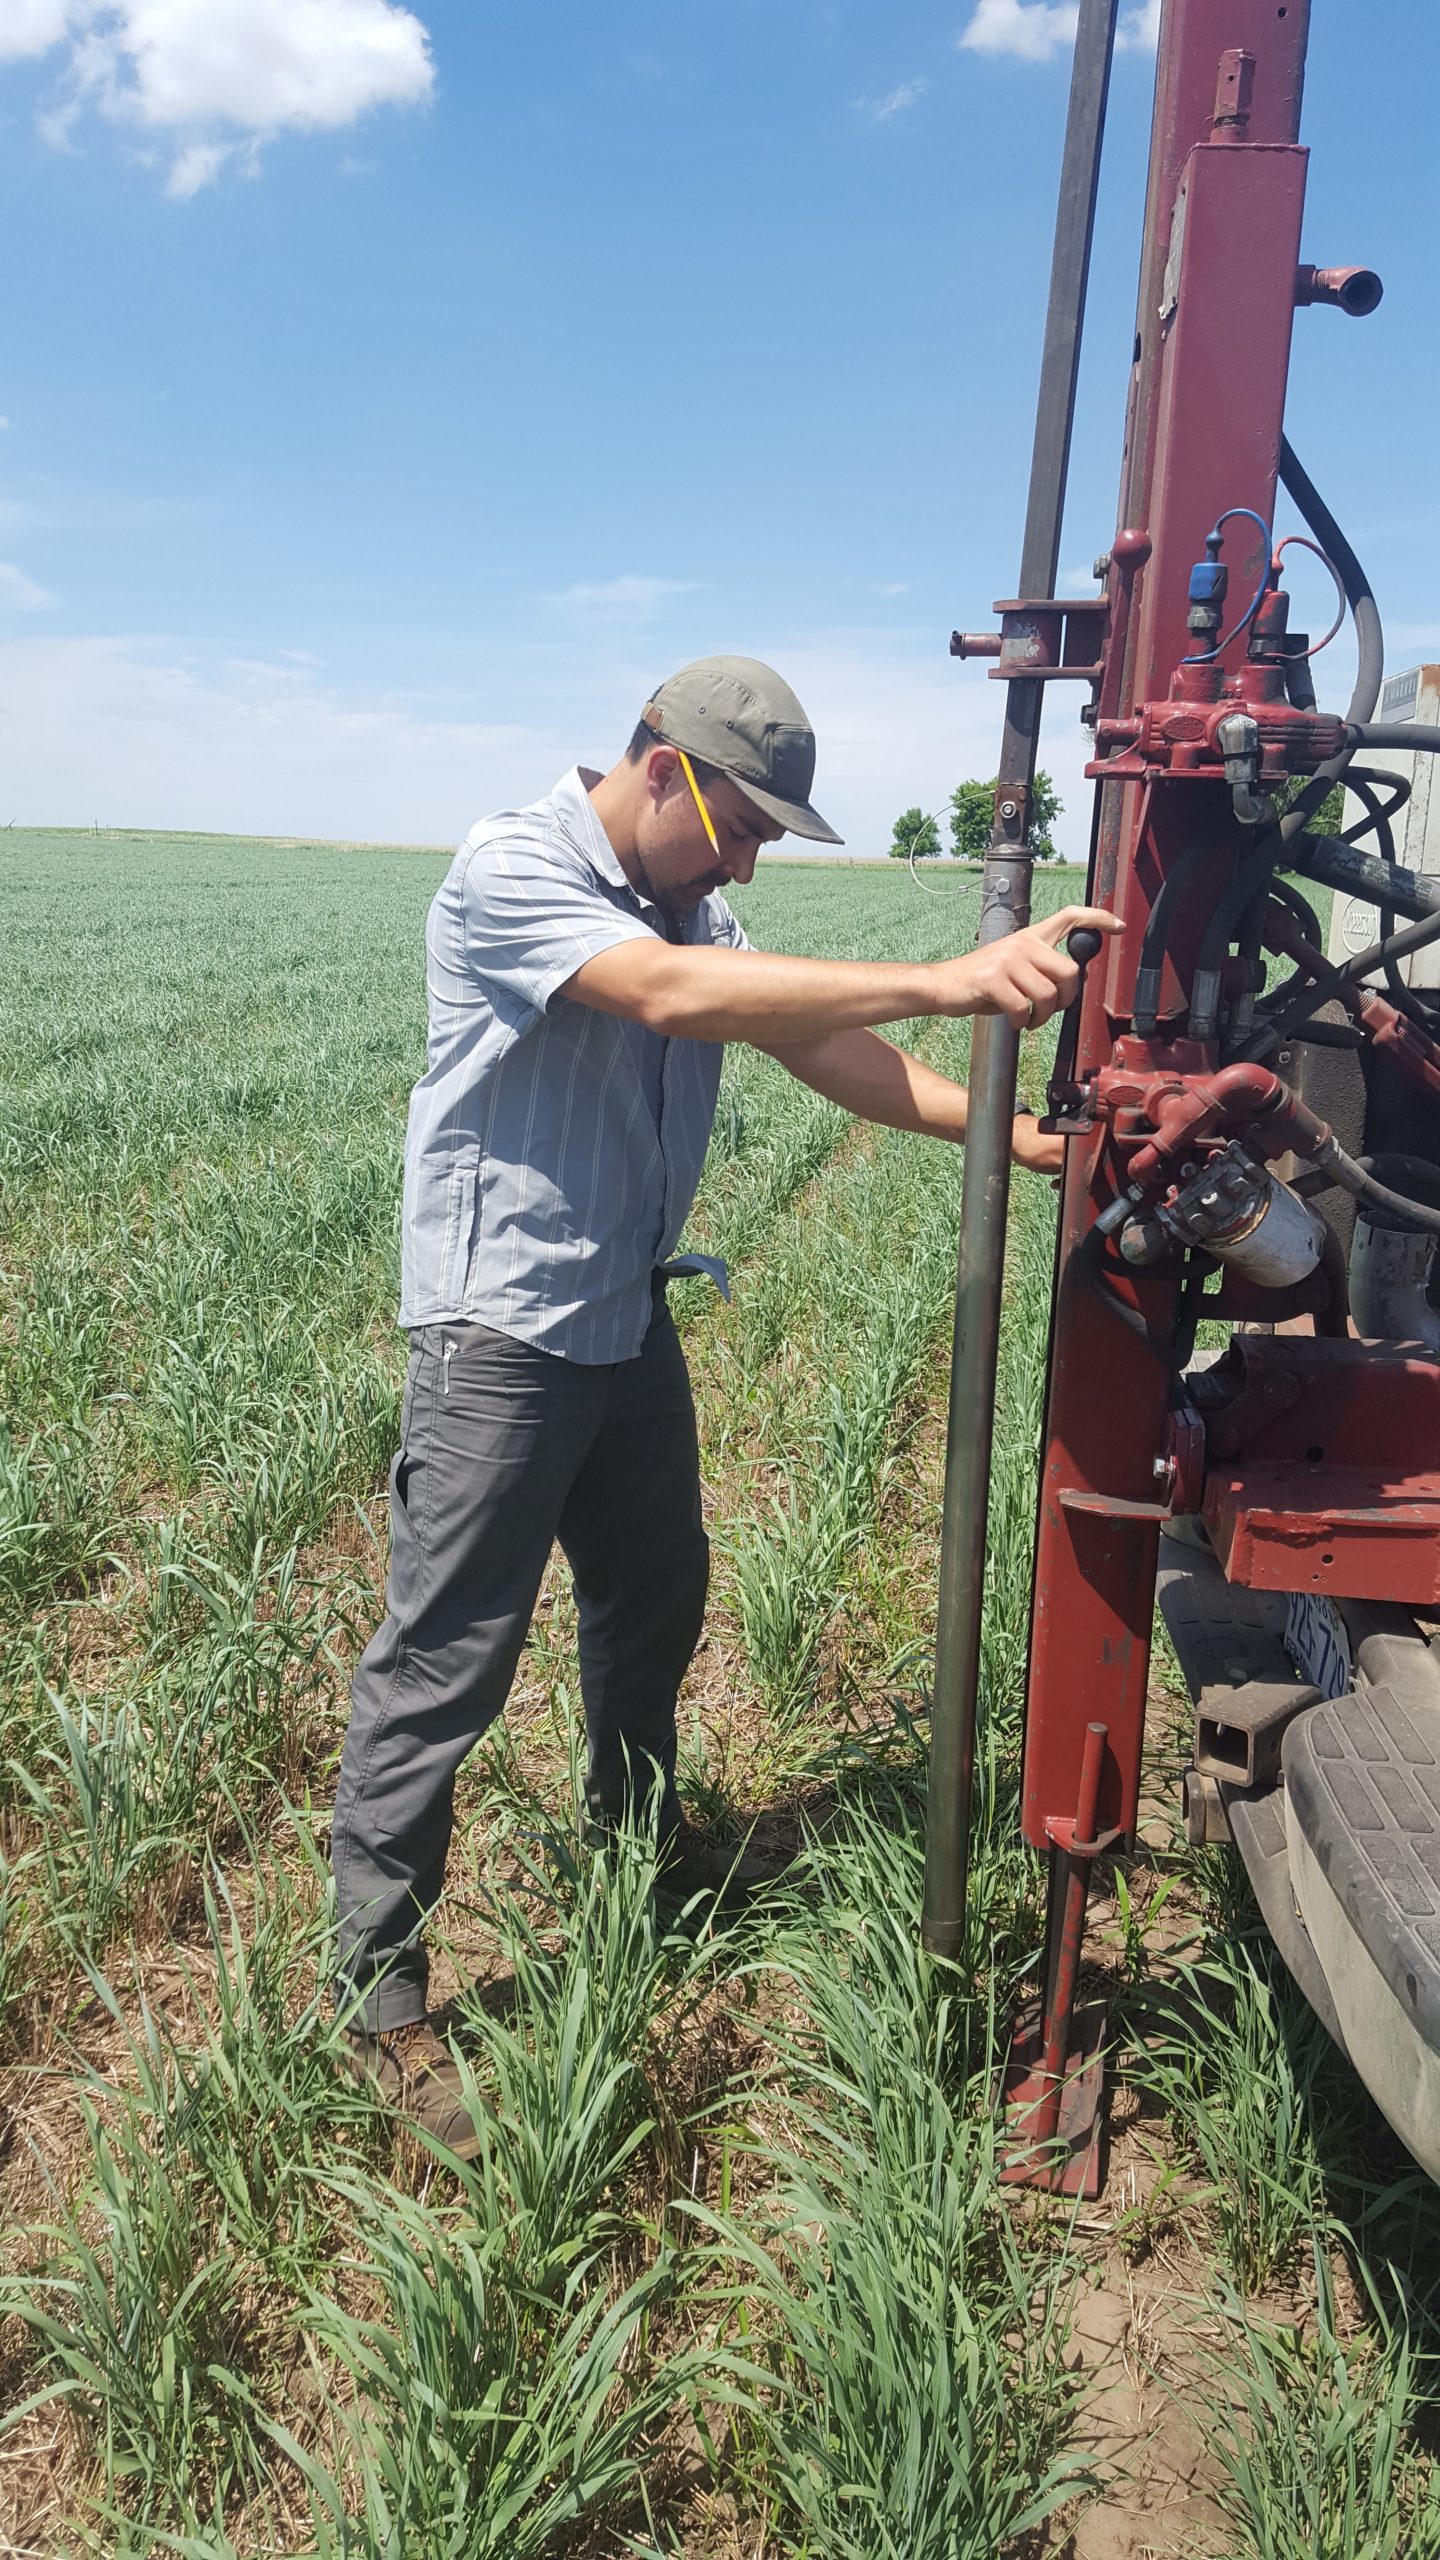
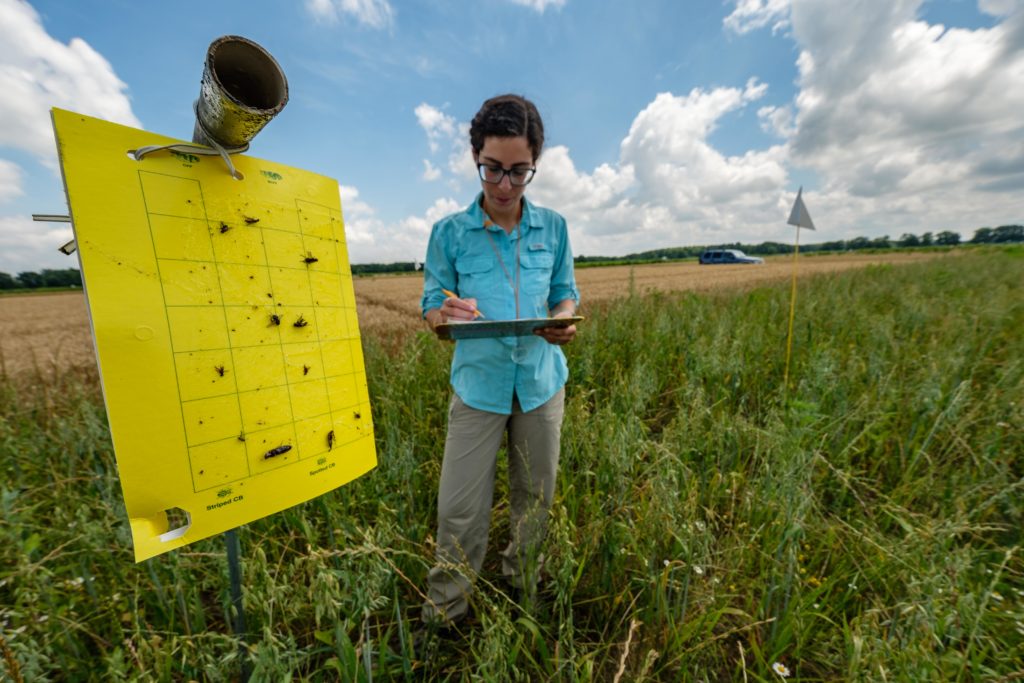
Many farmers are concerned with growing our food while still protecting habitat for butterflies and other species. They want to know – how can we grow food for ourselves while still growing flowers for butterflies? A group of scientists in Michigan is working with farmers to think of solutions. The team is made of people from many different backgrounds and work experiences. The members of the team change over time, but typically 8 scientists are working together at a time. They all come together to brainstorm and do their research at the Kellogg Biological Station in Michigan.
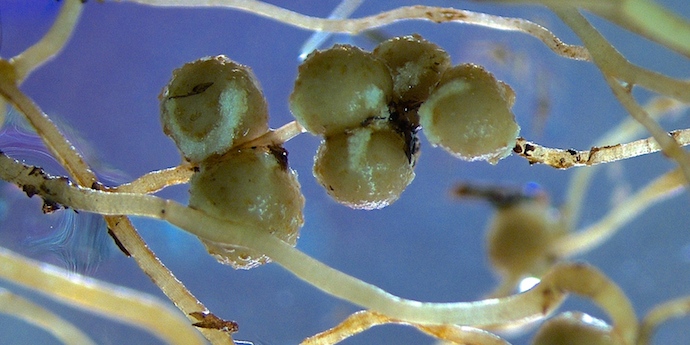
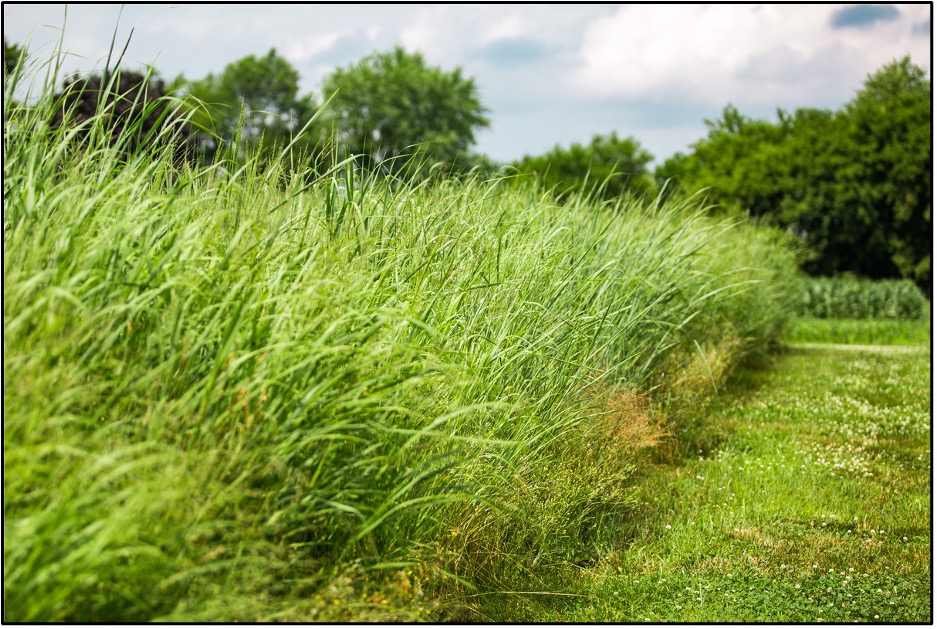
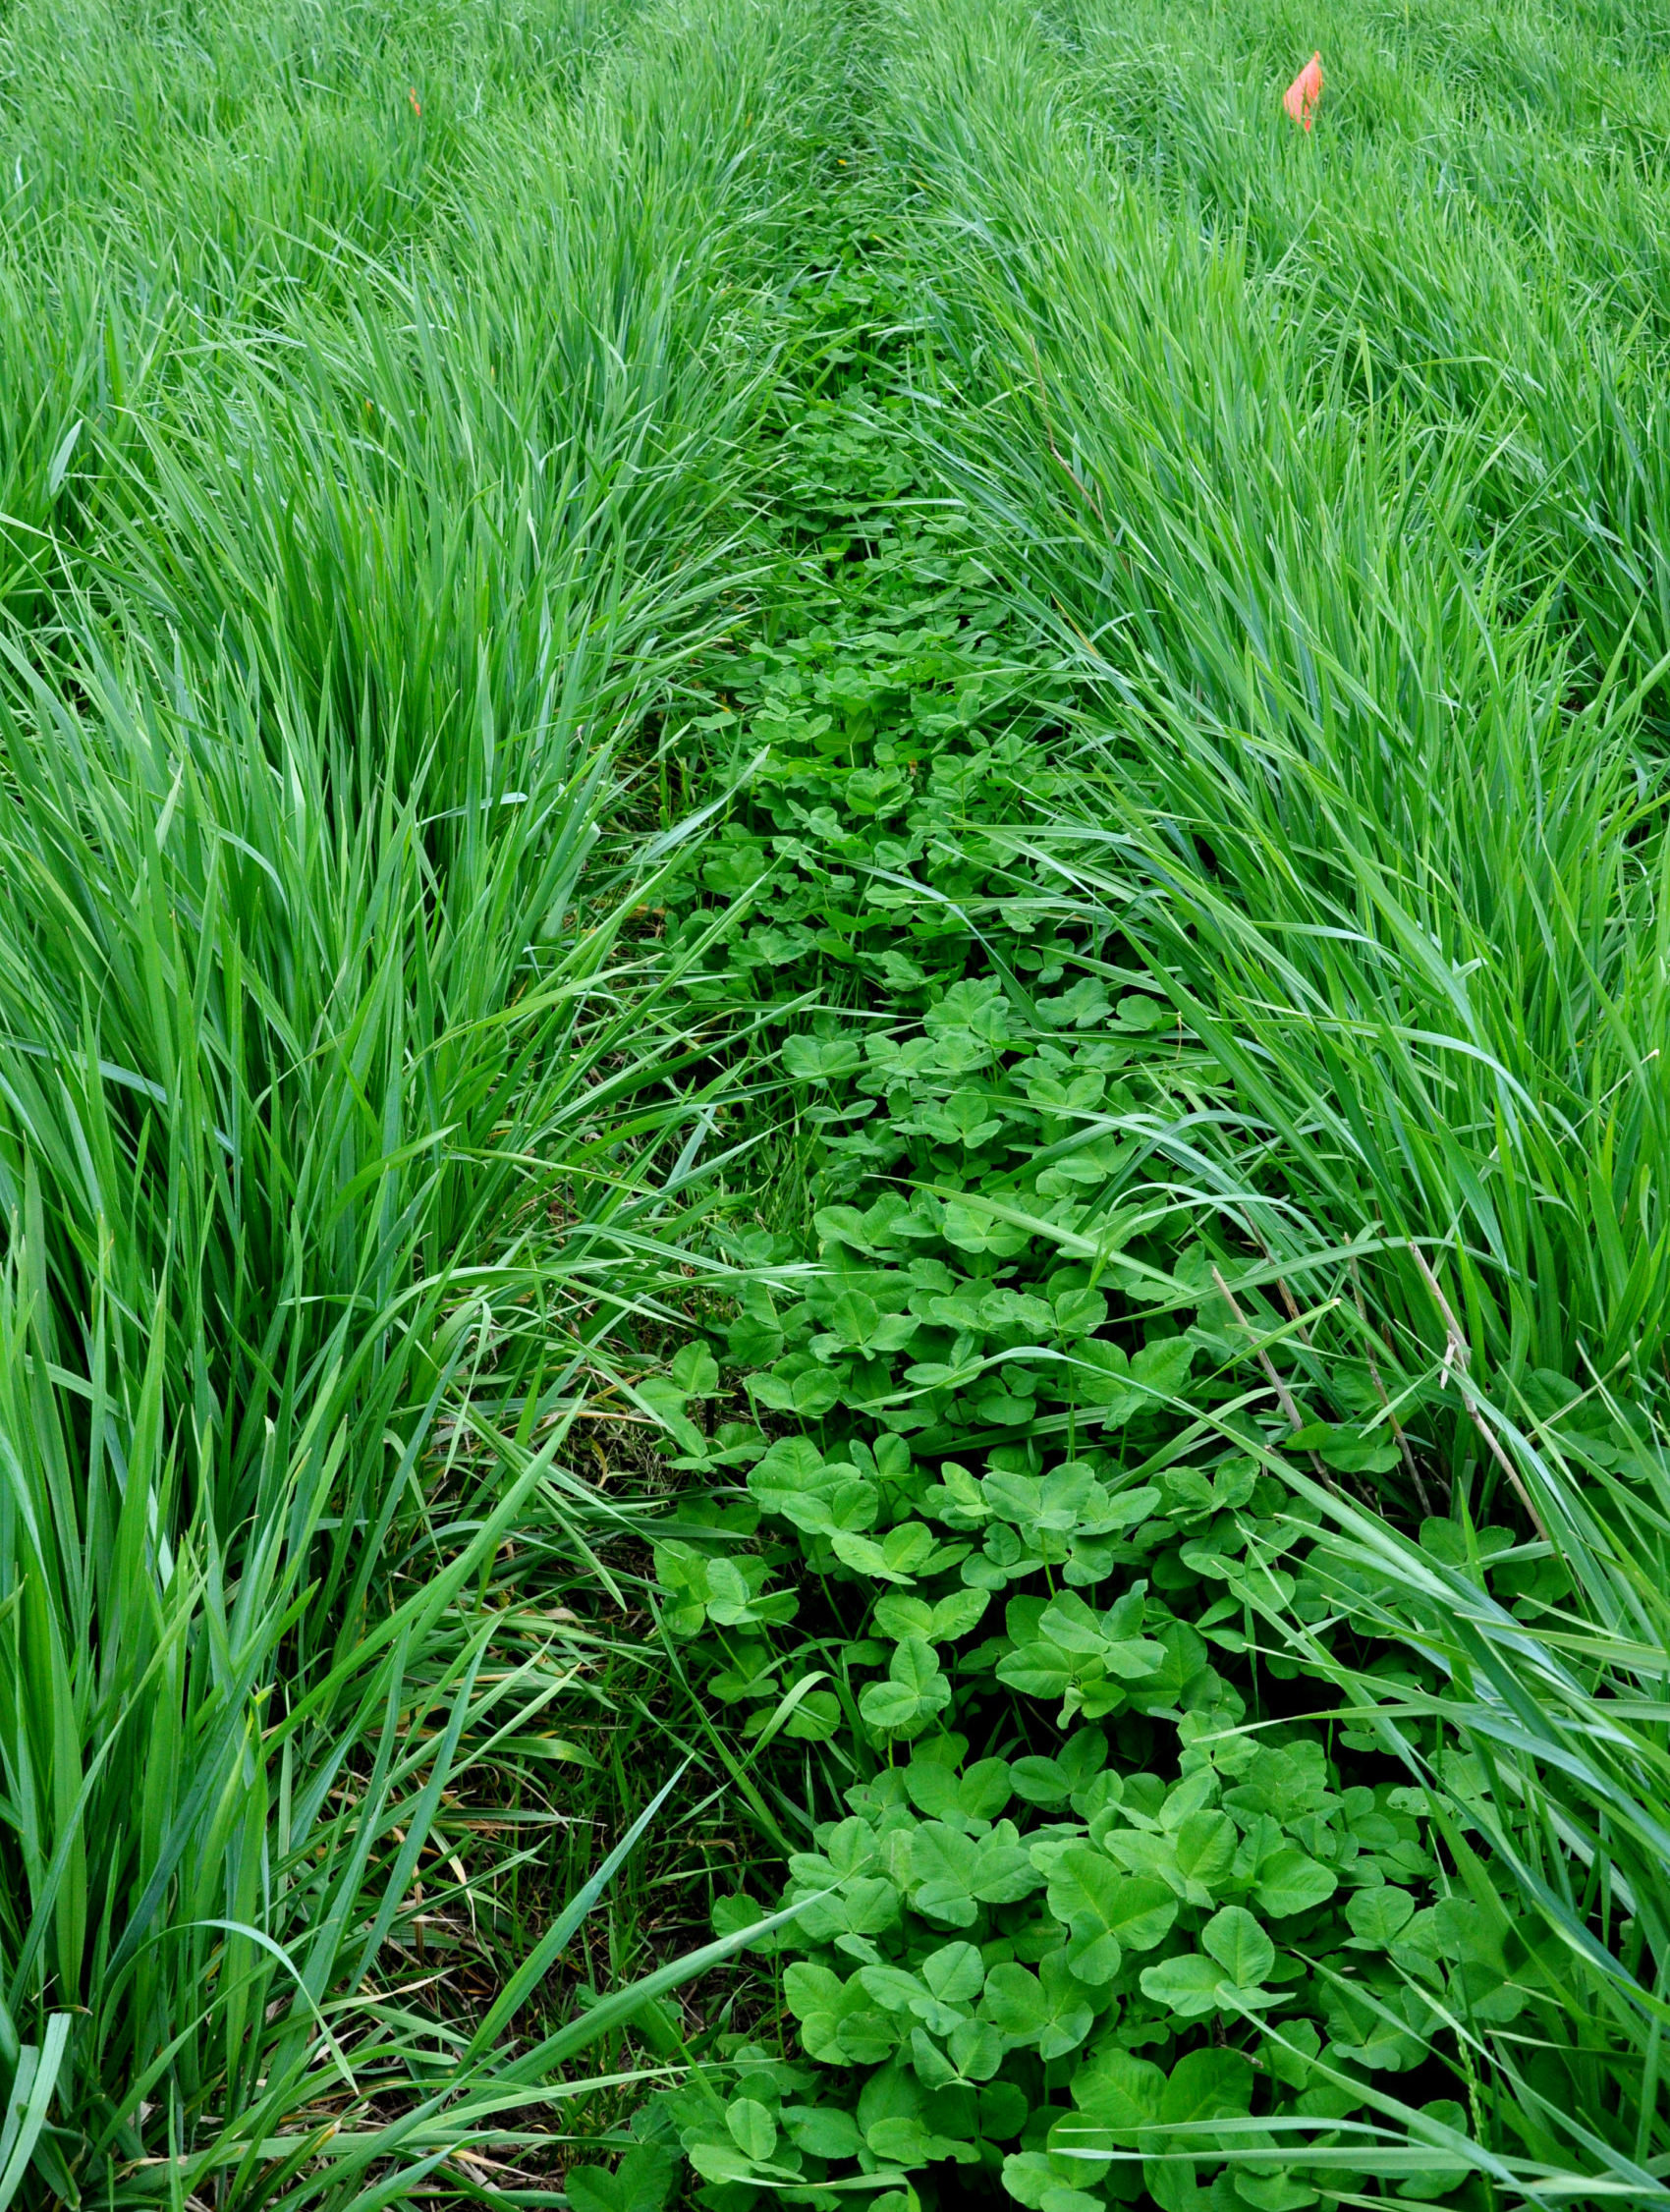
Prairie strips are a new idea that might help both farmers and the environment. These strips are small areas of prairie that can be added to farm fields. They look like rows of flowers and grasses within a field. They create habitat for many species, like butterflies, birds, ants, and even microscopic fungi and bacteria! Prairie strips may also help our food grow better by providing habitat for pollinators.
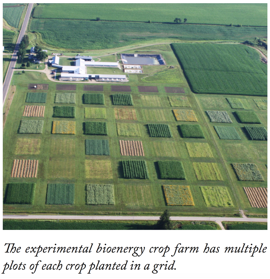
To figure out if prairie strips are able to draw in butterflies, the research team needed to collect data. They visited a large experiment that had many different kinds of farm fields. Some of the fields had prairie strips, while others did not. They thought prairie strips would help butterflies by adding habitat for them in farm fields that usually don’t have many flowers. They predicted they would see more butterflies in fields that have prairie strips and fewer in fields without these strips.
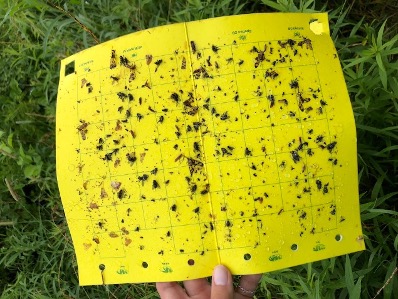
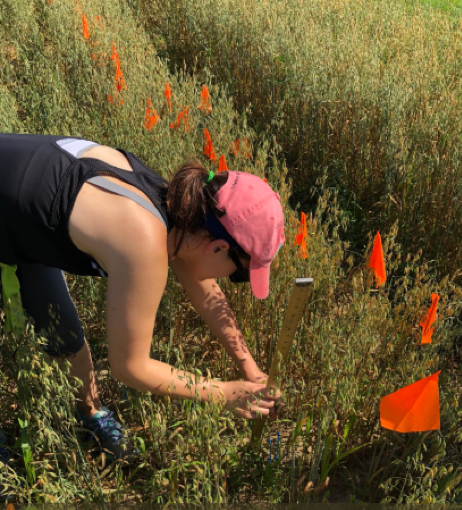
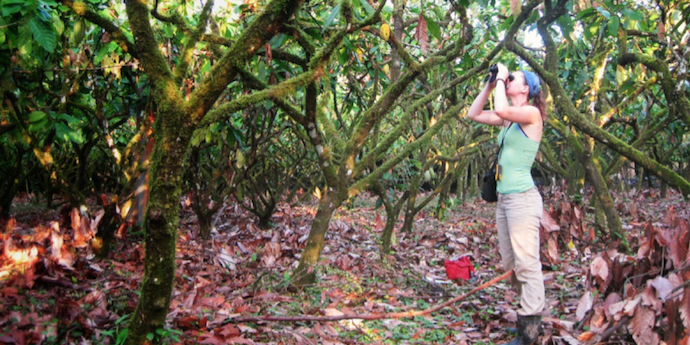
To count the butterflies in each type of field, the team went out on sunny spring and summer mornings when butterflies were flying around and eating nectar. They walked along the same paths in the same fields at the same time every week. Each time, they counted all the butterflies they saw within 5 meters. Each walk was 12 minutes long and followed a 150-meter path. They did these counts in 6 farm fields without prairie strips and 6 farm fields with prairie strips. The team counted butterflies like this 20 times over the summer. At the end of the summer, they added up all of the butterflies observed in each field. This number is called butterfly abundance.
Featured scientists: The Haddad Lab from Kellogg Biological Station Long Term Ecological Research Program – KBS LTER
Flesch–Kincaid Reading Grade Level = 7.3


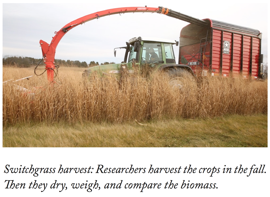
 This Data Nugget was adapted from a data analysis activity developed by the Great Lakes Bioenergy Research Center (GLBRC). For a more detailed version of this lesson plan, including a supplemental reading, biomass harvest video and extension activities,
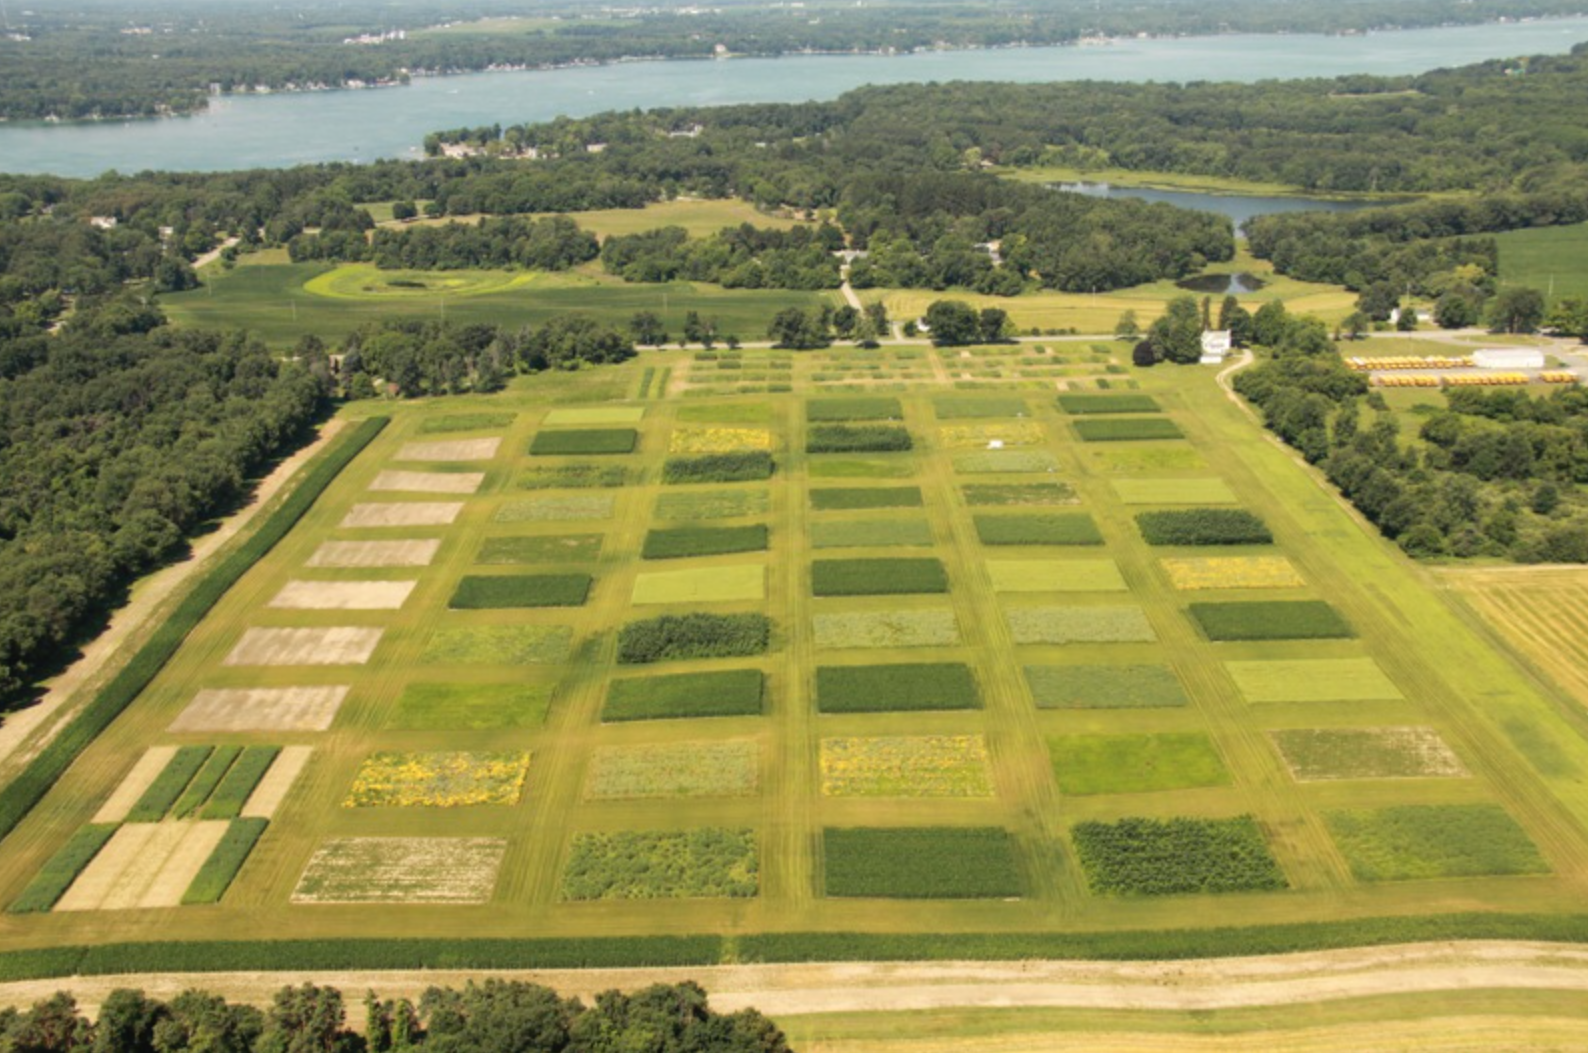
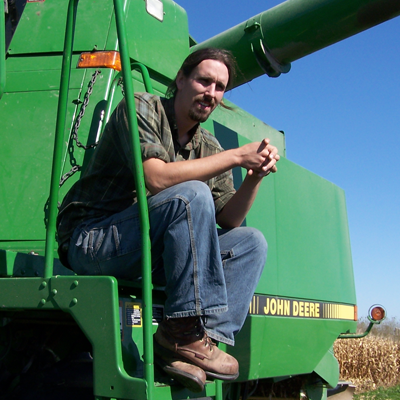
 About Skye: As a child Skye was always asking why; questioning the behavior, characteristics, and interactions of plants and animals around her. She spent her childhood reconstructing deer skeletons to understand how bones and joints functioned and creating endless mini-ecosystems in plastic bottles to watch how they changed over time. This love of discovery, observation, questioning, and experimentation led her to many technician jobs, independent research projects, and graduate research study at Purdue University. At Purdue she studies the factors influencing oak regeneration after ecologically based timber harvest and prescribed fire. While Skye’s primary focus is ecological research, she loves getting to leave the lab and bring science into classrooms to inspire the next generation of young scientists and encourage all students to be always asking why!