Eavesdropping on the ocean

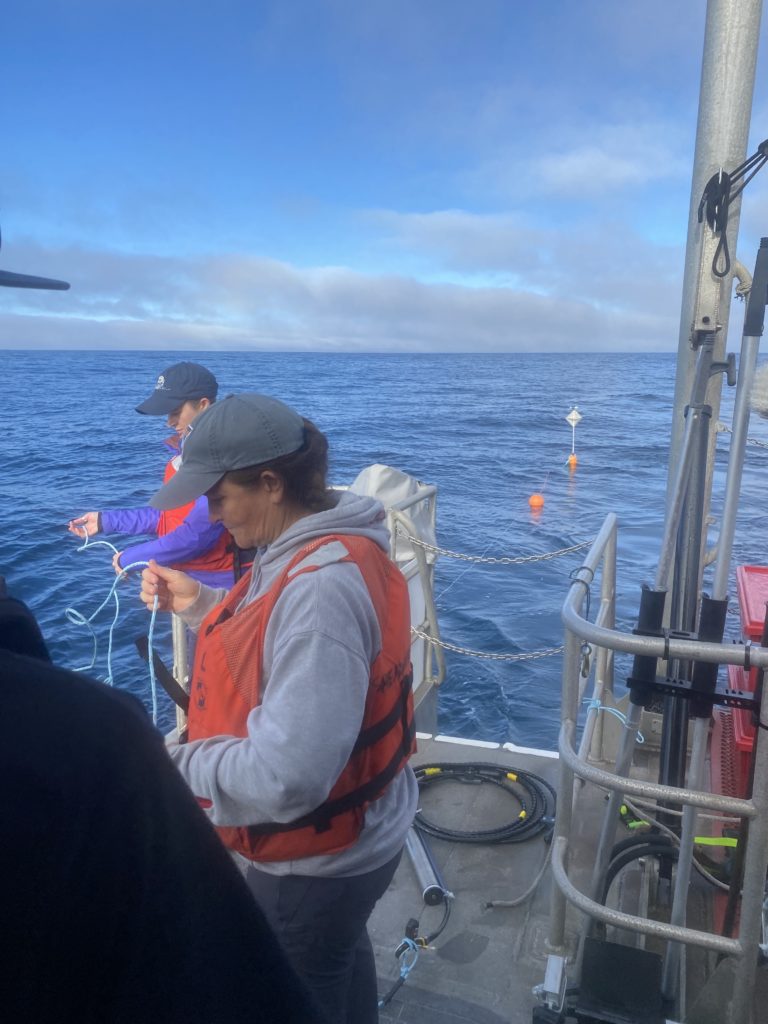
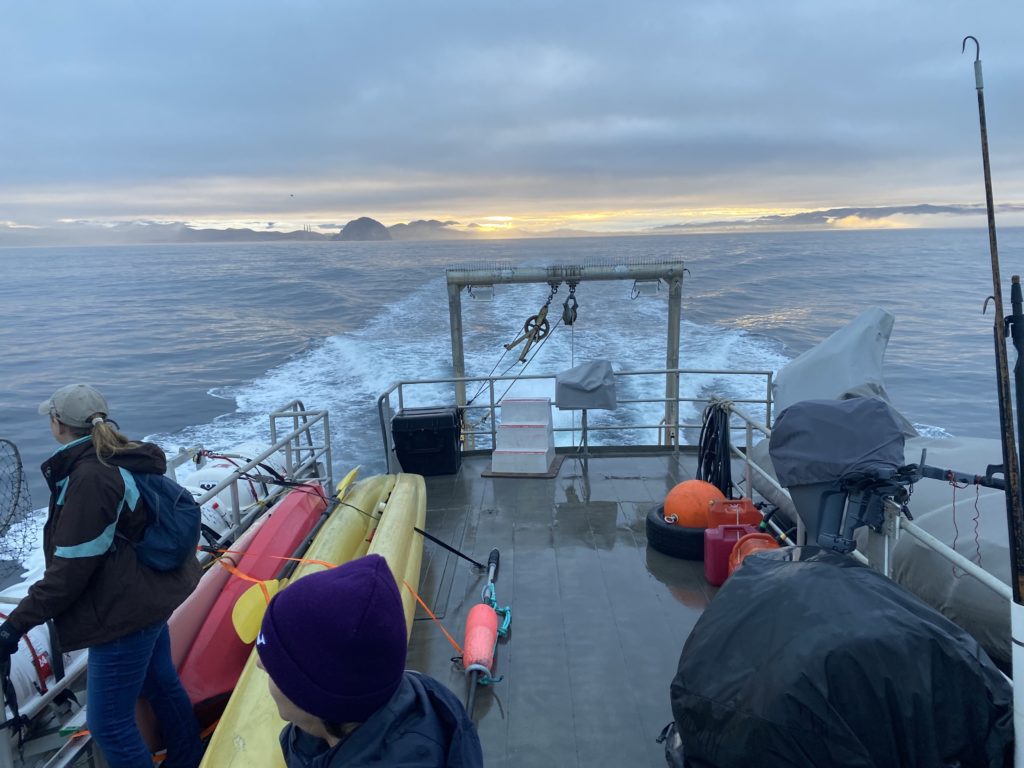
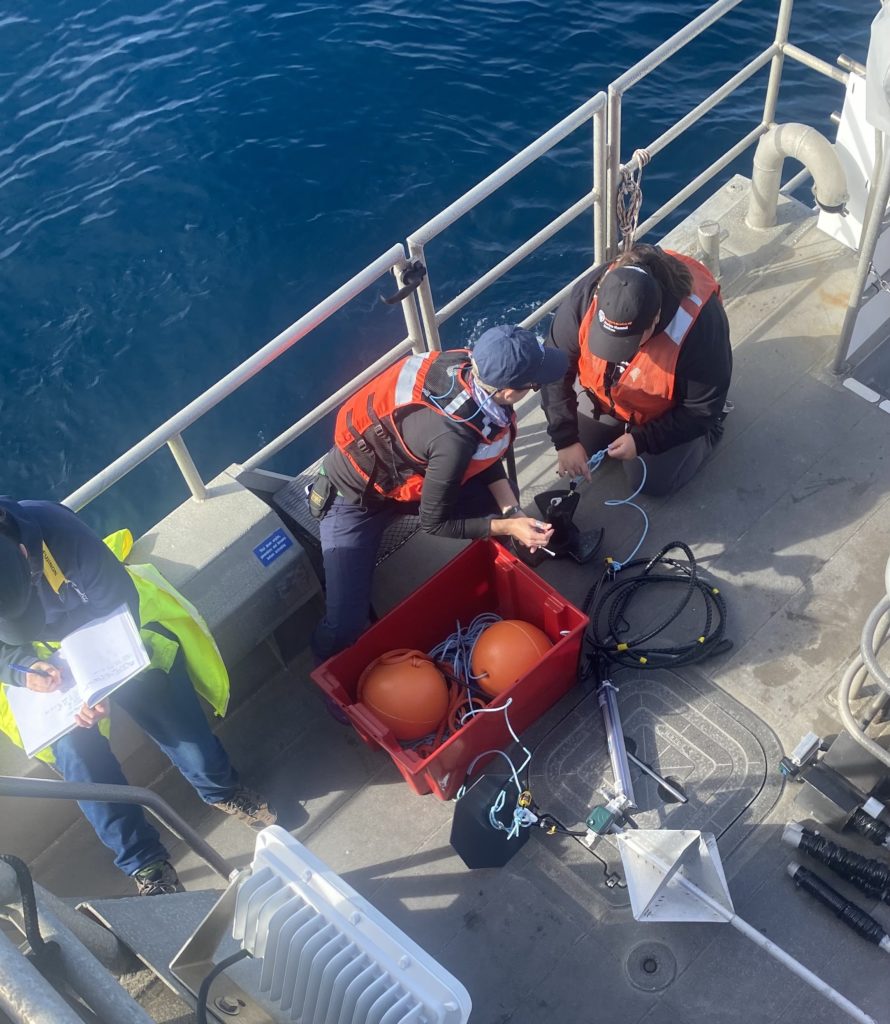
Scientists heading out to the proposed wind energy site.

The activities are as follows:

Most of our energy in the United States comes from fossil fuels like natural gas, coal, and oil. These energy sources are efficient, but they release greenhouse gases into the atmosphere when burned. They are also non-renewable, meaning there is a limited supply. Renewable energy options collect energy from sources that are naturally replenished, such as sunshine, wind, and even ocean waves. By using renewable energy sources, we can fuel our lives without depleting fossil fuel supplies.

Windmills have been used by humans to capture energy from the wind long before electricity was discovered. Historically, they were used to pump water and grind grains to make flour. Today, they are used to generate electricity that can be used in your home. Most of these modern windmills (also known as turbines) are located on land, but researchers and engineers are exploring a new type of site – the ocean.

Offshore wind energy sites in the U.S. are usually at least 20 miles from land. Winds that blow over the ocean are much more consistent than on land, making offshore energy more reliable. In addition, land that can be used for windmills is limited, especially in areas where there are already a lot of people. Offshore wind energy could be a solution where there are a lot of people living along the coast.

Scientists attach a weight to the line and wait to get into position to deploy a drifting recorder

Careful planning goes into these large-scale projects. Before any construction begins, scientists want to make sure the benefits outweigh the costs. One topic of concern is marine mammals. Many marine mammals, like whales, are federally protected, and some are endangered species. Scientists are worried that the construction of offshore windmills could impact the whales that live or migrate through the designated wind energy areas.

Whales use sound transmitted through the water to survive. Just like many animals on land, they use sound to communicate, navigate, find food, and avoid predators or other threats. Noise from construction activities could cause whales to avoid the area. They may need to find a new area to find food, rest, or find mates. Whales typically migrate, so loud noises could also interfere with their migration route.

Shannon is an acoustic ecologist, meaning she uses sound and how it is transmitted to learn more about organisms and their environment. She works with Desray, who is a research biologist specializing in marine mammals. Together, they are leading a large project to collect sound data to assess the risks of a proposed offshore wind energy site off the coast of central California. One specific goal they have is to see whether it is possible to identify the best time of year to build the wind energy platforms with the least disturbance to marine mammals. To do this, they had to learn more about when whales are using and traveling through the area of the proposed site.

Acoustic ecology is a way to learn more about whales and their behavior through sound, which is important because visual detections are limited and take a lot of time out at sea. Instead, scientists can analyze acoustic data to detect which species are present. Each species makes different sounds with unique patterns, and by listening, we can identify which species are in the area. 

Shannon Rankin and Anne Simonis let out the line with the acoustic recorder and surface floats.

Shannon and a large team of supporting scientists worked together to design floating acoustic recorders. They partnered with Desray to deploy them in the proposed offshore wind energy area. Once the recorders are launched, the team uses satellite location to follow the movement of the recorders from shore. They let the recorders drift in the open ocean for several days before they board a large research boat and pick them up again. While the recorders are drifting, they are continuously recording the ocean sounds below. These drifting recorders cover a larger spatial area, for a longer time, than other types of passive acoustic monitoring methods. The team launched the acoustic recorders in different seasons to learn which whale species are using the proposed site throughout the year and to assess what time of year would have the lowest whale presence near the construction site.

Featured scientists: Shannon Rankin from the NOAA Southwest Acoustic Ecology Lab and Desray Reeb from the Bureau of Ocean Energy Management

Flesch–Kincaid Reading Grade Level 9.4

Additional teacher resources related to this Data Nugget:

  • The NOAA team members on this project have put together a blog series, called “Sound Bytes,” to share the stories and impacts of the ADRIFT research highlighted in this activity. This blog series features many perspectives showcasing how underwater sound, in the form of acoustic data, can be used to learn more about marine mammals.
  • Students can learn more about how acoustic data is analyzed and what it looks like visually by checking out the Ocean Voices project on Zooniverse. Here they can participate in a guided introduction to humpback whale and ship sounds from drifting acoustic recorders and help scientists classify sounds on the recordings.
  • These data were collected as part of the ADRIFT project, led by the Southwest Acoustic Ecology Lab run by the National Oceanic and Atmospheric Administration and the Bureau of Ocean Energy Management.
  • NOAA has a wide variety of lesson plans that you could use to supplement this activity. Here is a set of activities for elementary, middle, and high school on bioacoustics.
  • Lesson on bioacoustics by Seagrant and Woods Hole Oceanographic Institute.
  • For more lessons and activities about wind energy, check out the K-12 teaching materials by the Office of Energy and Renewable Energy.
  • A collection of videos that show the spectrograms and audio recordings for various marine mammals that you could share with students.
  • There is an extensive PowerPoint that has additional information about the ADRIFT acoustics project and other research being done.
Video of a drifting acoustic recorder launch. Turn on subtitles for information about the process.

This study was funded in part by the U.S. Department of the Interior, Bureau of Ocean Energy Management through Interagency Agreement M20PG00013 with the U.S. Department of Commerce, National Oceanic and Atmospheric Administration, National Marine Fisheries Service (NMFS), Southwest Fisheries Science Center (SWFSC).
Lake Superior Rhythms

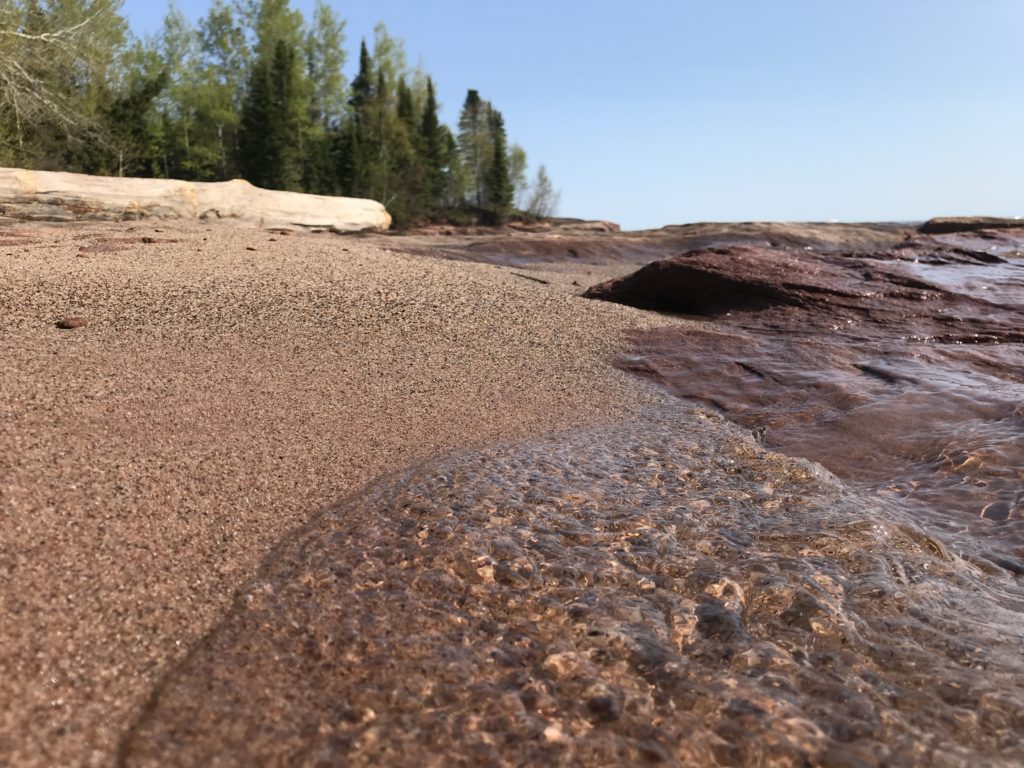
A sandy Lake Superior shoreline near Bayfield, WI.

The activities are as follows:

Gena and Ali are sisters who grew up in Bayfield, Wisconsin on the south shore of Lake Superior. When they were young, they spent many summer days sailing in the Apostle Islands National Lakeshore with their parents and friends. As they relaxed on the beach, they would watch how the lake changed. Even over a short period of time, they would see the landscape change. In just a few hours, a rock that was visible above the water’s surface when they arrived would slowly become submerged, only to reappear several hours later.

In high school, Gena and Ali set out to learn about the geophysical forces acting on Lake Superior. They wanted to investigate why they would sometimes see such dramatic fluctuations in water levels. They also wanted to know why water from rivers and streams would sometimes flow out into the lake, while other times it would flow back into the tributaries.

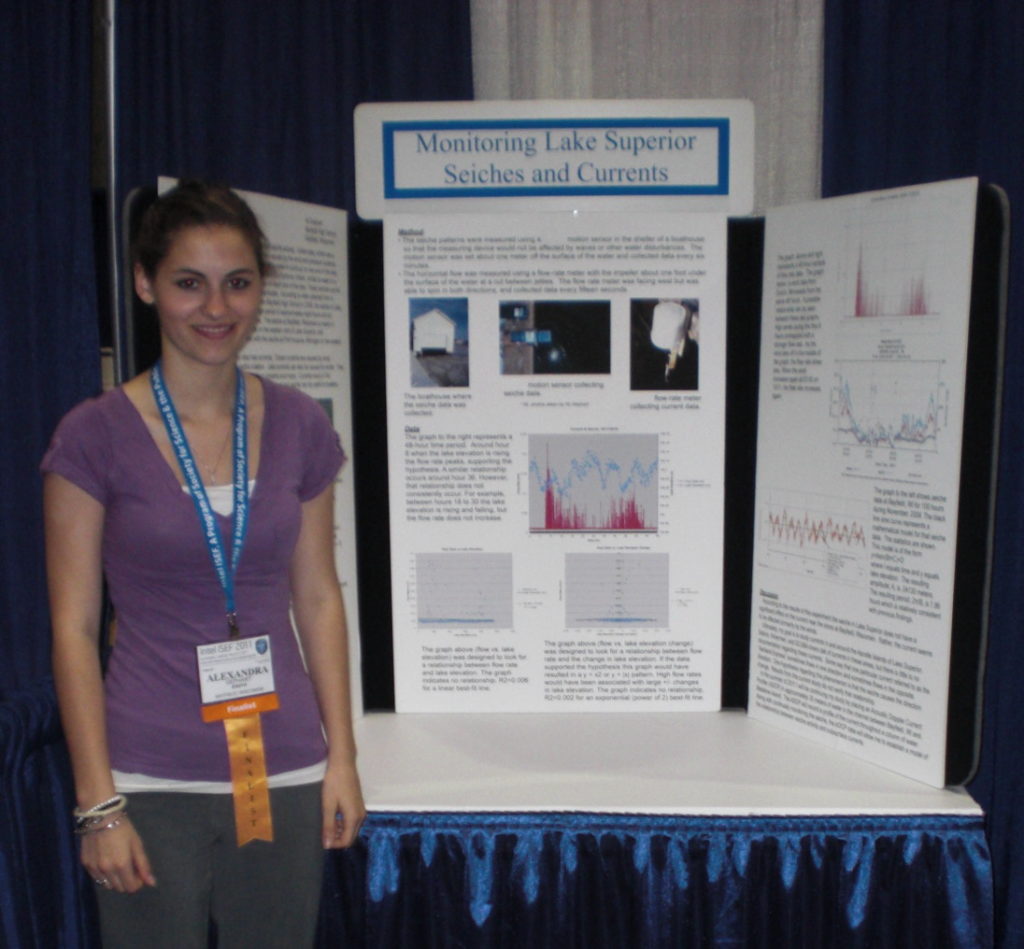
Ali presents research results on how the seiche changes the local water levels.

They learned that large lakes exhibit a phenomenon called a seiche (pronounced saysh). Like tides, a seiche is a periodic rising and falling of water levels. However, tides and seiches are caused by two different forces. Whereas tides are connected to the sun and moon, seiches are caused by changes in atmospheric pressure and strong winds.

Many atmospheric events can exert force on the water, including storms that come and go, heavy rain, cold fronts blowing through, or the calming of strong winds. You can think of Lake Superior as a giant bathtub, and the seiche is the water sloshing back and forth as it is pushed by a force and then released.

Gena and Ali realized that the seiche probably explained the water level changes they saw on Lake Superior. They became curious to learn more about the lake’s seiche pattern. An atmospheric event can cause the water to slosh from one side of the lake to the other several times. They predicted the seiche would look like a wave pattern as the water comes and goes.

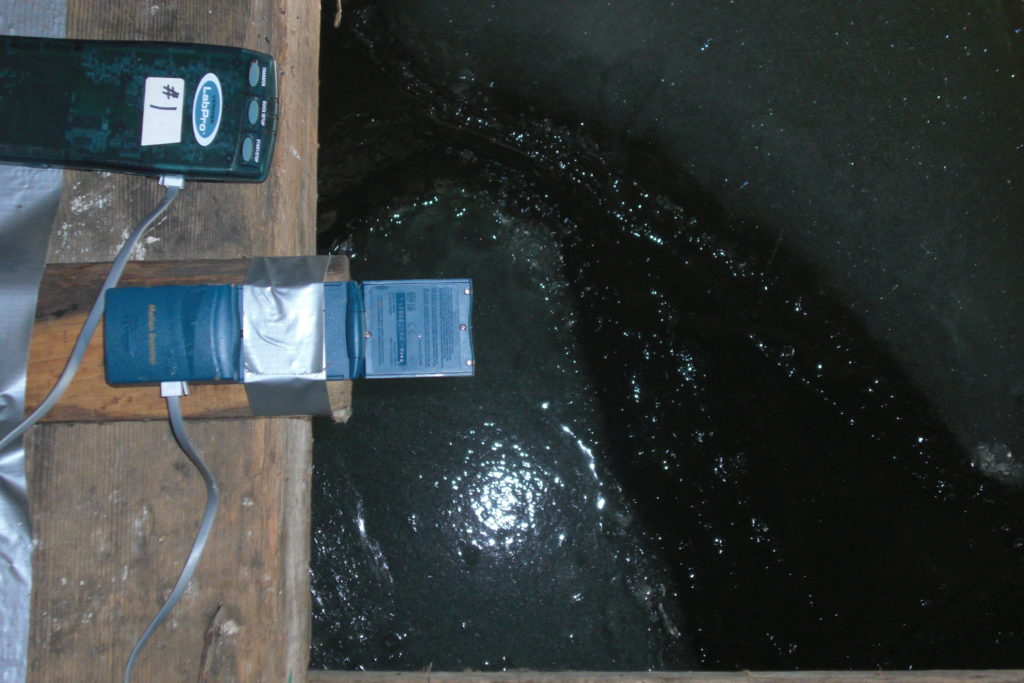
The sensor with data recorder on the dock inside a boathouse.

To test their ideas, they decided to investigate how often the water switched directions and how much the water level changed because of the seiche. In other words, they wanted to measure the amplitude and period of the seiche. The amplitude is the height of a wave from its midpoint, or equilibrium. The amplitude can be calculated as half of the water level change from its highest and lowest point in a cycle. The length of time it takes to complete one full back-and-forth cycle is called the period. You can track the period of the seiche by how much time has passed from one peak to the next peak.

Over their summer break, Gena and Ali started to plan how they could document changes in water levels in their hometown. With permission, Gena and Ali placed a sensor inside a boathouse that was protected from wave action. The sensor measured the distance to the nearest object and was set to collect a data point every six minutes. Gena and Ali placed the sensor so that it faced the surface of the water. That way, it would document changes in the water level throughout time.

Featured scientists: Gena (she/her) and Ali Gephart (she/her), Bayfield High School.

Written by: Richard Erickson, Bayfield High School, and Hannah Erickson, Boston Public Schools.

Flesch–Kincaid Reading Grade Level = 8.8

Additional teacher resources related to this Data Nugget include:

  • Here is a link to learn more about the physics of waves.
  • Visit this NOAA website to learn more about seiche behavior and characteristics.

Sticky situations: big and small animals with sticky feet

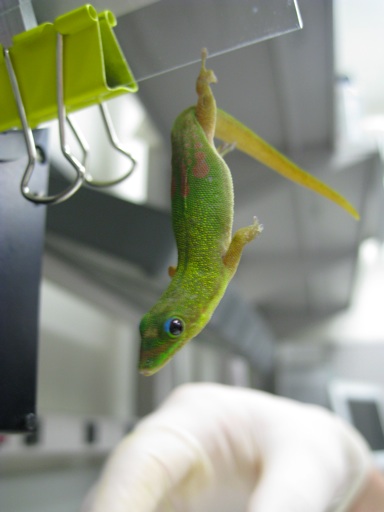
Travis in the lab measuring the stickiness of a gecko’s toe.

Travis in the lab measuring the stickiness of a gecko’s toe.

The activities are as follows:

Species are able to do so many amazing things, from birds soaring in the air, lizards hanging upside-down from ceilings, and trees growing hundreds of feet tall. The study of biomechanics looks at living things from an engineering point of view to study these amazing abilities and discover why species come in such a huge variety of shapes and sizes. Biomechanics can improve our understanding of how plants and animals have adapted to their environments. We can also take what we learn from biology and apply it to our own inventions in a process called biomimicry. Using this approach, scientists have built robotic jellyfish to survey the oceans, walking robots to help transport goods, and fabrics that repel stains like water rolling off a lotus leaf.

Travis studies biomechanics and is interested in the ability of some species to climb and stick to walls. Sticky, or adhesive, toe pads have evolved in many different kinds of animals, including insects, arachnids, reptiles, amphibians, and mammals. Some animals, like frogs, bats, and bugs use suction cups to hold up their weight. Others, like geckos, beetles, and spiders have toe pads covered in tiny, branched hairs. These hairs actually adhere to the wall! Electrons in the molecules that make up the hairs interact with electrons in the molecules of the surface they’re climbing on, creating a weak and temporary attraction between the hairs and the surface. These weak attractions are called van der Waals forces.

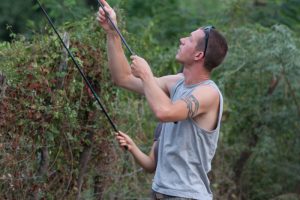
Travis catching lizards in the Dominican Republic.

Travis catching lizards in the Dominican Republic.

The heavier the animal, the more adhesion they will need to stick and support their mass. With a larger toe surface area, more hairs can come in contact with the climbing surface, or the bigger the suction cup can be. For tiny species like mites and flies, tiny toes can do the job. Each fly toe only has to be able to support a small amount of weight. But when looking at larger animals like geckos, their increased weight means they need much larger toe pads to support them.

When comparing large and small objects, the mass of large objects grows much faster then their surface area does. As a result, larger species have to support more mass per amount of toe area and likely need to have non-proportionally larger toes than those needed by lighter species. This results in geckos having some crazy looking feet! This relationship between mass and surface area led Travis to hypothesize that larger species have evolved non-proportionally larger toe pads, which would allow them to support their weight and stick to surfaces.

To investigate this idea, Travis looked at the data published in a paper by David Labonte and fellow scientists. In their paper they measured toe pad surface area and mass of individual animals from 17 orders (225 species) including insects, arachnids, reptiles, amphibians, and mammals. From their data, Travis calculated the average toe pad area and mass for each order.

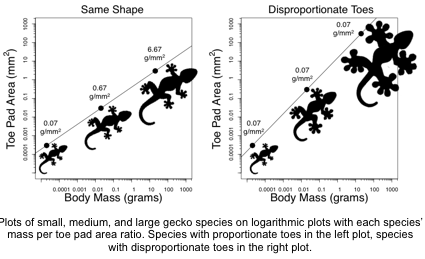
Travis then plotted each order’s mass and toe pad area on logarithmic axes so it is easier to compare very small and very large values. Unlike a standard axis where the amount represented between tick marks is always the same, on logarithmic axes each tick mark increases by 10 times the previous value. For example, if the first tick represents 1.0, the second tick will be 10, and the next 100. As an example, look at the graphs below.

gecko-graph

The left plot shows hypothetical gecko species of different sizes, but with proportional toes. Their mass per toe pad area ratio (g/mm2) varies, with larger species having larger g/mm2 ratios. In this case, larger species have to support more mass per toe pad area. In the right plot, larger gecko species have disproportionally larger toes. These differences change each species’ mass per toe pad area ratios, so that all species, regardless of their size, have the same mass per toe pad area ratio.

Featured scientists: David Labonte, Christofer J. Clemente, Alex Dittrich, Chi-Yun Kuo, Alfred J. Crosby, Duncan J. Irschick, and Walter Federle. Written by: Travis Hagey

Data Nugget Flesch–Kincaid Reading Grade Level = 10.3

Scaling Up – Math Activity Flesch–Kincaid Reading Grade Level = 9.5

There is a scientific paper associated with the data in this Data Nugget. The data was used with permission from D. Labonte.

Labonte, D., Clemente, C.J., Dittrich, A., Kuo, C.Y., Crosby, A.J., Irschick, D.J. and Federle, W., 2016. Extreme positive allometry of animal adhesive pads and the size limits of adhesion-based climbing. Proceedings of the National Academy of Sciences, p.201519459.

To learn more about Travis and his research on geckos, read this blog post, “An evolving sticky situation” and check out the video below!

poster
Sticky situations video
00:00
--
/
--

For a video and article on using “gecko power” to scale a building, check out this article – Climbing a Glass Building? Try a Gecko’s Sticky Pads


dr-fowleriAbout Travis: Ever since Travis was a kid, he was interested in animals and wanted to be a paleontologist. He even had many dinosaur names memorized to back it up! In college he discovered evolutionary biology, which drove him to apply for graduate school and become a scientist. There, he fell in love with comparative biomechanics, which combines evolutionary biology and mechanical engineering. Today Travis studies geckos and their sticky toes that allow them to scale surfaces like glass windows and tree branches.
SaveSave

SaveSave

SaveSave

SaveSave

SaveSave

SaveSave

The Flight of the Stalk-Eyed Fly

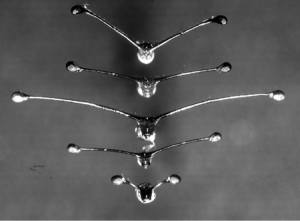
Variation between stalk-eyed fly species in eyestalk length.

Variation between stalk-eyed fly species in eyestalk length.

The activities are as follows:

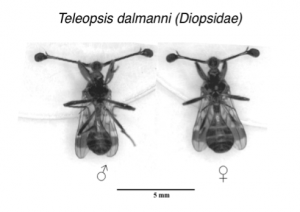
Stalk-eyed flies are insects with eyes located on the ends of long projections on the sides of their head, called eyestalks. Male stalk-eyed flies have longer eyestalks than females, and this plays an important role in the flies’ mating patterns. Female stalk-eyed flies prefer to mate with males with longer eyestalks. In this way, the eyestalks are much like the bright and colorful peacock’s tail. This kind of sexual selection can lead to the evolution of longer and longer eyestalks over generations. But do these long eyestalks come at a cost? For example, longer eyestalks could make it more difficult to turn quickly when flying. As with all flies, stalk-eyed flies do not fly in a straight line all the time, and often zigzag in air. If long eyestalks make quick turns more difficult, we might expect there to be a trade-off between attracting mates and flight.

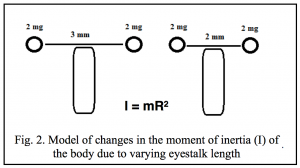
Screen Shot 2015-12-21 at 2.45.44 PMMoment of inertia (I) is defined as an object’s tendency to resist rotation – in other words how difficult it is to make something turn. An object is more difficult to turn (has a higher moment of inertia) when it is more massive, and when it is further from its axis of rotation. Imagine trying to swing around quickly holding a gallon of water – this is difficult because the water has a lot of mass. Now imagine trying to swing around holding a baseball bat with a jug of water attached to the end. This will be even more difficult, because the mass is further away from the axis of rotation (your body). Now lets bring that back to the stalk-eyed fly. The baseball bat now represents the eyestalk of the fly, while the gallon of water represents the eye at the end of the stalk. We can express the relationship between the mass of the object (m = mass of the eye), its distance from the axis of rotation (R = length of eyestalk), and the moment of inertia (I) using the following equation: I = mR2.

Because moment of inertia goes up with the square of the distance from the axis, we might expect that as the length of the flies’ eyestalks goes up, the harder and harder it will be for the fly to maneuver during flight. If this is the case, we would predict that male stalk-eyed flies would make slower turns compared to similar sized female flies with shorter eyestalks.

Differences in male and female eyestalk length.

Differences in male and female eyestalk length.

To address this idea, scientists measured the effect of eyestalk length on the moment of inertia of the body needs. In addition, they measured differences in turning performance during flight. Scientists Gal and John tracked free flight trajectories of female and male stalk-eyed flies in a large flight chamber. Because female and male stalk-eyed flies have large differences in eyestalk length, their flight performance can be compared to determine the effects of eyestalk length on flight. However, other traits may differ between males and females, so body size and wing length measurements were also taken. If increased moment of inertia does limit turning performance as expected, the male flies that have significantly longer eyestalks should demonstrate slower and less tight turns, indicating a decrease in free flight performance. If there is no difference in turning performance between males and females with significantly different eyestalk lengths, then males must have a way to compensate for the higher moment of inertia.

Featured scientists: Gal Ribak from Tel-Aviv University, Israel and John Swallow from University of Colorado, Denver. Written by: Brooke Ravanelli from Denver Public School, Zoё Buck Bracey from BSCS, and John Swallow.

Flesch–Kincaid Reading Grade Level = 9.0

Once your students have completed this Data Nugget, there is an extension lab activity where students can conduct their own experiment testing moment of inertia. Students simulate the flying experience of stalk-eyed flies and go through an obstacle course carrying their eyestalks with them as they maneuver through the cones to the finish line. To access this lab, click here!

Video showing how the long eyestalks of males form!