- Teacher Guide
- Student activity, Graph Type A, Level 3
- Student activity, Graph Type B, Level 3
- Student activity, Graph Type C, Level 3
- PowerPoint of images
- Anne Bronikowski Scientist Profile
- Grading Rubric
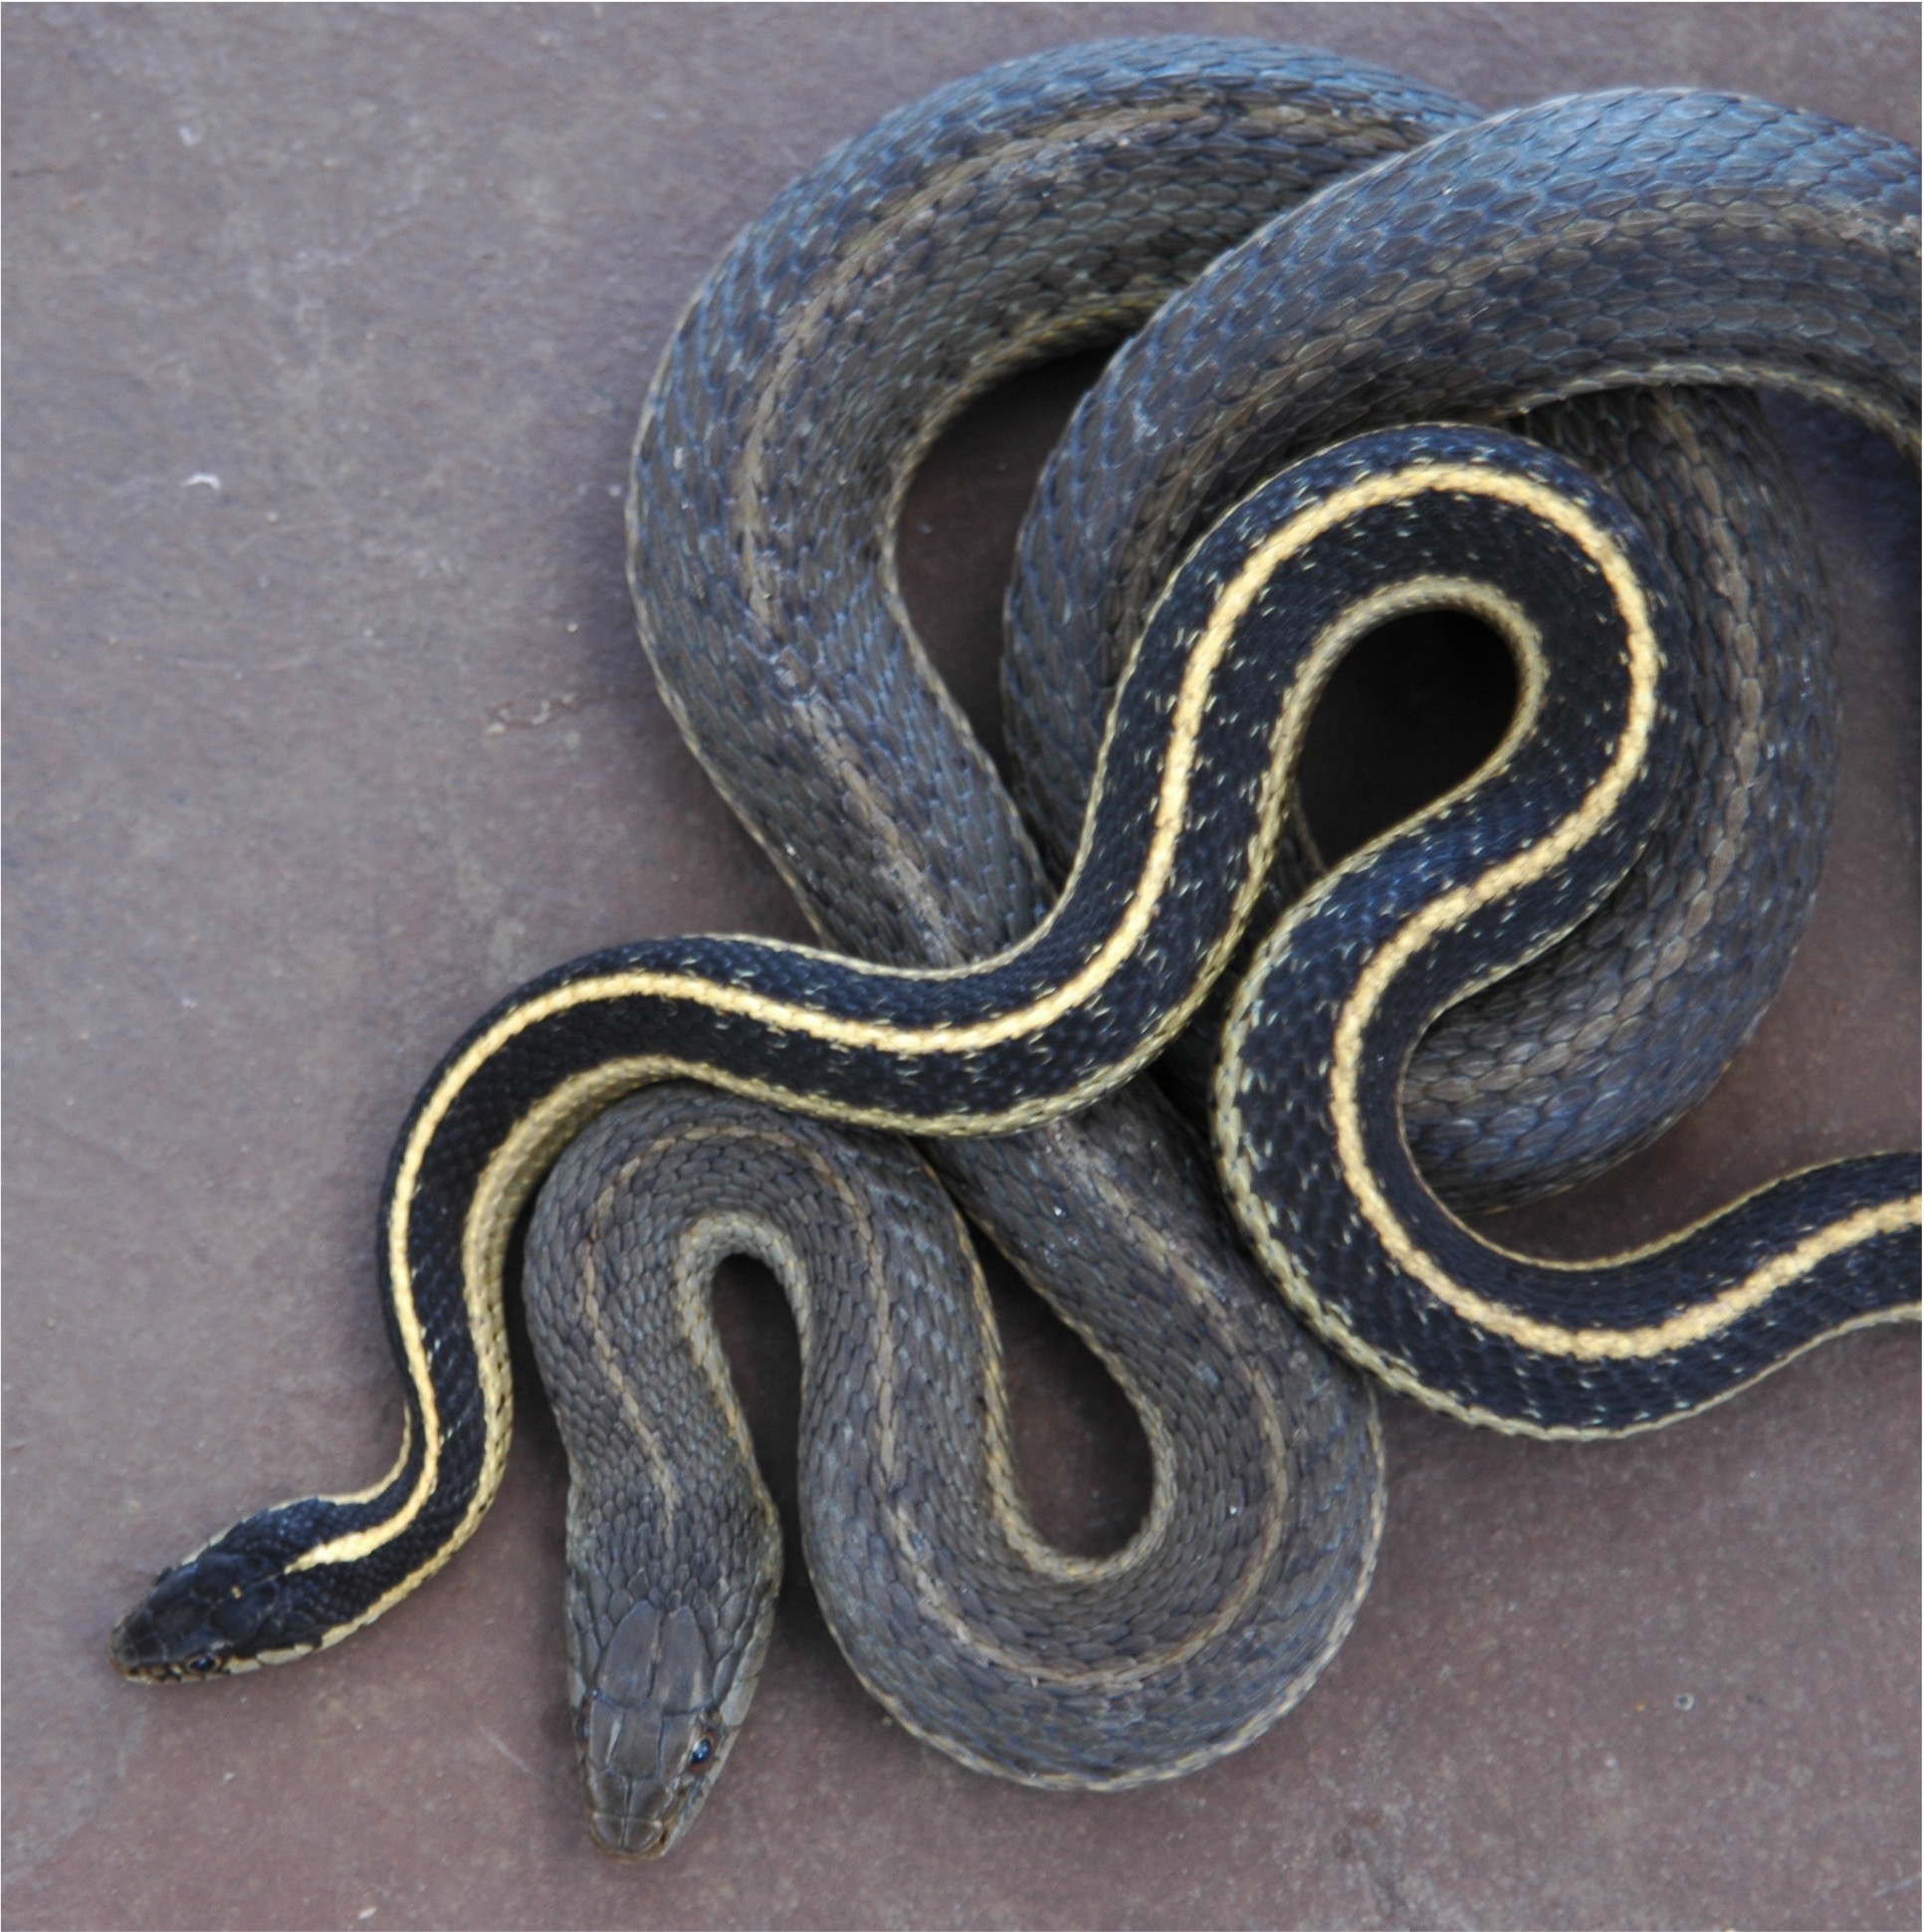
Garter snakes are a common sight across North America, but one small species in Northern California has helped scientists learn a lot about how animals adapt to their environment. Since 1972, a long lineage of scientists has studied these snakes and passed their data down through generations. This long-term dataset allows scientists to ask questions about how replicate populations change over time.
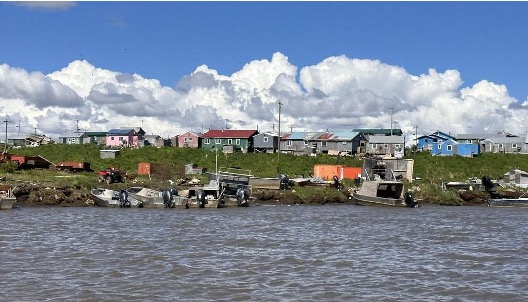
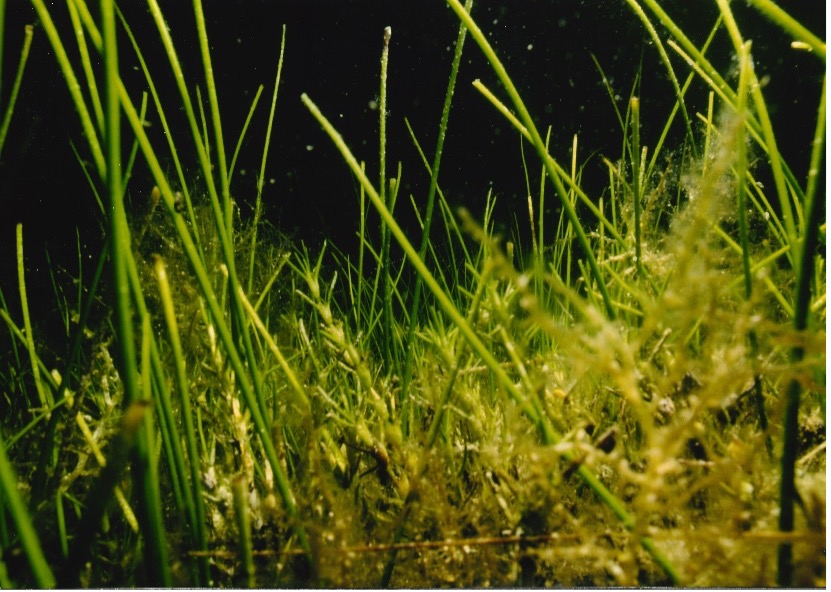
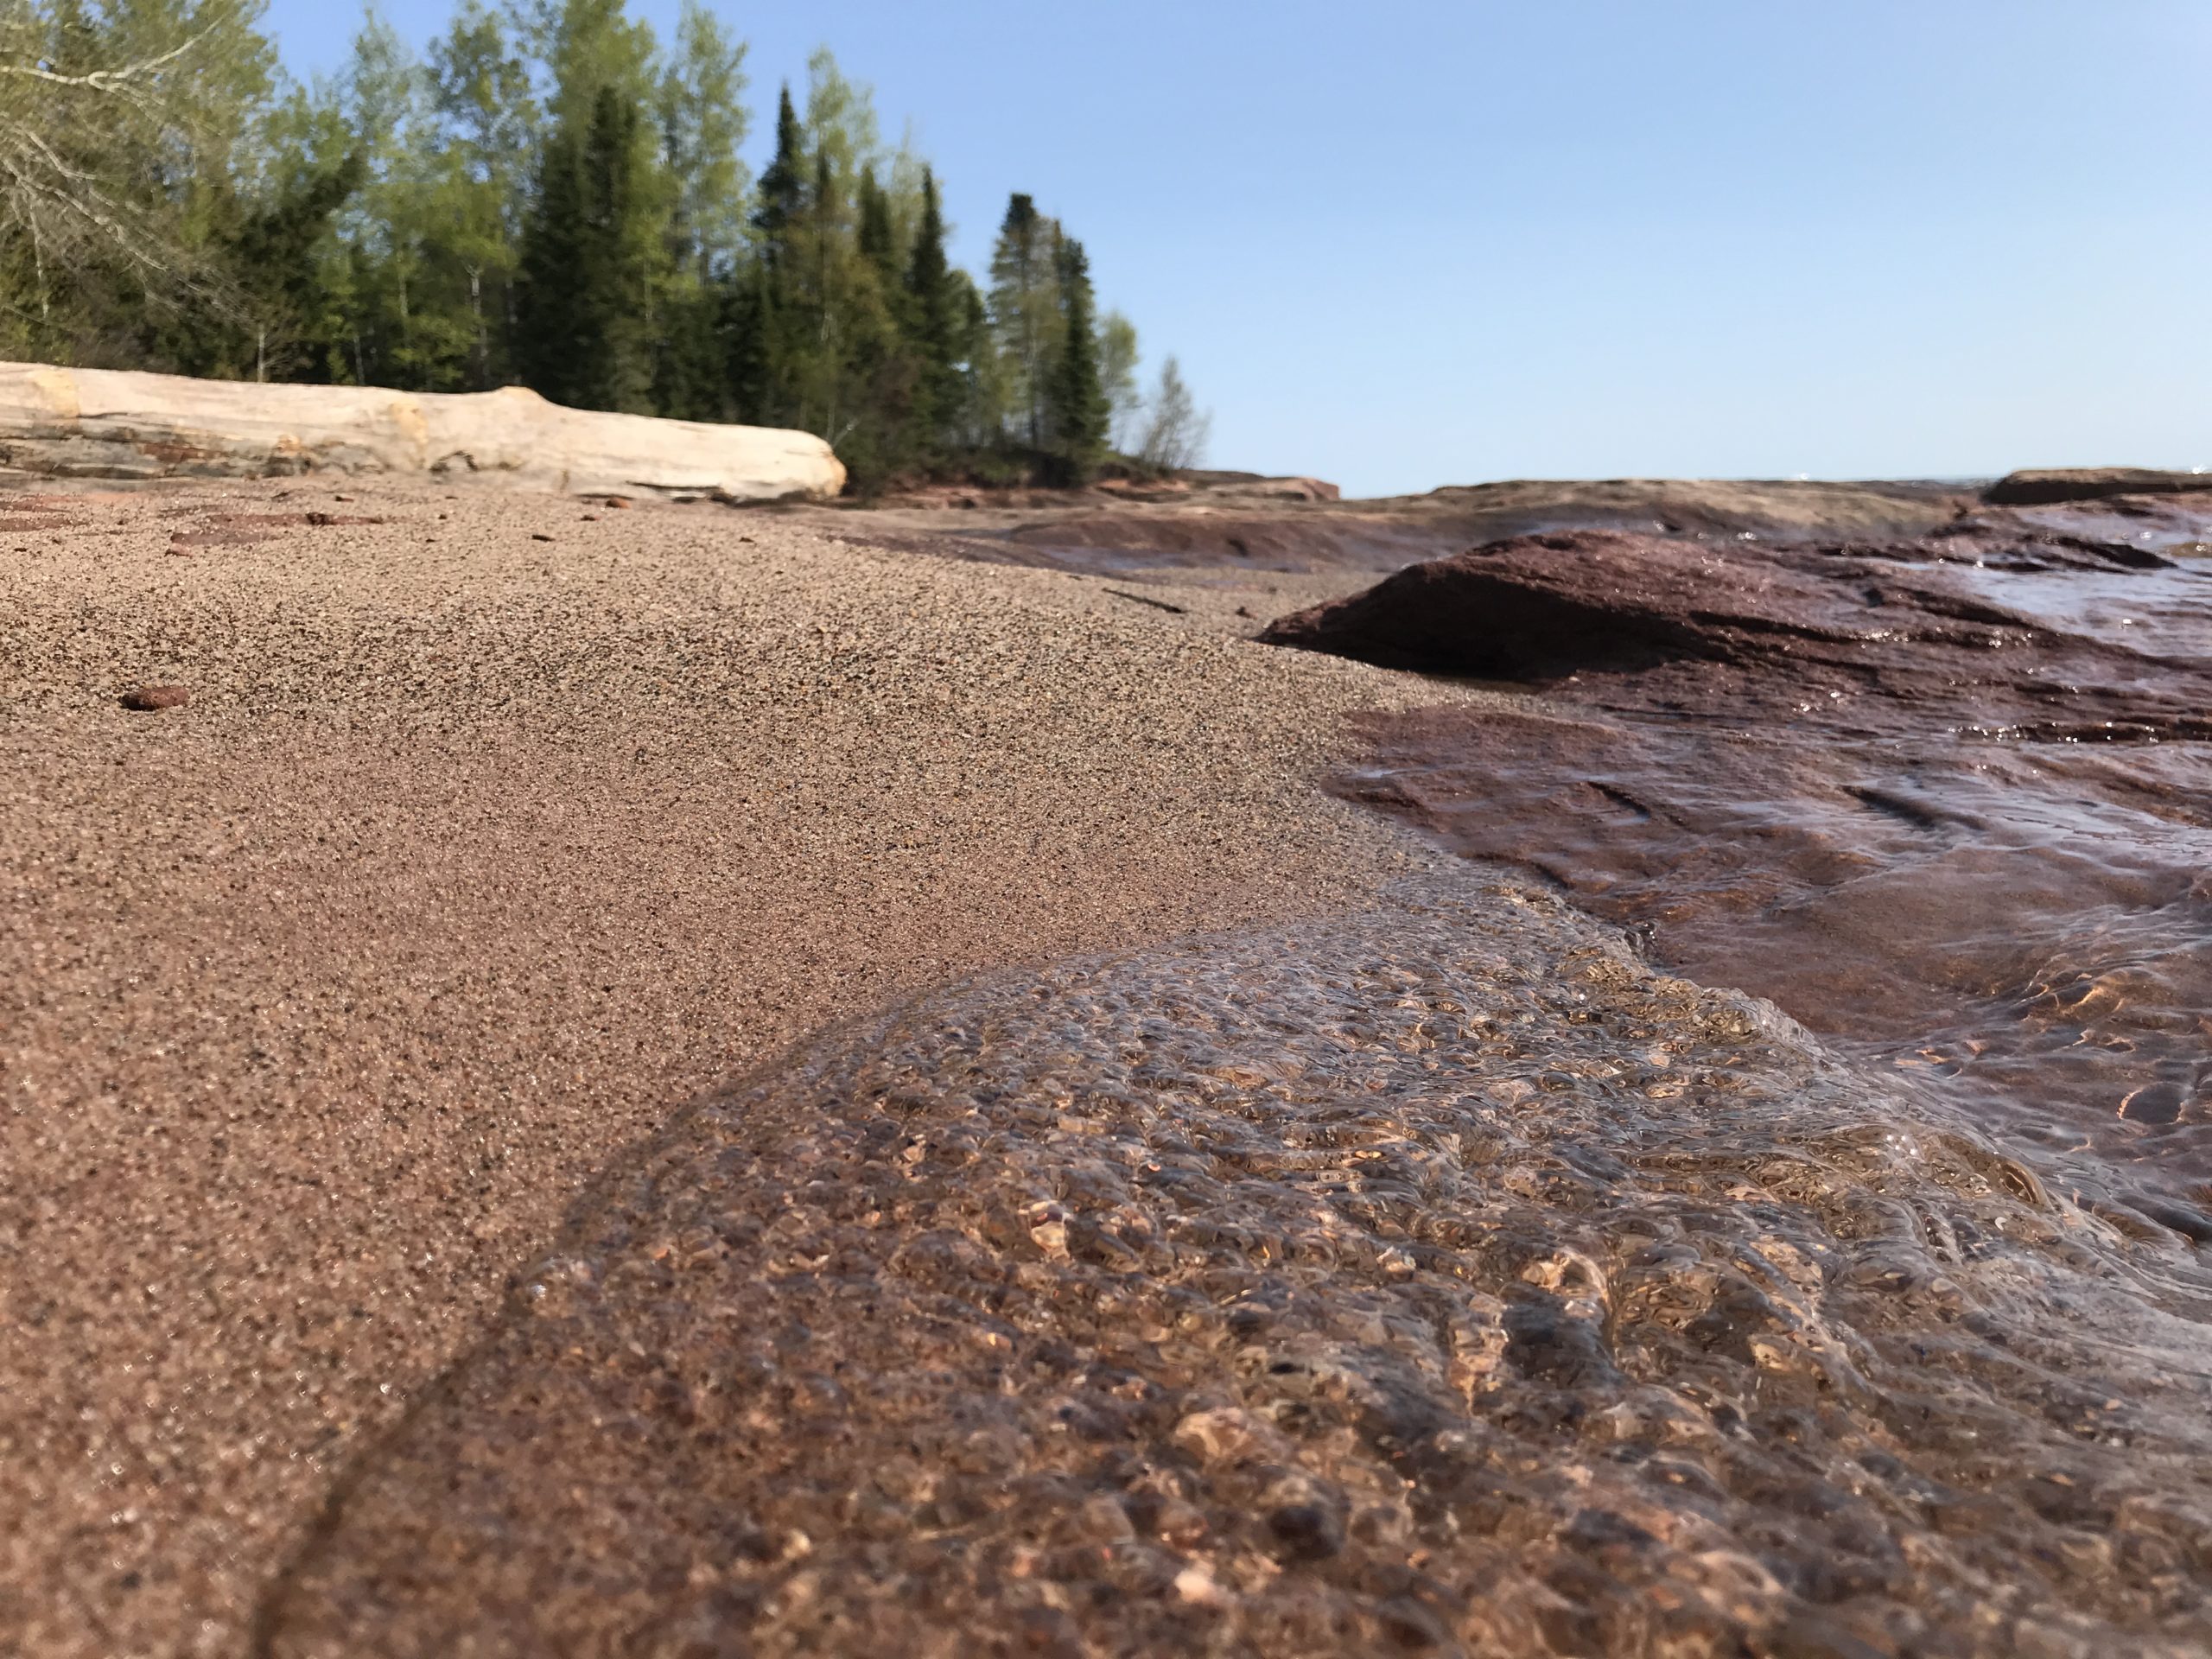
These garter snakes live in two very different types of habitats. Some populations live along lakeshores at low elevations. These areas have rocky shorelines, warmer temperatures, and steady access to water and food like small fish and frogs. However, these snakes also face more predators. Other populations live in high-elevation mountain meadows. These habitats are cooler and covered in grass. Water and food are not always available and can change each year depending on snow and rain. Because these habitats are so different, the snakes in each place experience different challenges.
Over time, these differences have led to the evolution of two distinct ecotypes. Ecotypes are groups within a species that have adapted to their local environment. The lakeshore and meadow snakes differ in both their physical traits and their genetics. They also differ in how they grow, reproduce, and survive—traits known as life history strategies.
Life history strategies are often described along a spectrum from “fast” to “slow.” Lakeshore snakes have a “fast” life history. They grow quickly, reach adulthood sooner, are larger at adulthood, and produce larger and more frequent litters of offspring. In contrast, meadow snakes have a “slow” life history. They grow more slowly, reach adulthood later, have a smaller body size, and have fewer, less frequent litters.
Kaitlyn became interested in these snakes after a surprising start to her career. Interested in reptiles since childhood, she originally moved to Texas to join a lab that was studying turtles. Unfortunately, only a few weeks in, the grant money supporting her position fell through – right after she moved from Wisconsin to Texas! Luckily, another researcher invited her to join a lab studying snakes. After earning her Master’s degree, Kaitlyn continued this work during her PhD with her collaborator, Anne.
Kaitlyn and Anne wanted to understand how these snake populations are surviving today, especially after years of severe drought in California. They wondered if survival rates had changed over time and whether snakes in lakeshore and meadow habitats survived differently.
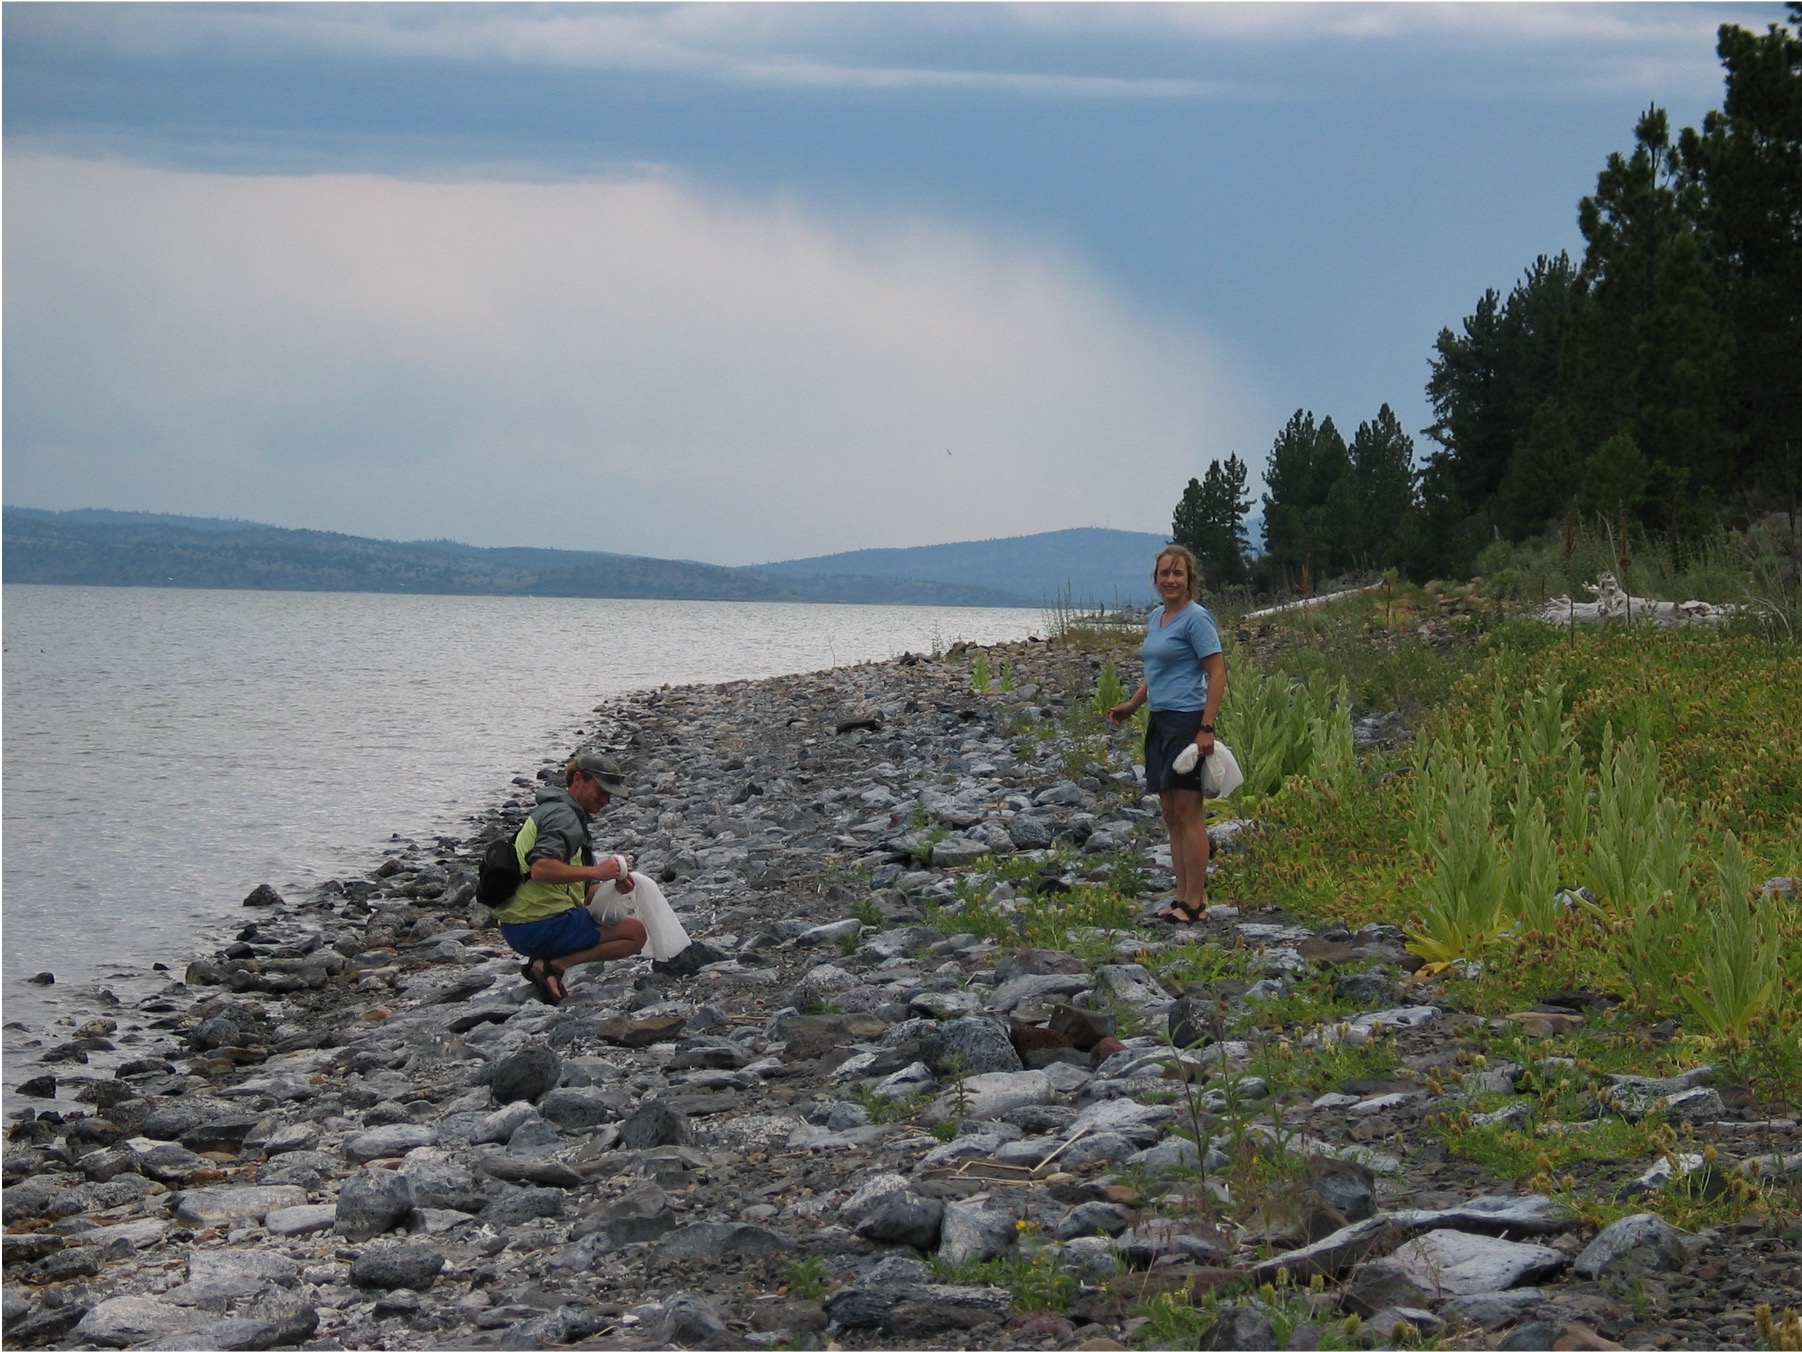
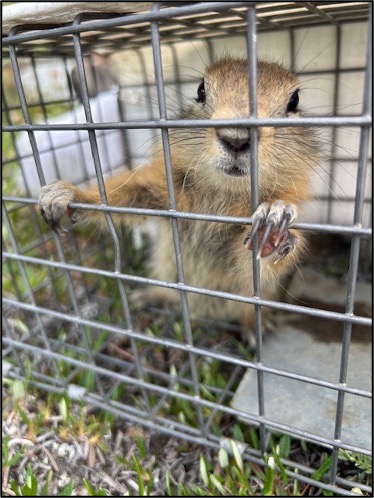
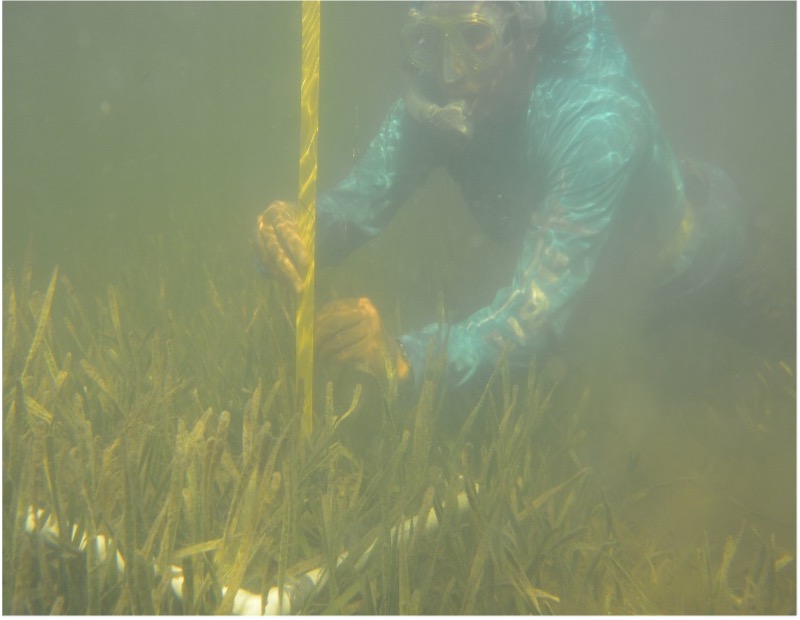
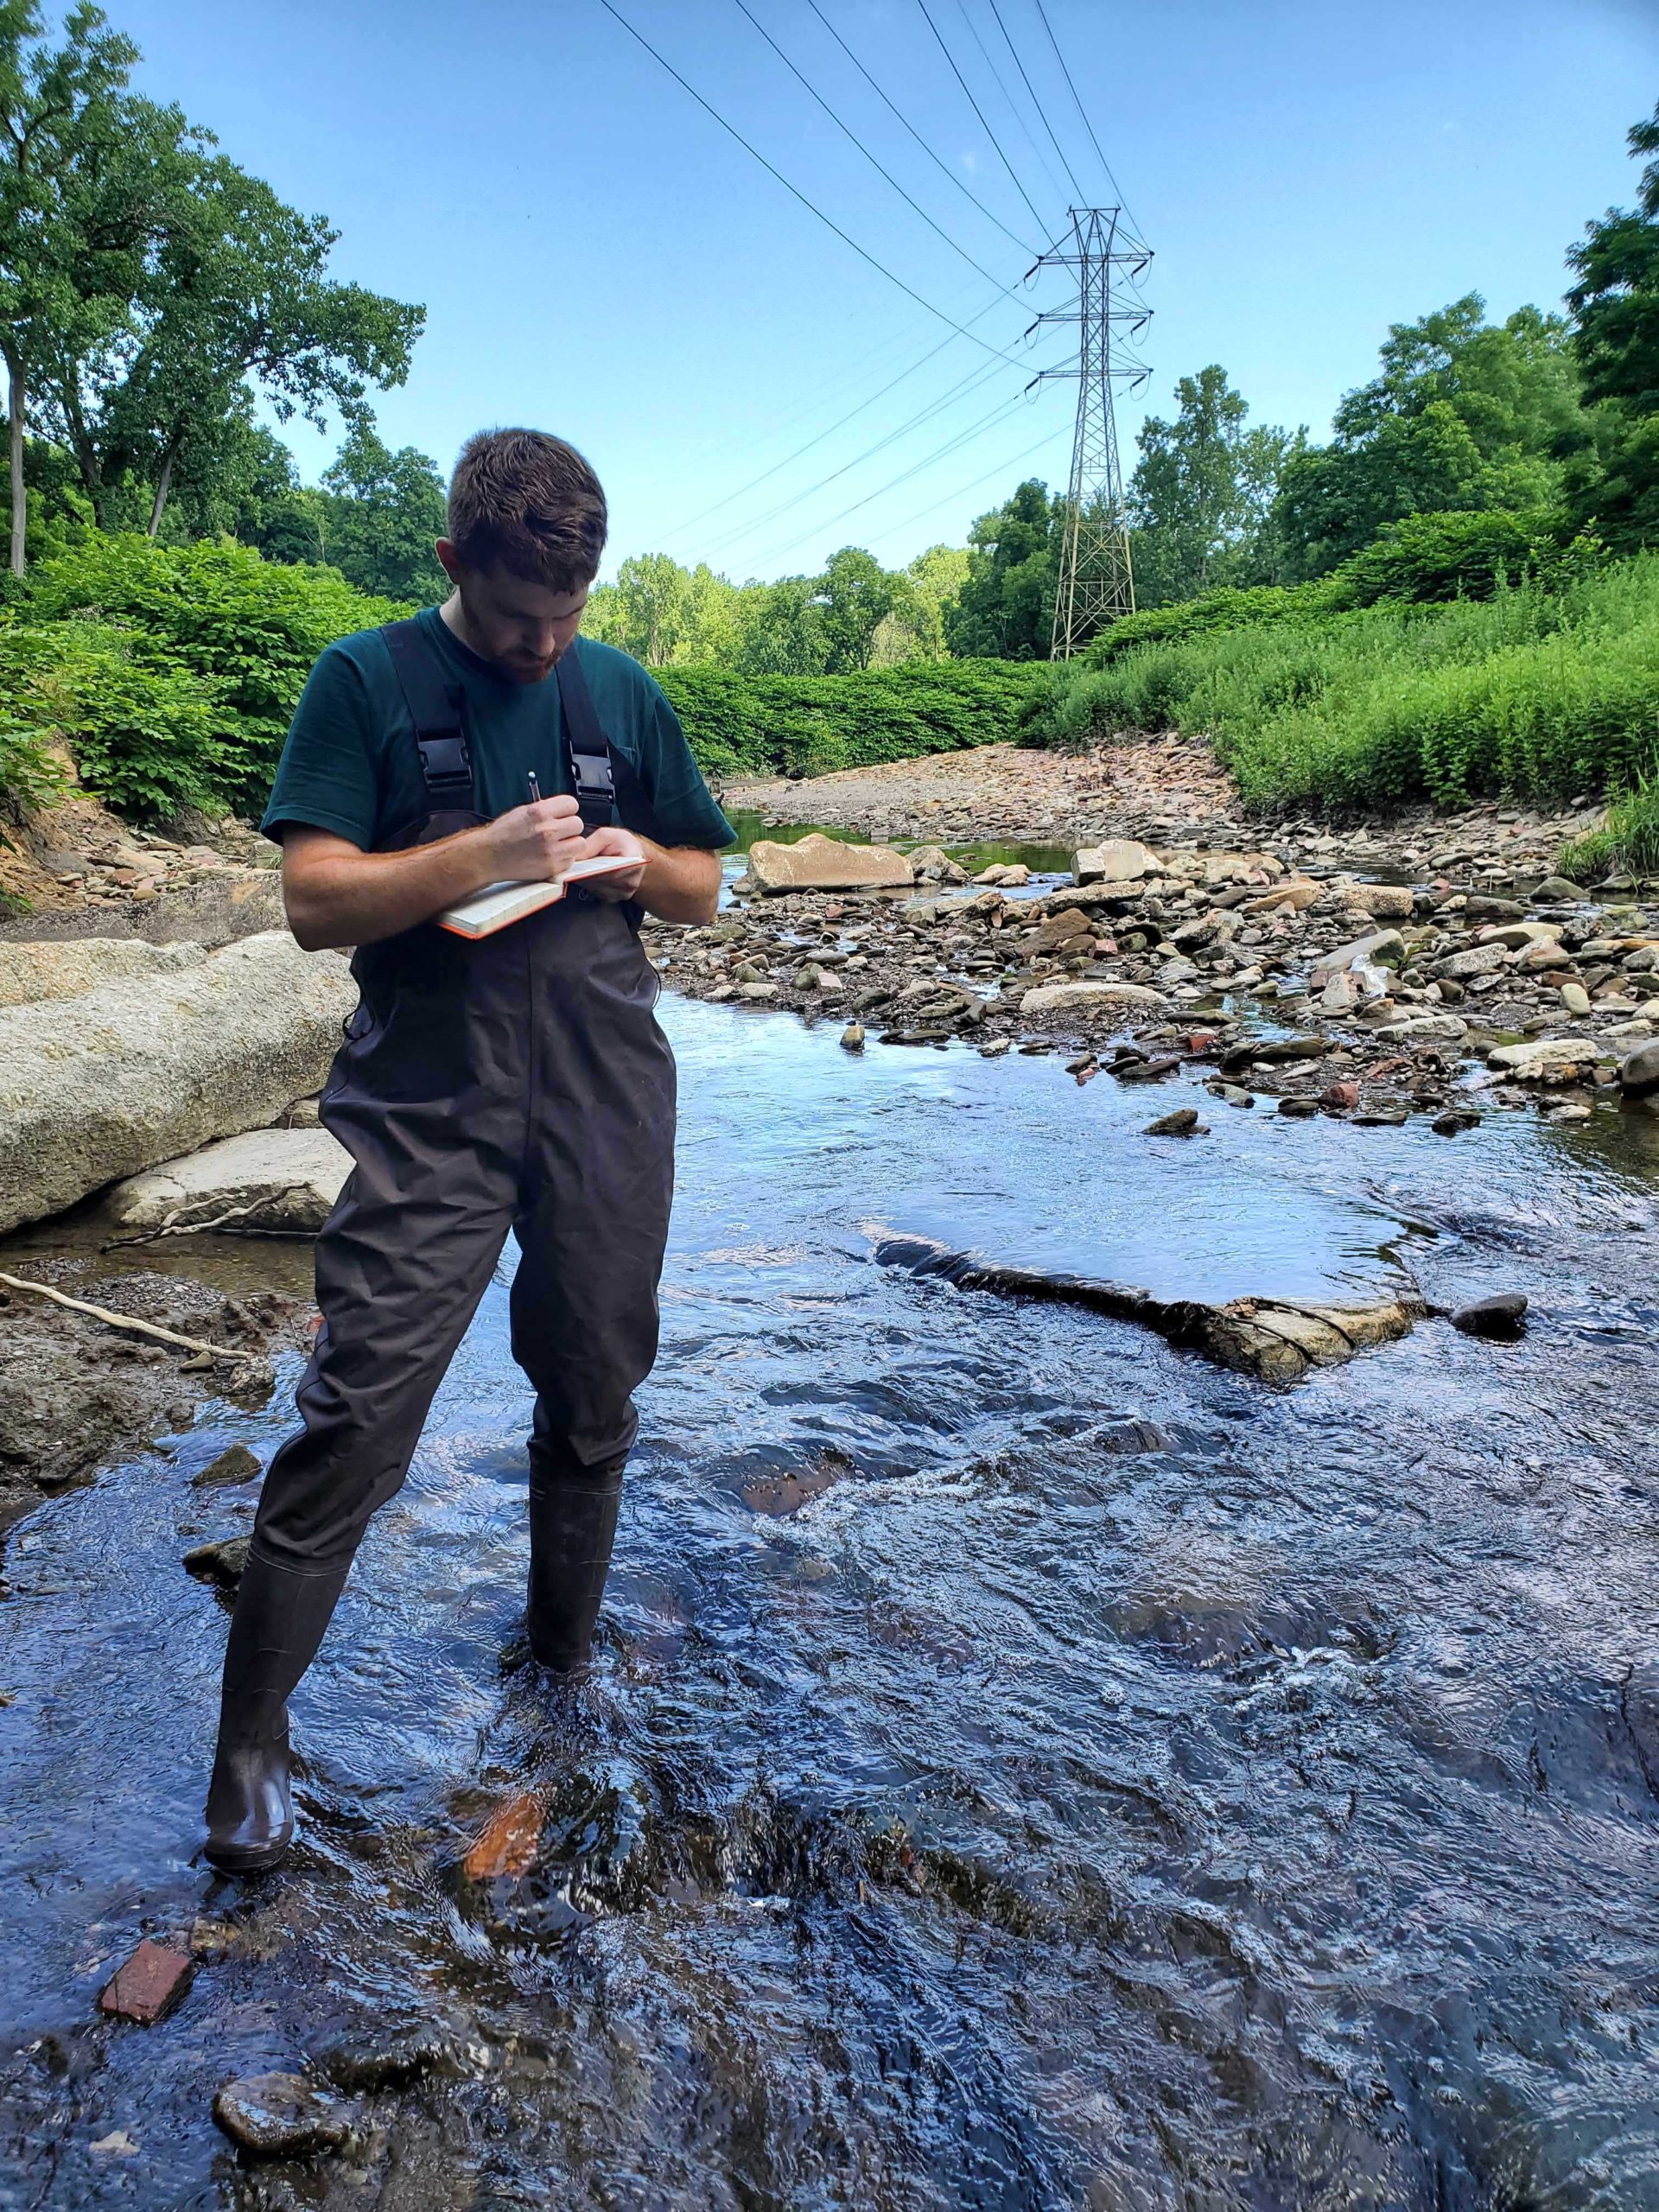
To answer these questions, Anne and Kaitlyn wanted to take a fresh look at snake survival rates. They went out into the field to collect their own data, and compared their estimates to over 50 years of prior data collection. Both the historic and current data were collected using the method called capture-mark-recapture. In this method, researchers catch snakes, measure traits like size and weight, and give each snake a unique mark before releasing it back into the wild. If a snake is caught again later, scientists can track how it has grown. Not all snakes are recaptured. These data can be used to estimate survival rates, though some snakes may have moved away or avoided being caught.
Because it is hard to know the exact age of each snake, Kaitlyn grouped them into four age classes based on size: neonates (newborns), juveniles, young adults, and old adults. She then used statistical models to use her capture-mark-recapture dataset to estimate the probability of survival for each group. Kaitlyn predicted that meadow snakes, with their “slow” life history strategy, would have higher survival rates than lakeshore snakes. She also expected this difference to be greatest in young snakes.
Featured scientists: Kaitlyn Holden (she/her) and Anne Bronikowski (she/her) from Michigan State University
Flesch–Kincaid Reading Grade Level = 9.4
Additional Teacher Resources:
- Scientist profile: Anne Bronikowski has a scientist profile to supplement this activity. Have students read more about her research, personal life, and career advice as a way to share contemporary scientist role models with students!
- You can learn more about the IISAGE (Integration Initiative: Sex, Aging, Genomics, and Evolution) project here. This initiative is a collaborative effort to learn more about the mechanisms of sex-specific differences in aging and features research with a variety of organisms.
- Visit this page for additional scientist profiles and Data Nuggets featuring IISAGE research.