The activities are as follows:
- Teacher Guide
- Student activity, Graph Type A, Level 2
- Student activity, Graph Type B, Level 2
- Student activity, Graph Type C, Level 2
- Grading Rubric
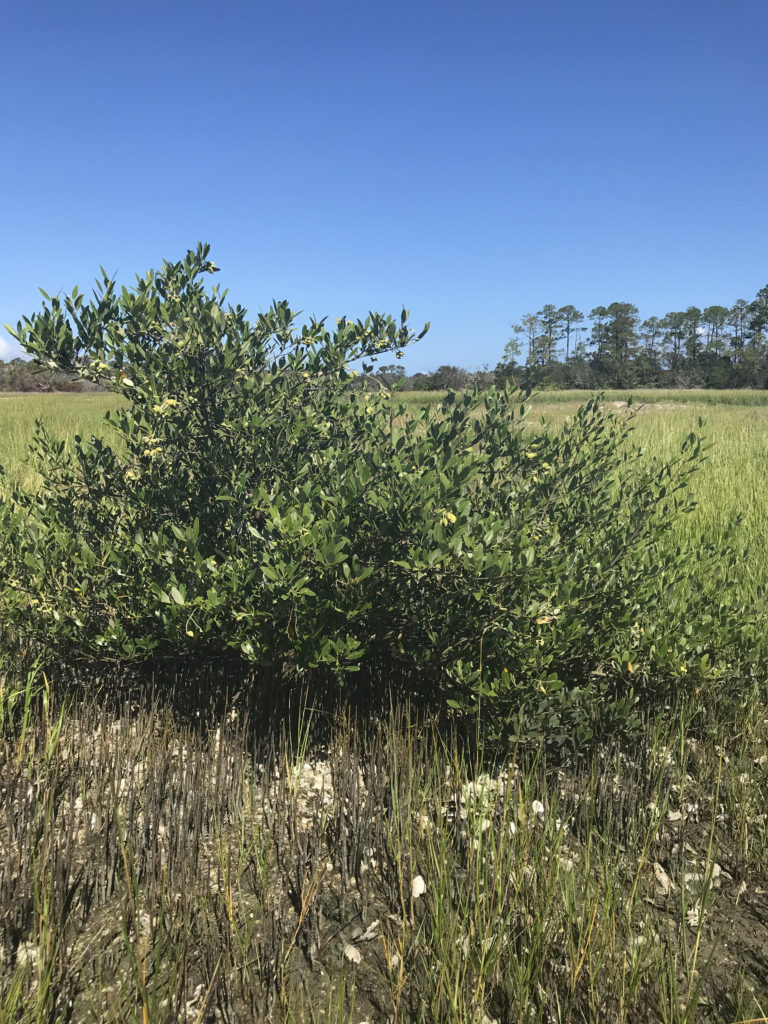
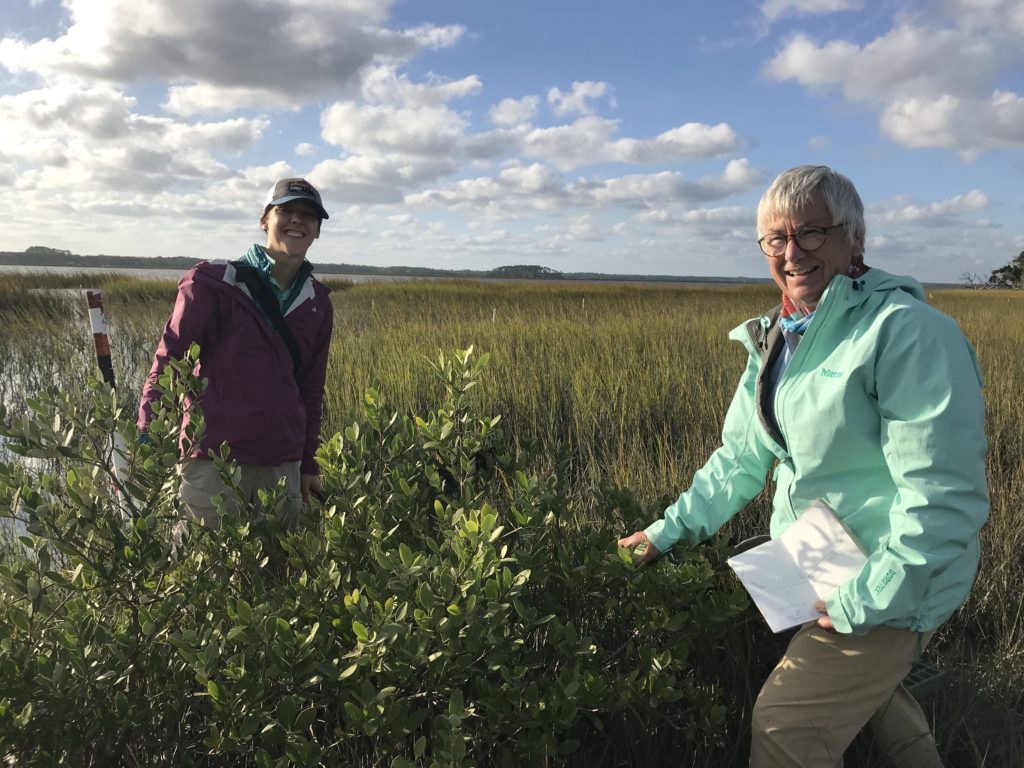
Lagoons are areas along the coast where a shallow pocket of sea water is separated from the ocean most of the time. During some events, like high tides, the ocean water meets back up with the lagoon. Coastal lagoons are found all over the world – even in the most northern region of Alaska, called the High Arctic!
These High Arctic lagoons go through many extreme changes each season. In April, ice completely covers the surface. The mud at the bottom of the shorelines is frozen solid. In June, the ice begins to break up and the muddy bottoms of the lagoons begin to thaw. The melting ice adds freshwater to the lagoons and lowers the salt levels. In August, lagoon temperatures continue to rise until there is only open water and soft mushy sediment.
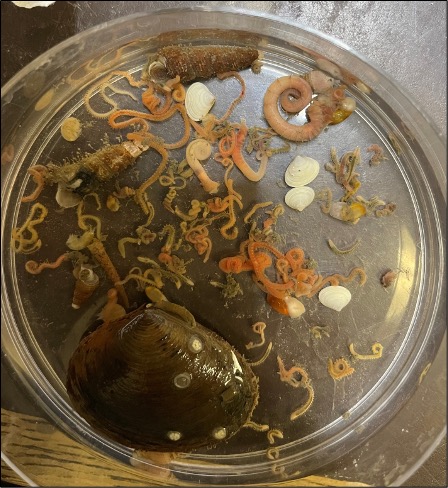
You would think these harsh conditions would make High Arctic lagoons not suitable to live in. However, these lagoons support a surprisingly wide range of marine organisms! Marine worms, snails, and clams live in the muddy sediment of these lagoons. This habitat is also called the bottom, or benthic, environment. Having a rich variety of benthic animals in these habitats supports fish, which migrate along the shoreline and eat these animals once the ice has left. And people who live in the Arctic depend on fishing for their food.
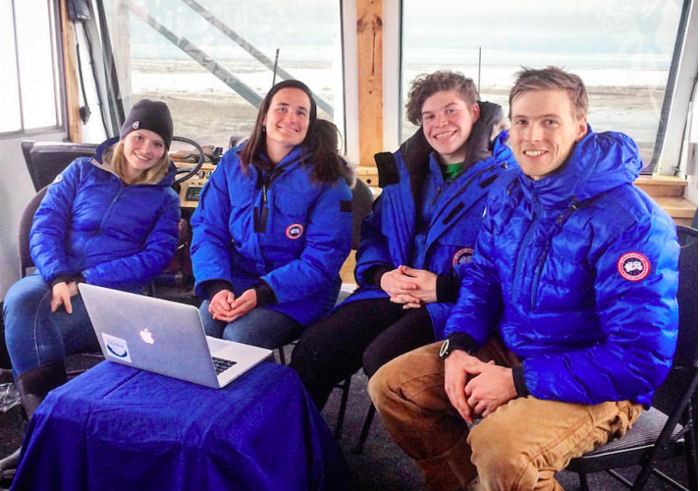
Ken, Danny, and Kaylie are a team of scientists from Texas interested in learning more about how the extreme seasons of the High Arctic affect the marine life that lives there. They want to know whether the total number of benthic species changes with the seasons. Or does the benthic community of worms, snails, and clams stay constant throughout the year regardless of ice, freezing temperatures, and large changes in salt levels? The science team thought that the extreme winter conditions in the Arctic lagoons cause a die-off each year, so there would be fewer species found at that time. Once the ice melts each year, benthic animals likely migrate back into the lagoons from deeper waters and the number of species would increase again.
Ken, Danny, and Kaylie had many discussions about how they could answer their questions. They decided the best approach would be to travel to Alaska to take samples of the benthic animals. To capture the changes in lagoon living conditions, they would need to collect samples during the three distinct seasons.
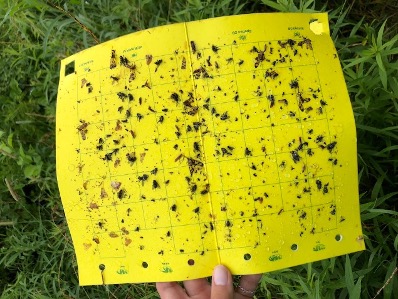
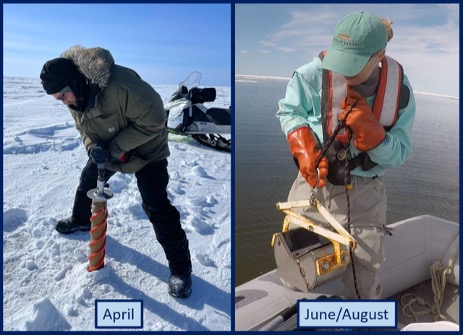
The science team chose to sample Elson Lagoon because it is in the village of Utqiaġvik, Alaska and much easier to reach than other Arctic lagoons. They visited three times. First, in April, during the ice-covered time, again in June when the ice was breaking up, and a final time in summer when the water was warmer. In April, they used a hollow ice drill to collect a core sample of the frozen sediment beneath the ice. In June and August, they deployed a Ponar instrument into the water, which snaps shut when it reaches the lagoon bottom to grab a sample. Each time they visited the lagoon, they collected two sediment samples.
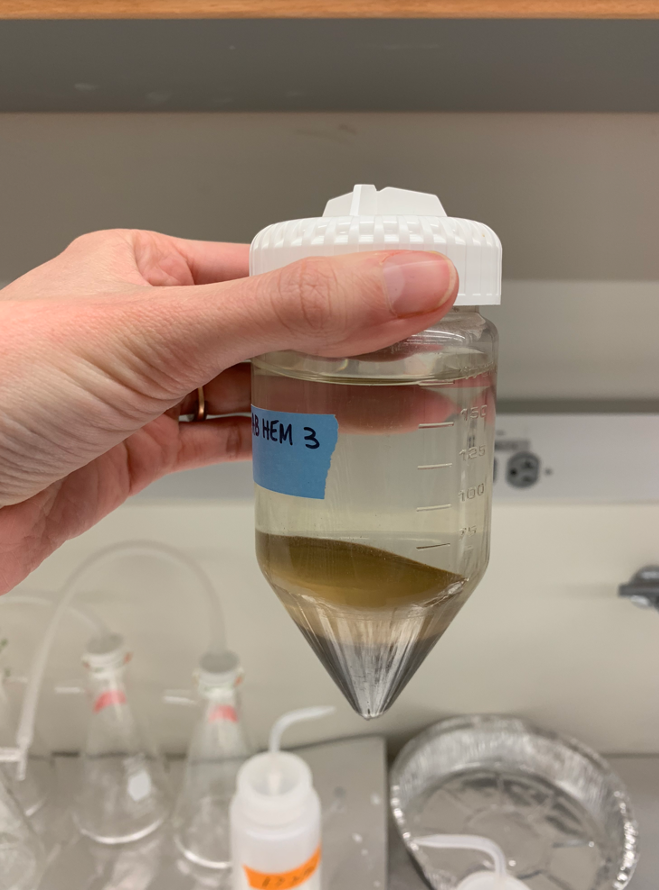
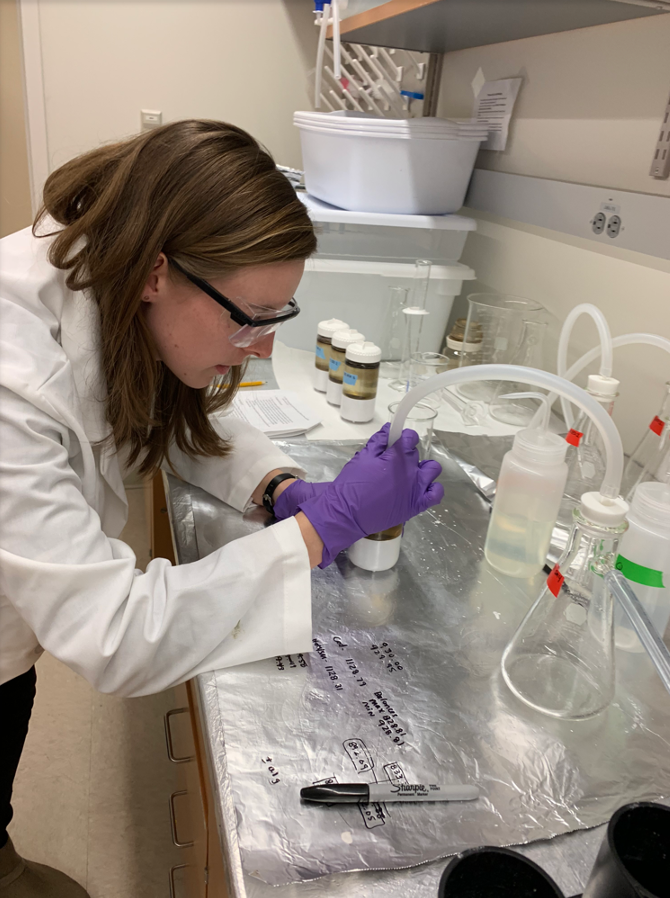
Back in the lab, they rinsed the samples with seawater to remove the sediment and reveal the benthic animals. The team then sorted and identified the species present. They recorded the total number of different species, or species richness, found in each sample.
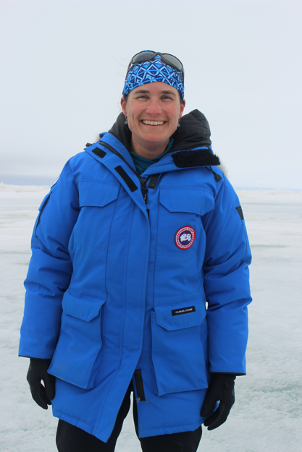
Featured scientists: Ken Dunton, Daniel Fraser, and Kaylie Plumb from the University of Texas Marine Science Institute
Written by: Maria McDonel from Flour Bluff and Corpus Christi Schools
Flesch–Kincaid Reading Grade Level = 8.9
Additional teacher resources related to this Data Nugget include:
- Two short videos that you can play to introduce students to Arctic lagoons and the research that is done there:
- A National Geographic article about Arctic research.
- More information on the Beufort Lagoon Long-term Ecological Research site and who to contact.