Turning up the heat

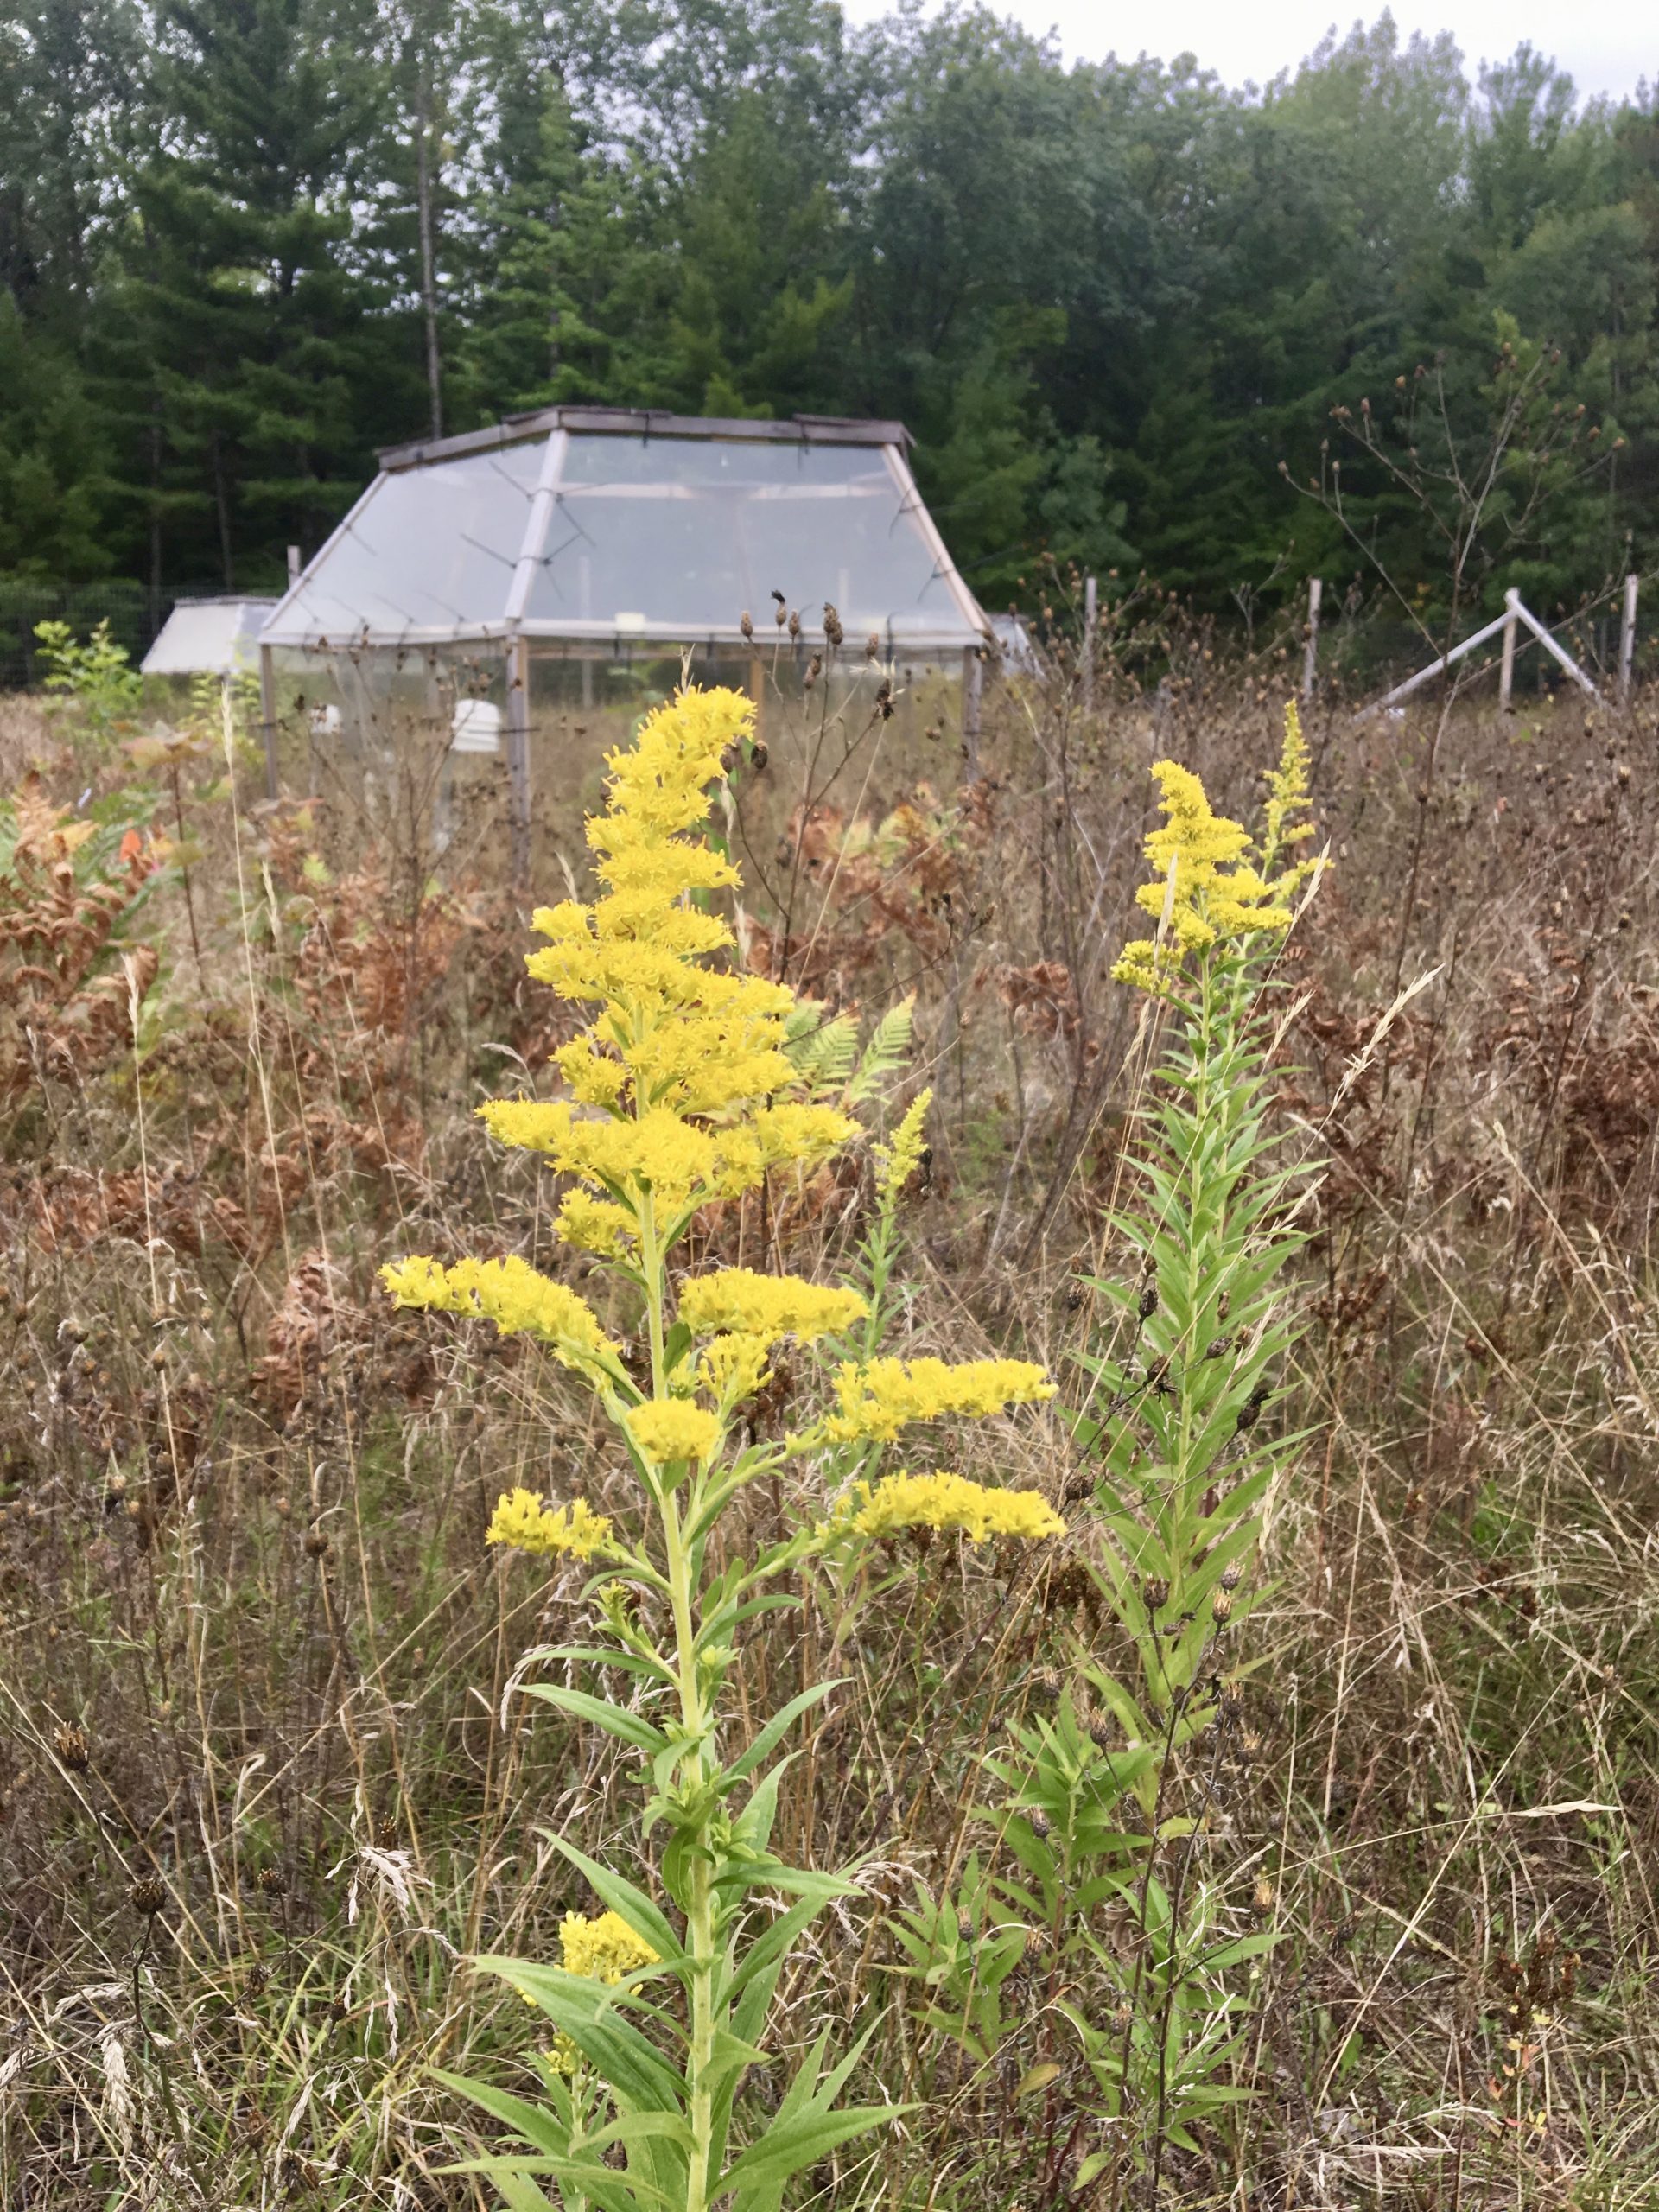
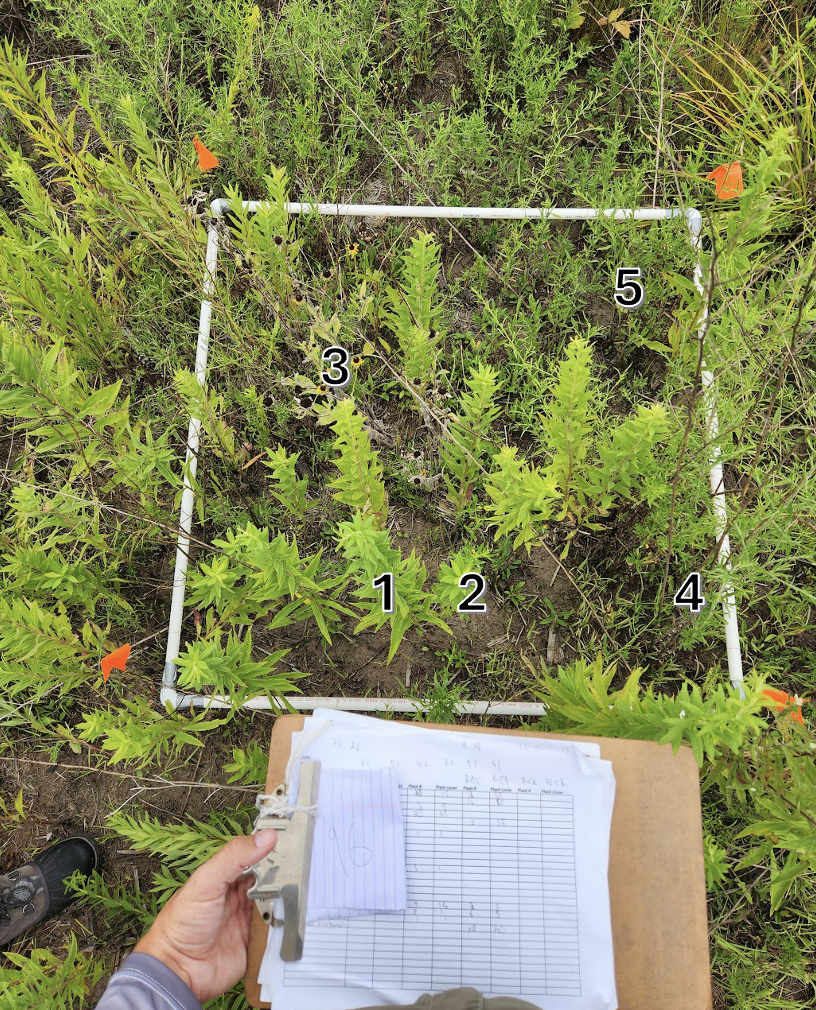
Tall goldenrod plants flowering in one of the ambient condition plots.

As you step into a warm greenhouse, you can feel how the glass has captured the sun’s heat inside. Now imagine that same warmth spreading across the entire planet due to increased greenhouse gas emissions. Climate scientists predict that by the year 2100, Earth’s average temperature could increase by as much as 3°C because of climate change. That might sound small, but even a few degrees matter a lot.

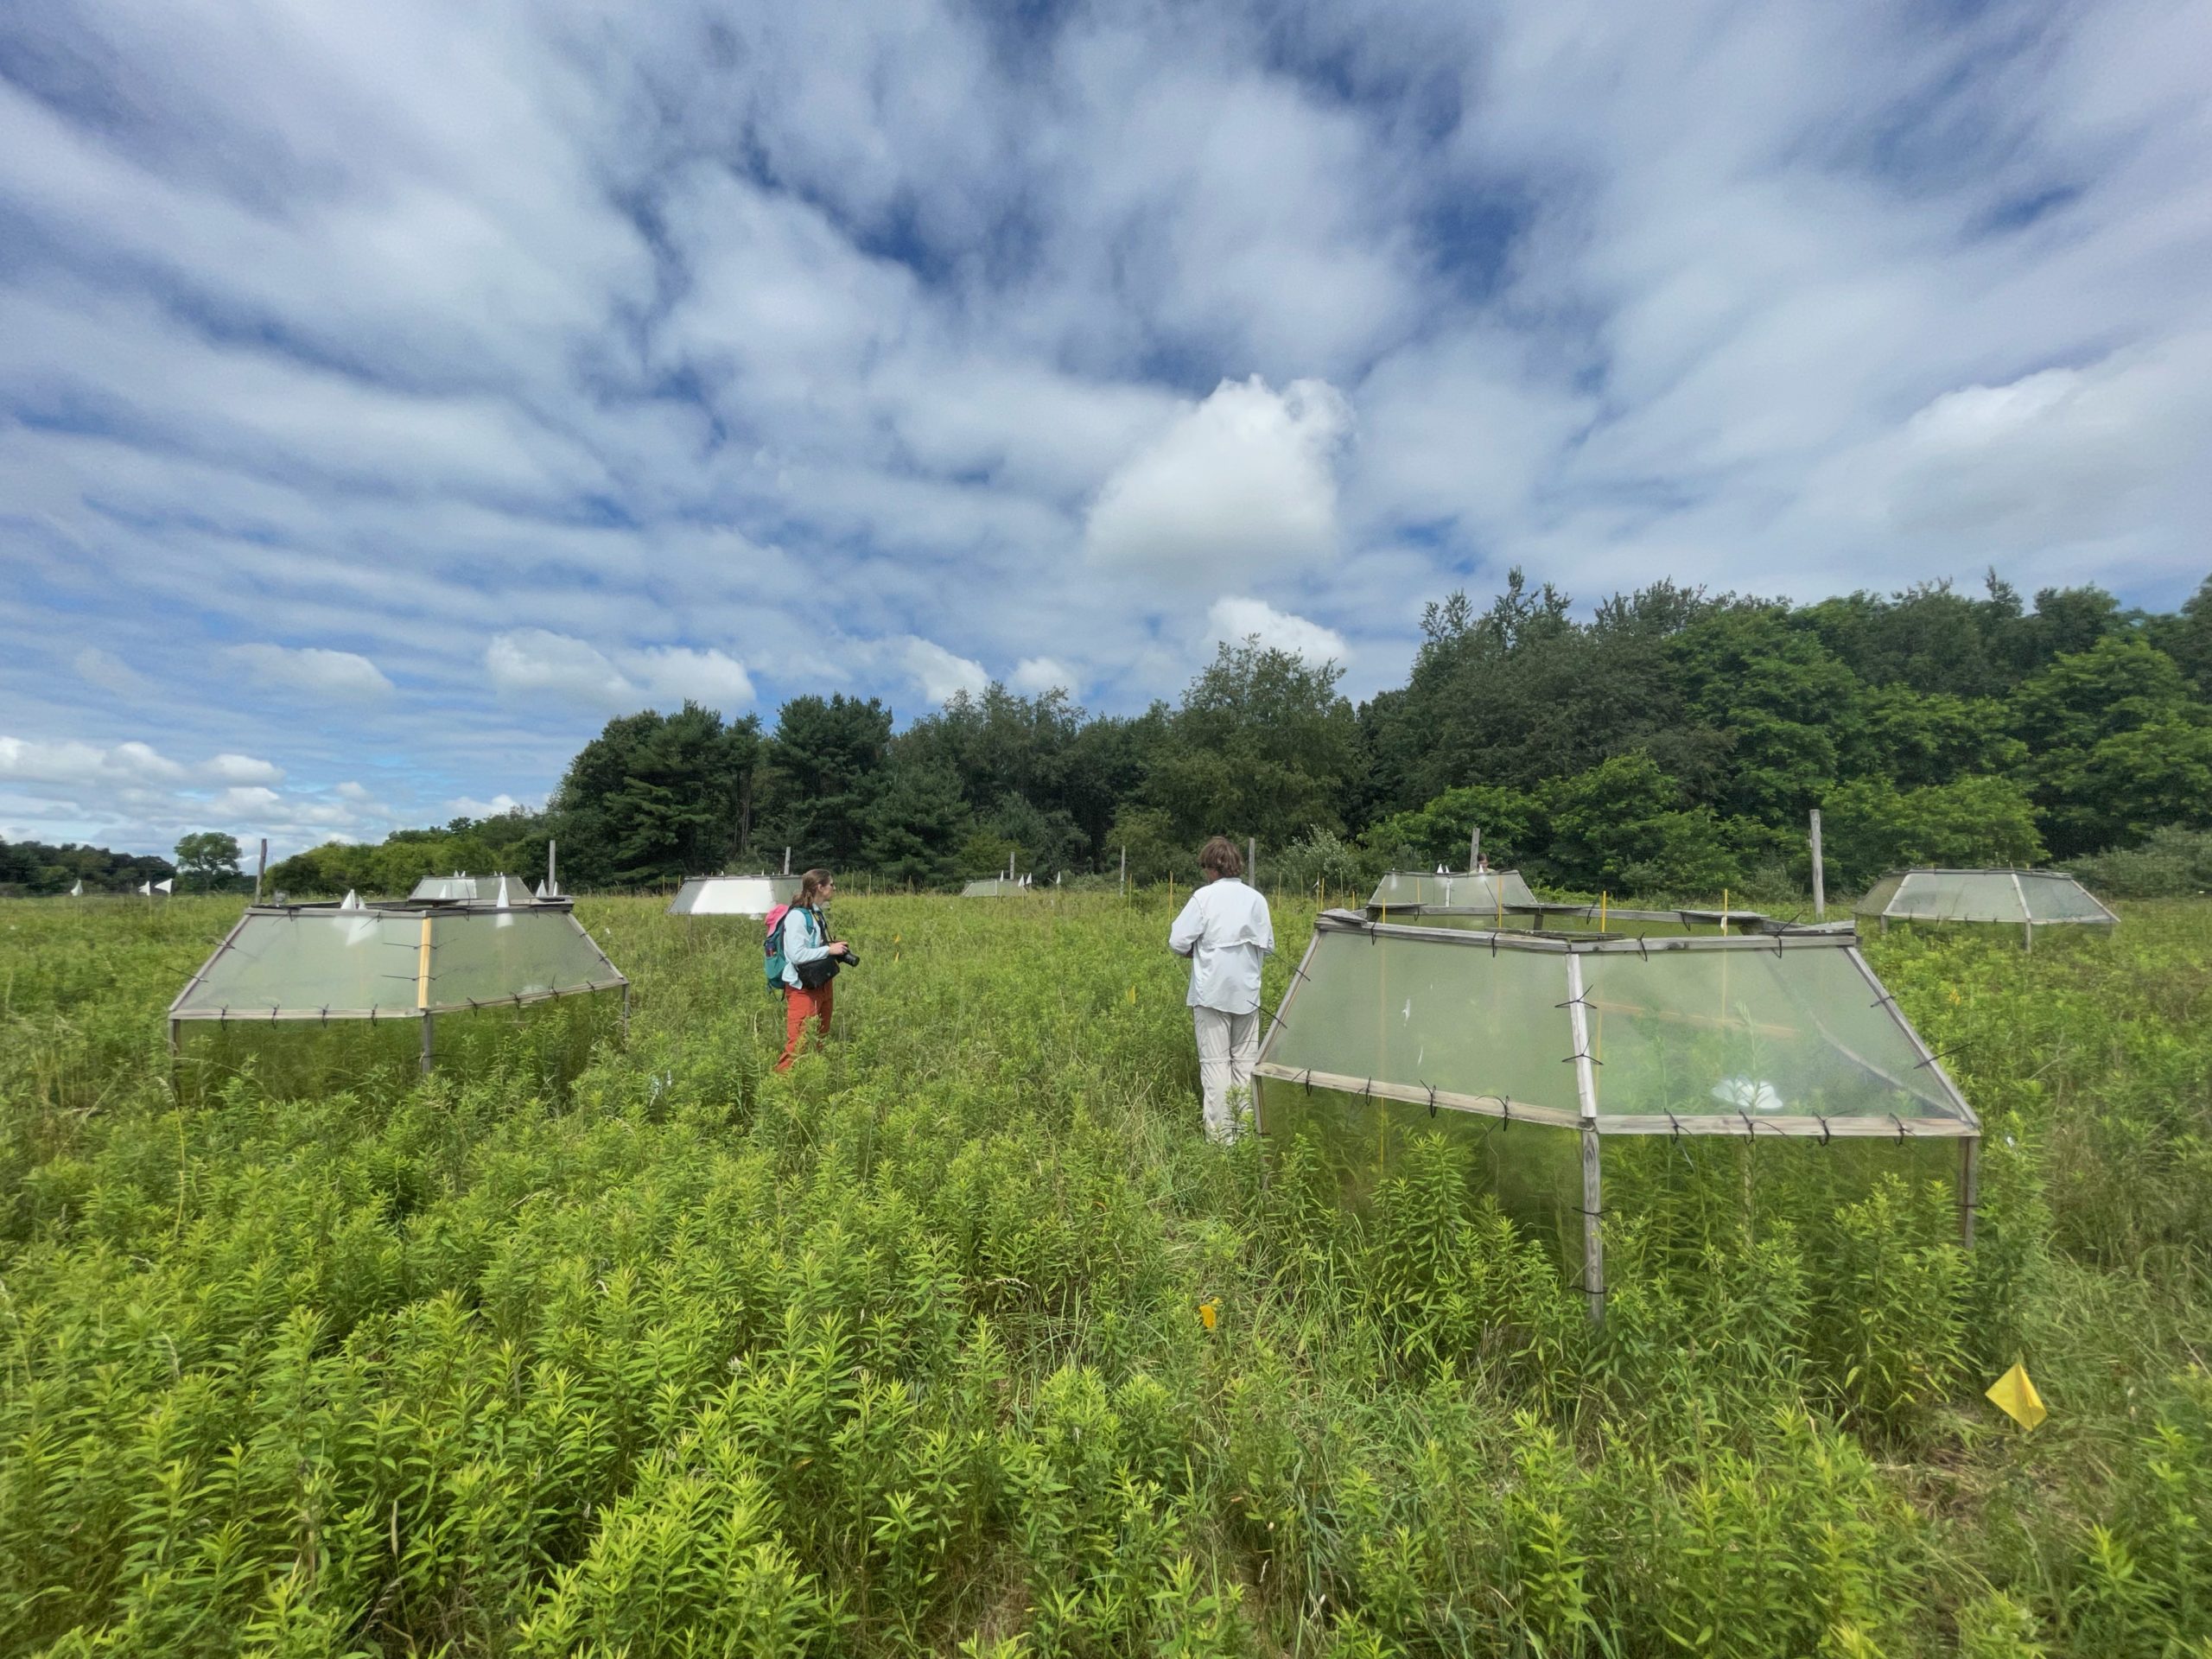
At the Kellogg Biological Station in southwest Michigan, a group of researchers wanted to know how climate warming will affect plant communities. To find out, they created what they call “mini time machines” using open-top chambers. These chambers are clear, hexagonal-shaped structures that trap heat and make the air inside warmer – just like a greenhouse. The chambers still allow for natural levels of precipitation, air flow, and insects to enter through their open tops. By comparing plant communities grown in these warmed conditionswith chambers, to ambient conditions without the chambers, scientists can see how rising temperatures might impact the plants in the future. Understanding these changes can help us prepare for a future where the climate is different from what we know today.

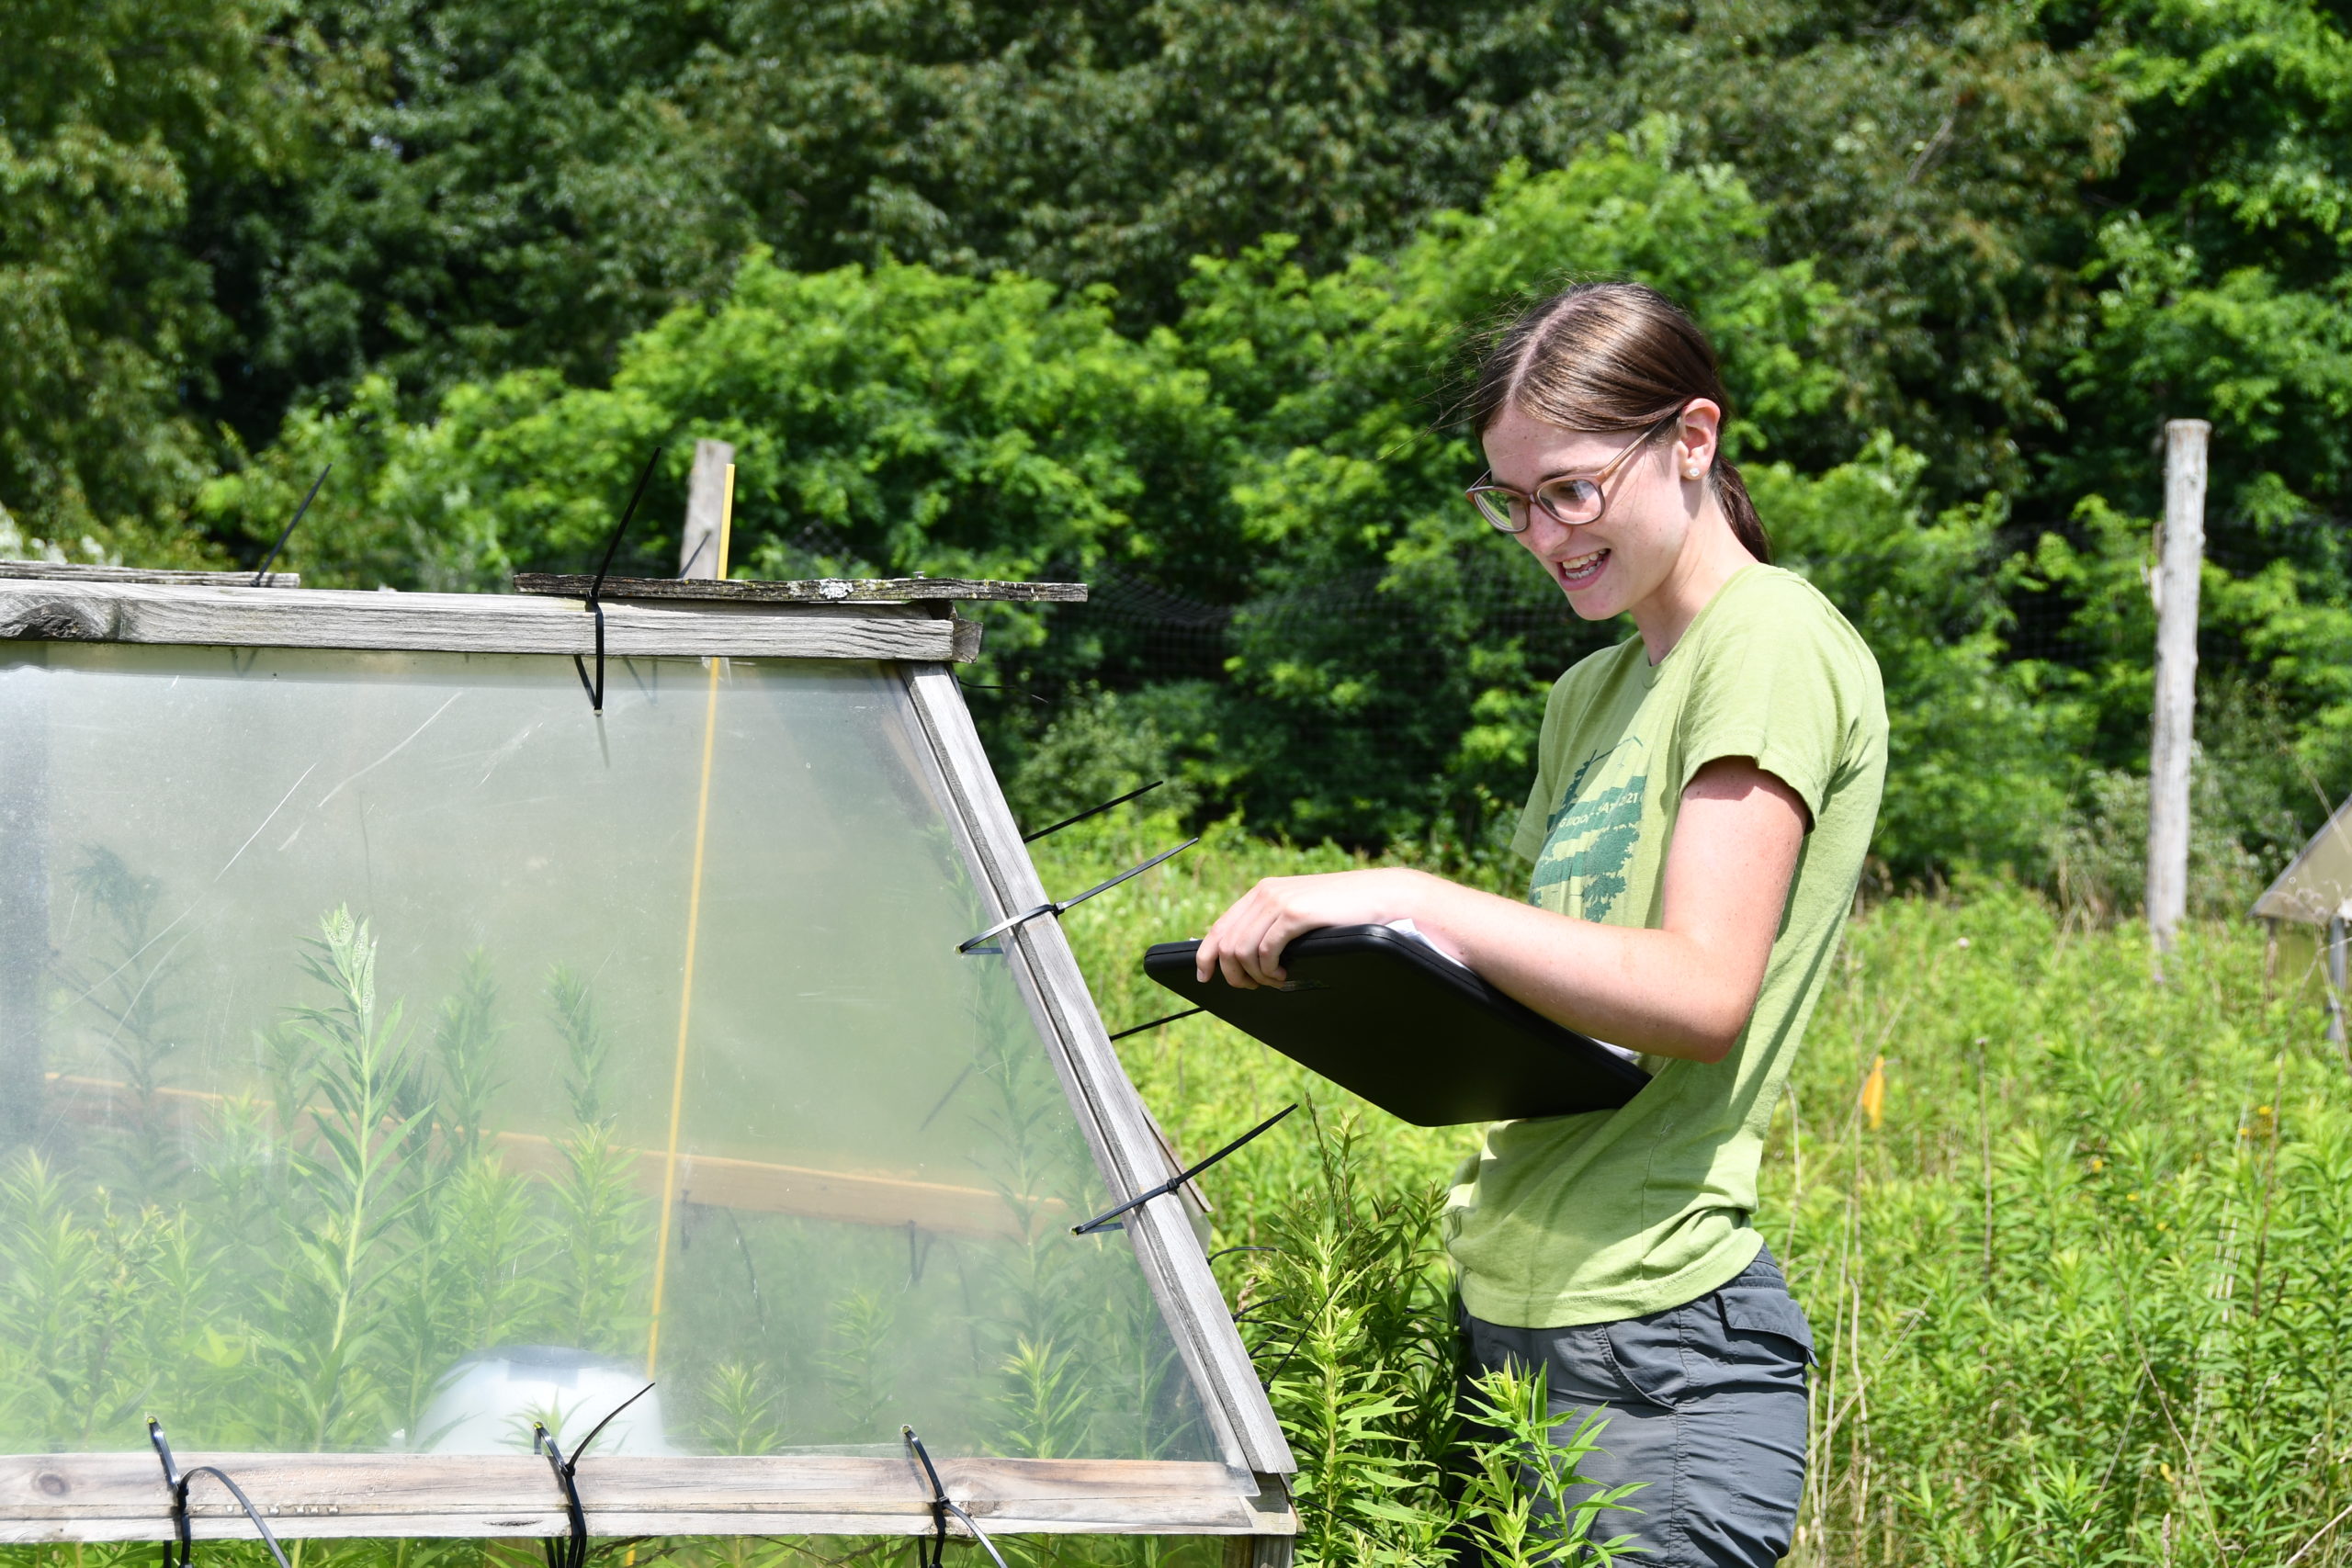
A scientist collecting data outside an open-top chamber.

The scientists working in the open-top chambers were at multiple stages in their careers. Moriah is a graduate student who became fascinated with plants when she first learned how to identify different species. Instead of looking at plants as all one patch of green, she could then notice all the diversity and the different roles they play in an ecosystem. Mark is a lab technician working with Moriah. He is interested in how plants will respond to warmer climates because it gives a glimpse of the world his grandchildren will see.

When Moriah and Mark started, they were joined by a few other scientists: Kara, another graduate student, and Emily, an undergraduate student. The open-top chambers had already been out in the field for five years. The field was growing with a diverse mix of plants common in the area. Together, they observed that plants growing in the warmed conditions inside the chambers seemed to be taller than those growing in the ambient conditions outside the chambers.

To collect some data to back up their observation, the team began with one species, tall goldenrod. This is a wildflower species with a bright yellow flower, and it is one of the most common species at this location. They wanted to see how goldenrod growth differed in warmed and ambient conditions. When temperatures rise, some plants grow faster and taller to compete for sunlight, but this takes a lot of energy. That means plants have less energy for survival, making seeds, or defending against herbivores, like insects. The researchers predicted that goldenrod inside the chambers would be taller, but would also have fewer stems and plants because they were putting their energy into growing tall instead of making more plants.

Open-topped chambers at the Kellogg Biological Station.

To test their ideas, the team measured goldenrod height with meter sticks and counted the number of goldenrod stems in each plot, called abundance. Their experiment had 30 plots. Half of the plots had open-top chambers, and half did not. That gave them 15 replicates of each treatment. Each plot is 1 meter x 1 meter. 

Featured Scientists: Mark Hammond (he/him), Moriah Young (she/hers), Kara Dobson (she/hers), and Emily Parker (she/hers) from the Kellogg Biological Station Long Term Ecological Research Program

Flesch–Kincaid Reading Grade Level = 9.3

Additional Resources:

  • The group of researchers featured in this activity work together at the Kellogg Biological Station, part of Michigan State University. Their lab is called the Spatial and Community Ecology Lab (SpaCE Lab). To learn more about their lab and work, students can visit their website or check out the Scientist Profiles associated with this activity.
  • Trevor Grabill produced a woodblock printed piece featuring the open-topped chamber experiment, titled What if it’s beautiful?. Along with the piece, they also produced a Zine that includes testimonials by the artist and scientists.

Missing species: the biodiversity of prairie remnants

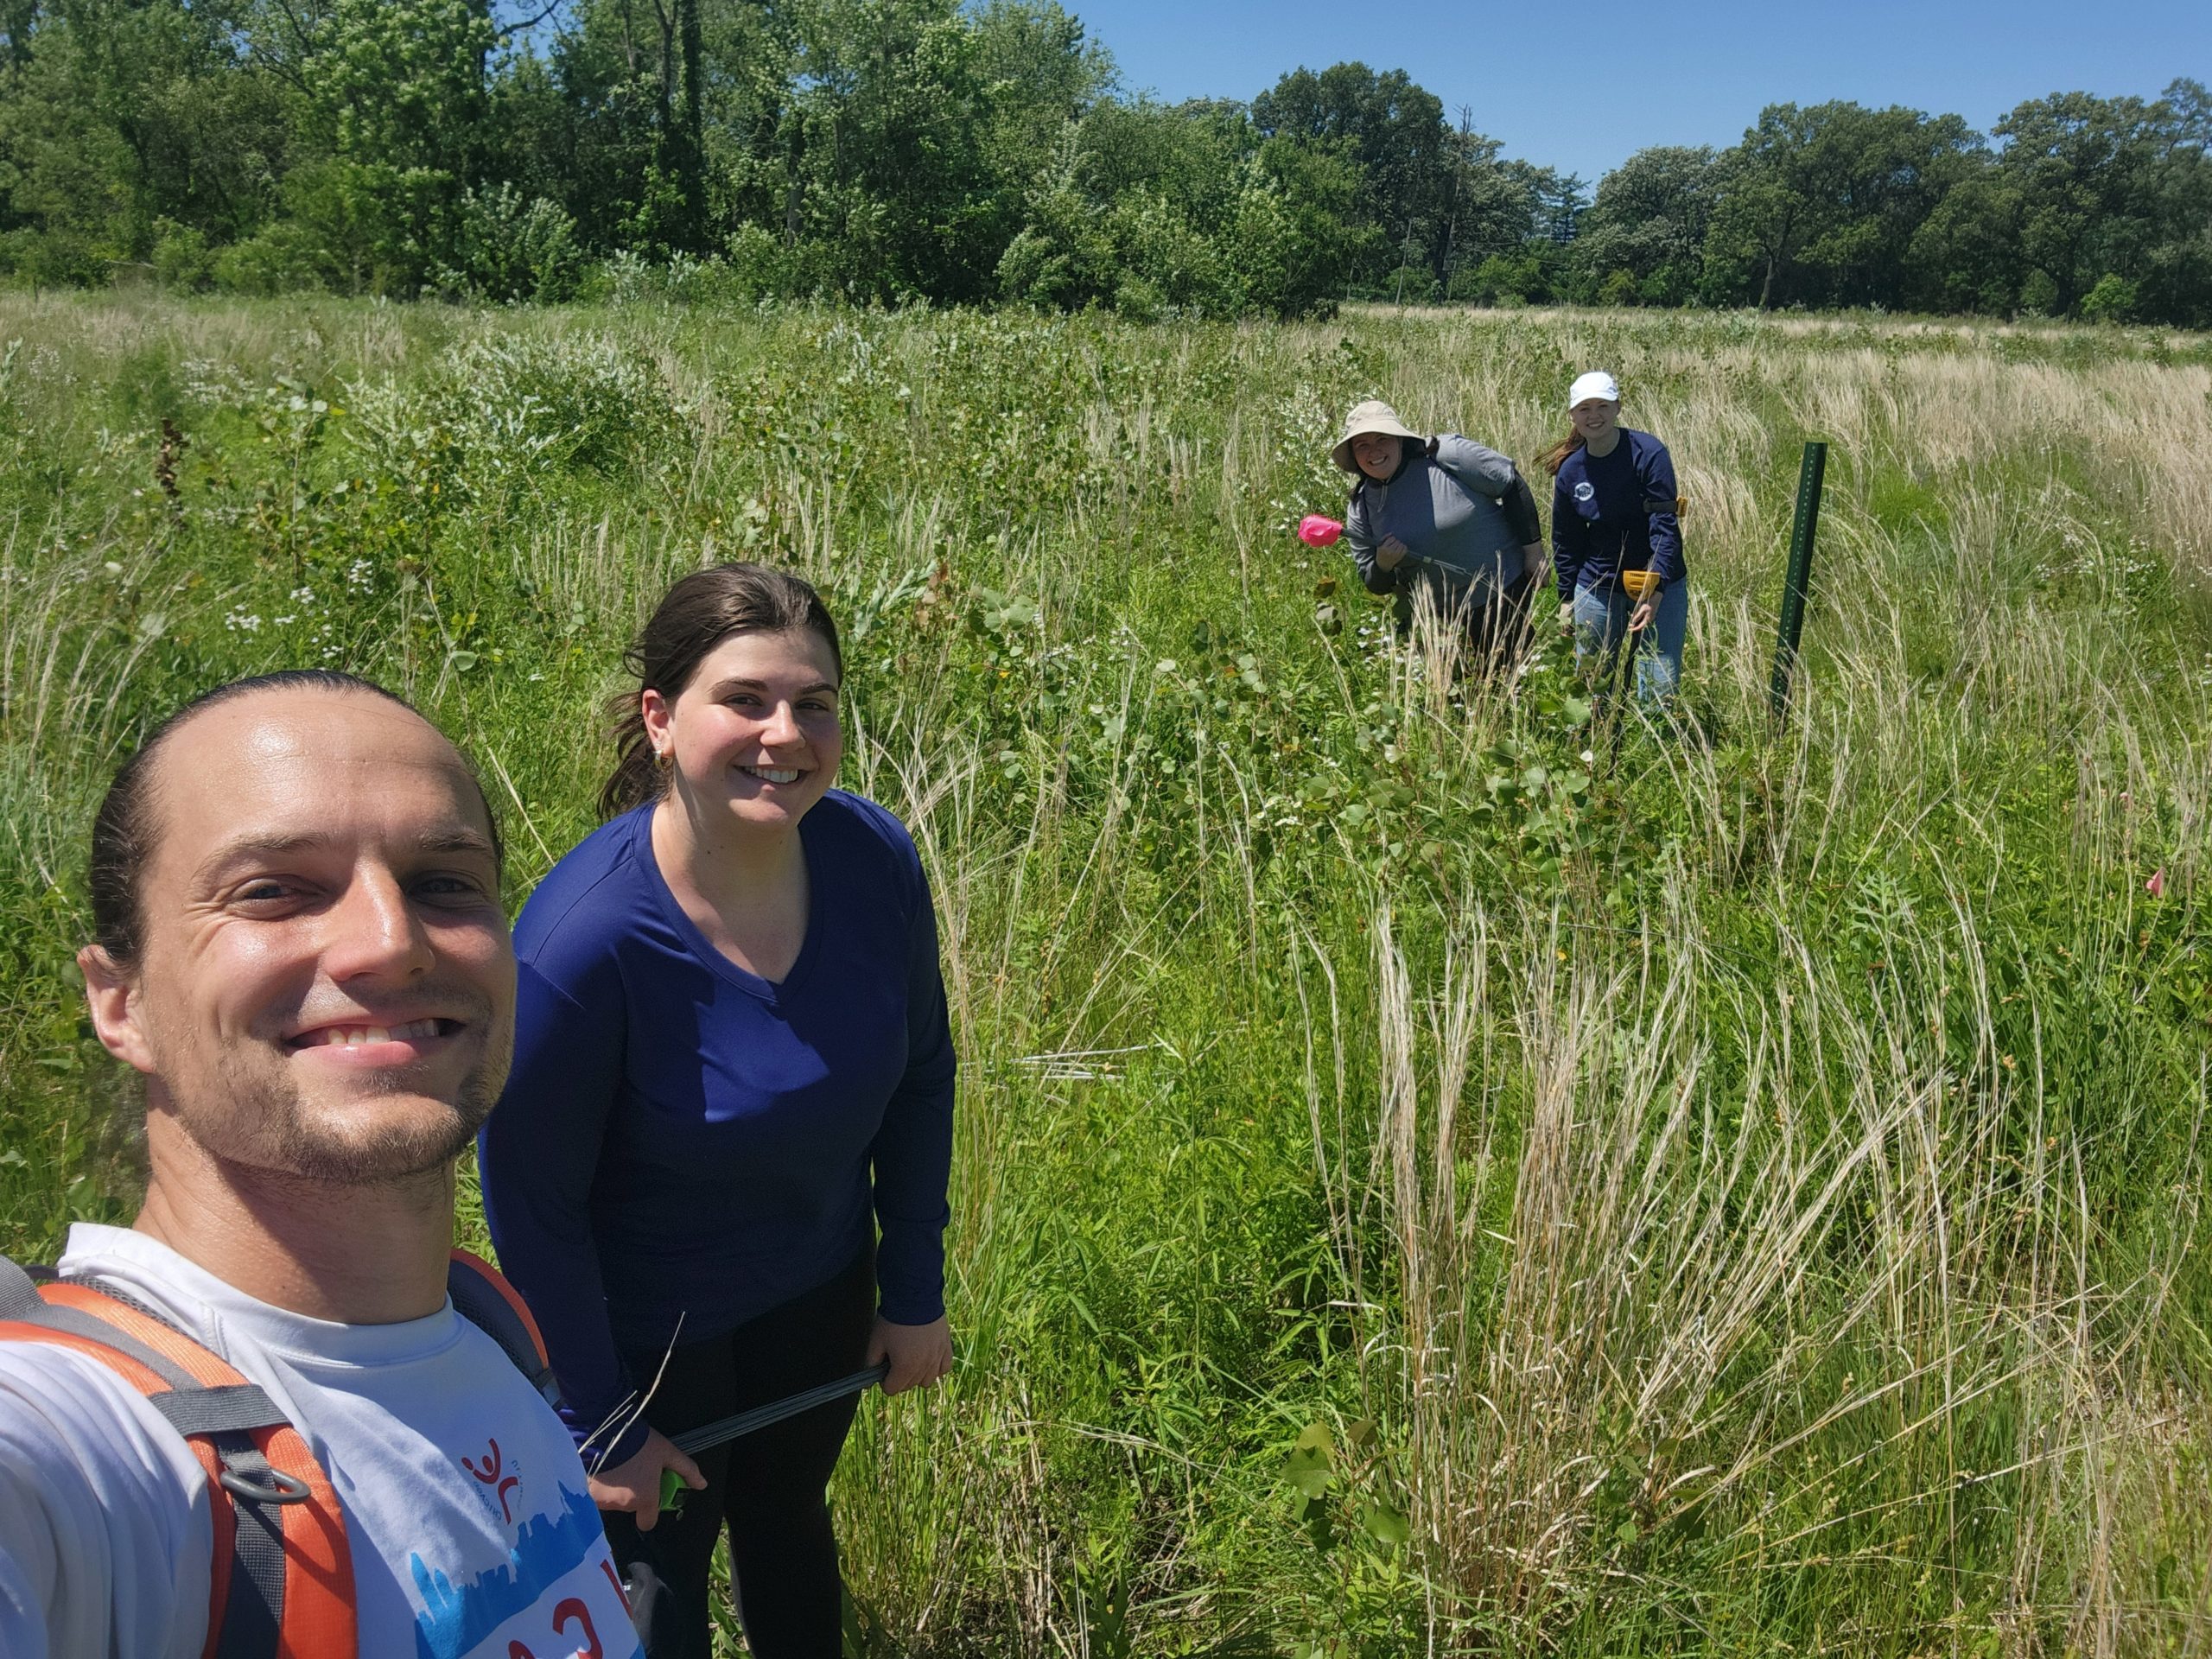
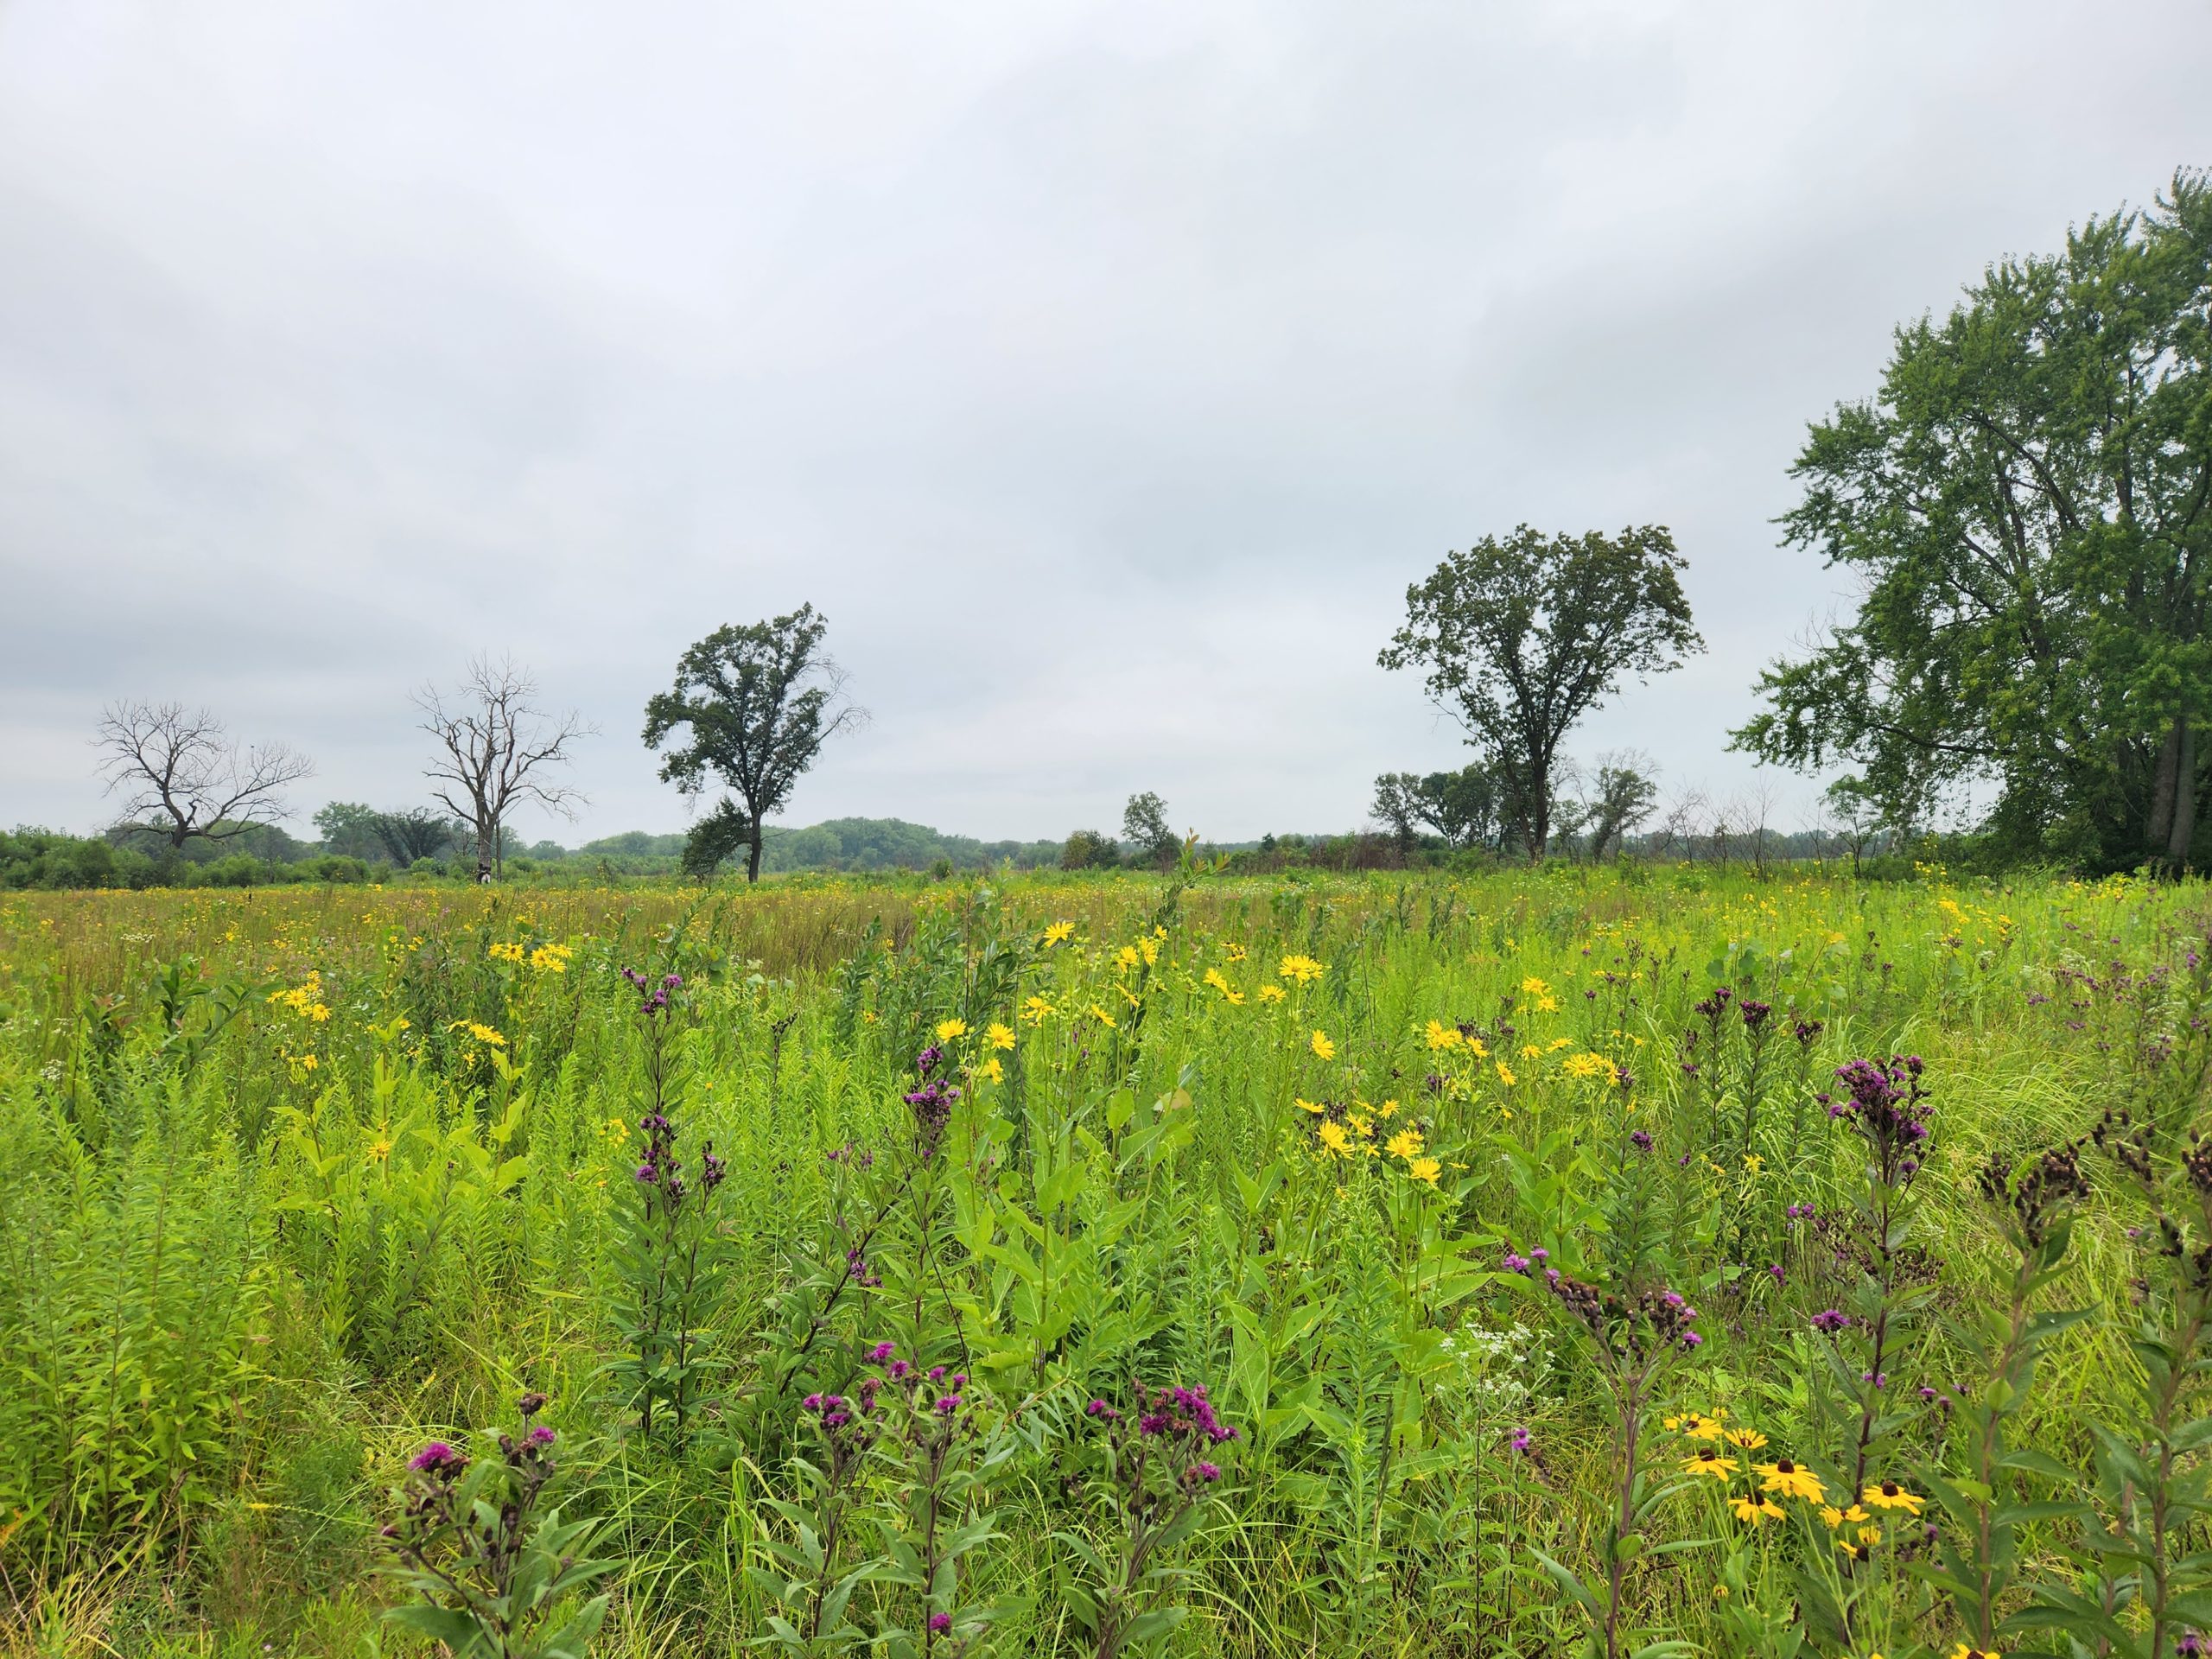
The scientist team visiting a prairie remnant field site.

Illinois is called the “Prairie State.” Historically, 60% of the state was covered in different types of prairies, or open grassy landscapes with few trees. As far as the eye could see, fields were filled with colorful wildflowers, grasses, and all the species above and below ground that rely on them. However, today only 0.01% of the prairies remain across the whole state! These undisturbed areas are known as remnant prairies, and despite their small size, they are still home to a diverse community.

What happened to the rest of the prairies? Most were converted by people into agricultural fields to grow crops for food. The soils below prairies are rich in nutrients, and the agricultural lands in Illinois today provide food consumed by millions.

Researchers identifying plants in the field to document species richness. 

Nick is a land manager whose passion is prairies. In addition to protecting and studying remnant prairies, he creates restored prairies by planting prairie plants back into agricultural areas where they were historically found. However, Nick and other land managers are finding something surprising – the restored prairies do not look like the remnant prairies. He noticed that some of the native plants come back and thrive in the restored prairies, while others do not. 

To investigate these missing species, Nick partnered with a local scientist, Mike. Mike grew up in rural Michigan and has always been fascinated with biodiversity. He is passionate about bringing back missing species, because he knows even just one missing plant can have a cascading effect through an ecosystem. For example, wild lupine plants are a key food source for the endangered Karner blue butterfly. When prairie restorations have higher diversity, we’re more likely to benefit other species.  

Nick and Mike want to figure out why some species re-establish and others do not. They thought the key might lie belowground. From Mike’s past research, he knew that many prairie plants species form beneficial relationships with microbes belowground, called mutualisms. Could the root of the problem be explained by what is happening below ground? If these mutualist partners are missing in the soil, some plant species may not be able to survive.

One mutualist in prairies is called arbuscular mycorrhizal fungi, or AMF. Plants supply these fungi with sugars from photosynthesis. AMF help plant roots gather nutrients and water from the soil. AMF are common in prairie soils, but are often missing from soil that has been used for agriculture. Agriculture removes AMF in several ways. Tractors till the soil, disturbing the fungi below ground. Chemicals may be sprayed to kill harmful microbes, but these chemicals can also kill beneficial fungi, like AMF.

Nick chose an experimental site that was historically a sandy prairie, but had been used as a farm more recently. He used AMF originating from local remnant sand prairies to add to the experimental plots. Nick used a seed spreader to launch the AMF along the base of the plants. He set up three treatments that differed in how much AMF was applied: 1) a low level of AMF, 2) a high level of AMF, and 3) a control where no AMF was added. This setup was repeated 5 times in experimental blocks, or similar rectangular plots. 

After the growing season, Mike and his lab identified the plant species in each block. To help out, Jeremy joined Mike’s lab after finishing graduate school. He was a good fit because he had been working with similar data. Jeremy used the full dataset to calculate species richness, or the number of different plant species in each block. 

Featured Scientists: Mike Grillo and Jeremy Davis from Loyola University-Chicago and Nick Budde from the Forest Preserve District of Will County, Illinois. Written with Kerrie Rovito and Katarina Alvarado from Chicago Public Schools. Funding from the Walder Foundation.

Flesch–Kincaid Reading Grade Level = 8.8

Additional Teacher Resources:

If you would like to show students a remnant prairie that is close to where the scientists collected their data, you can see a video here.

You can see a video of Kankakee Sands, the area where the data were collected, here.

Videos about mycorrhizal fungi:

Tiny but mighty: leaf miners take on aspen trees

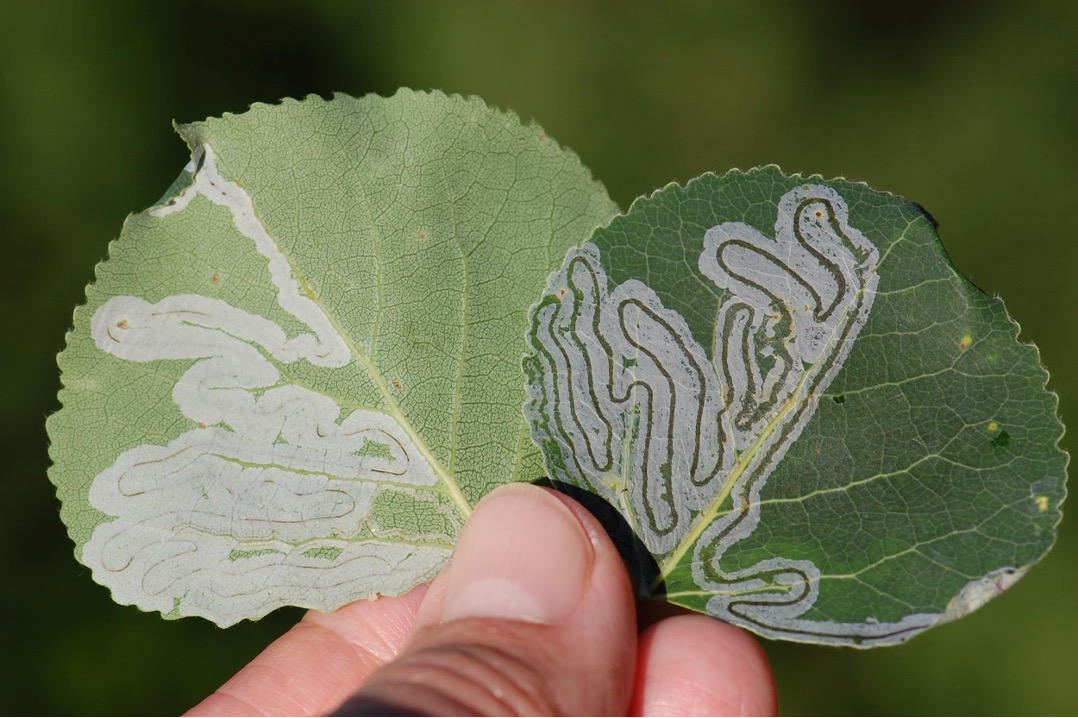
Leaf mining trails on the back (left) and front (right) of aspen leaves. Photo Credit: D. Wagner.

Caterpillars might look small, but can they actually be harmful?  Yes, if there are enough of them! Aspen leaf miners are moths as adults, but before that, aspen leaf miner caterpillars are incredible herbivores. In the spring, they lay their eggs on the surface of leaves, and they sink into the outer cell layer. When they hatch, the caterpillars quickly get to work. Using their blade-like mouth parts, they slash through the surface cell layer and drink the contents that are released. They leave a trail of silver, damaged cells in their path.

In recent years, aspen leaf miners have been increasing in numbers in Alaska and Canada. Aspen trees are an important component of the boreal forest, providing nutritious food for wildlife, supporting a diverse ecosystem, and capturing carbon dioxide (CO2) from the atmosphere at a high rate. Jenifer and Diane are two plant biologists who want to know if the aspen leaf miners are affecting leaves’ ability to do their job. Trees rely on their leaves to capture light energy for photosynthesis. During this process, cells convert CO2 gas from the atmosphere into sugar. Gases enter and leave through pores called stomata – CO2 comes in, and water vapor leaves. 

To avoid excessive water loss, leaves carefully control when the stomata are open. Stomata are surrounded by two sausage-shaped cells, called guard cells. The default position keeps the stomata closed. Different signals can cue the guard cells to open, but if too much water escapes, the stomata will close up again. 

In aspen trees, the guard cells are only on the bottom of the leaf. Jenifer and Diane suspected that leaf miners on the bottom side of the leaf would be destroying guard cells as they feed. They thought that if guard cells are no longer able to function properly, they would get stuck in the default closed position. This would limit photosynthesis because they would no longer be able to take in CO2 or let out water vapor.

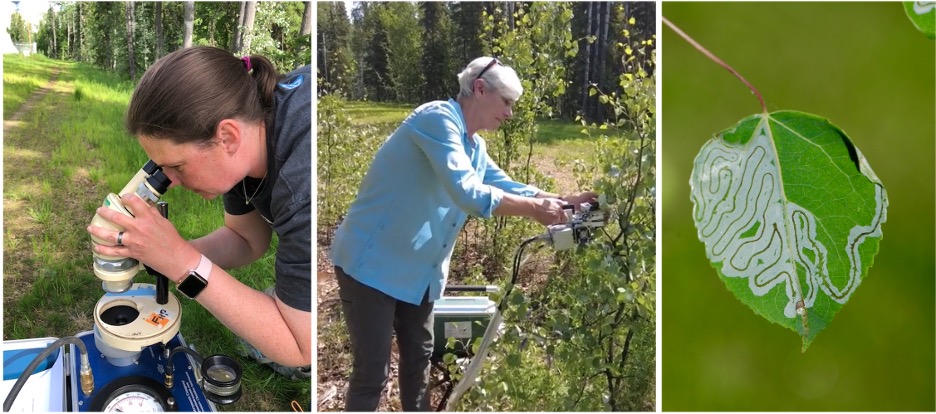
Left and middle: Diane and Jenifer taking measurements in the field; Right: a mined aspen leaf. Photo credits left to right: D. Wagner, D. Kind, D. Wagner.

To test their idea, Jenifer and Diane set up an experiment on the University of Alaska campus in Fairbanks. Jenifer and Diane let leaf miners lay eggs on leaves, like normal. Each caterpillar is so small that it stays on a single leaf side to eat. Jenifer and Diane removed eggs and marked about 10 leaves on each of 14 aspen trees. They randomly assigned each leaf to one of three treatments by removing the leaf miner eggs from either the top, bottom, or both sides of the leaves. To remove eggs from leaves, they wore magnifying headsets, just as a jeweler might wear, and carefully scraped each tiny egg off the leaf using a sharp probe. By doing so, they had leaves that were 1) mined on the bottom surface only, 2) mined on the top surface only, and 3) unmined (control) leaves. 

After the leaf miner caterpillars were finished feeding for the season, Jenifer and Diane came back to assess the damage. To understand the effect of the leaf mining damage on the leaves, they measured the photosynthesis and stomatal conductance of water vapor in the different treatments. To do this, they used a special piece of equipment called a portable infrared gas analyzer. The analyzer has two chambers – one that can be clamped onto a single leaf and one that is a control with no leaf. Gas is pumped through both chambers, and the gas concentrations from the leaf and the control are recorded and compared. The difference in CO2 concentration between the chambers is used to calculate the rate that CO2 is taken in by the leaf from photosynthesis. The difference in water vapor is used to measure how easily water vapor is passing out of the leaf through the stomata. 

Jenifer and Diane predicted that if the stomata are stuck closed, less CO2 would be taken from the atmosphere and less water vapor would be lost from the stomata. In other words, leaves with leaf miners on the bottom would have lower photosynthesis rates and decreased stomatal conductance of water vapor compared to the other treatments.

Featured scientists: Jenifer Wheeler (she/her) and Diane Wagner (she/her) from the University of Alaska Fairbanks. Written with Denise Kind (she/her).

Flesch–Kincaid Reading Grade Level = 9.3

Additional Teacher Resources:

There are short videos with background information on the study of aspen leaf miners in Alaska:

A scientific journal article about this research project: https://doi.org/10.1093/treephys/tpz109. Access the pdf here.

An additional educational module on the effects of the aspen leaf miners is available through the AKDatUM website.

The original data file can be found on the Bonanza Creek Long Term Ecological Research website, in the Data Catalog. Under Title, search for “leaf miner feeding damage”. There are many additional leaf physiology variables included in the data set. 

Pollination matters

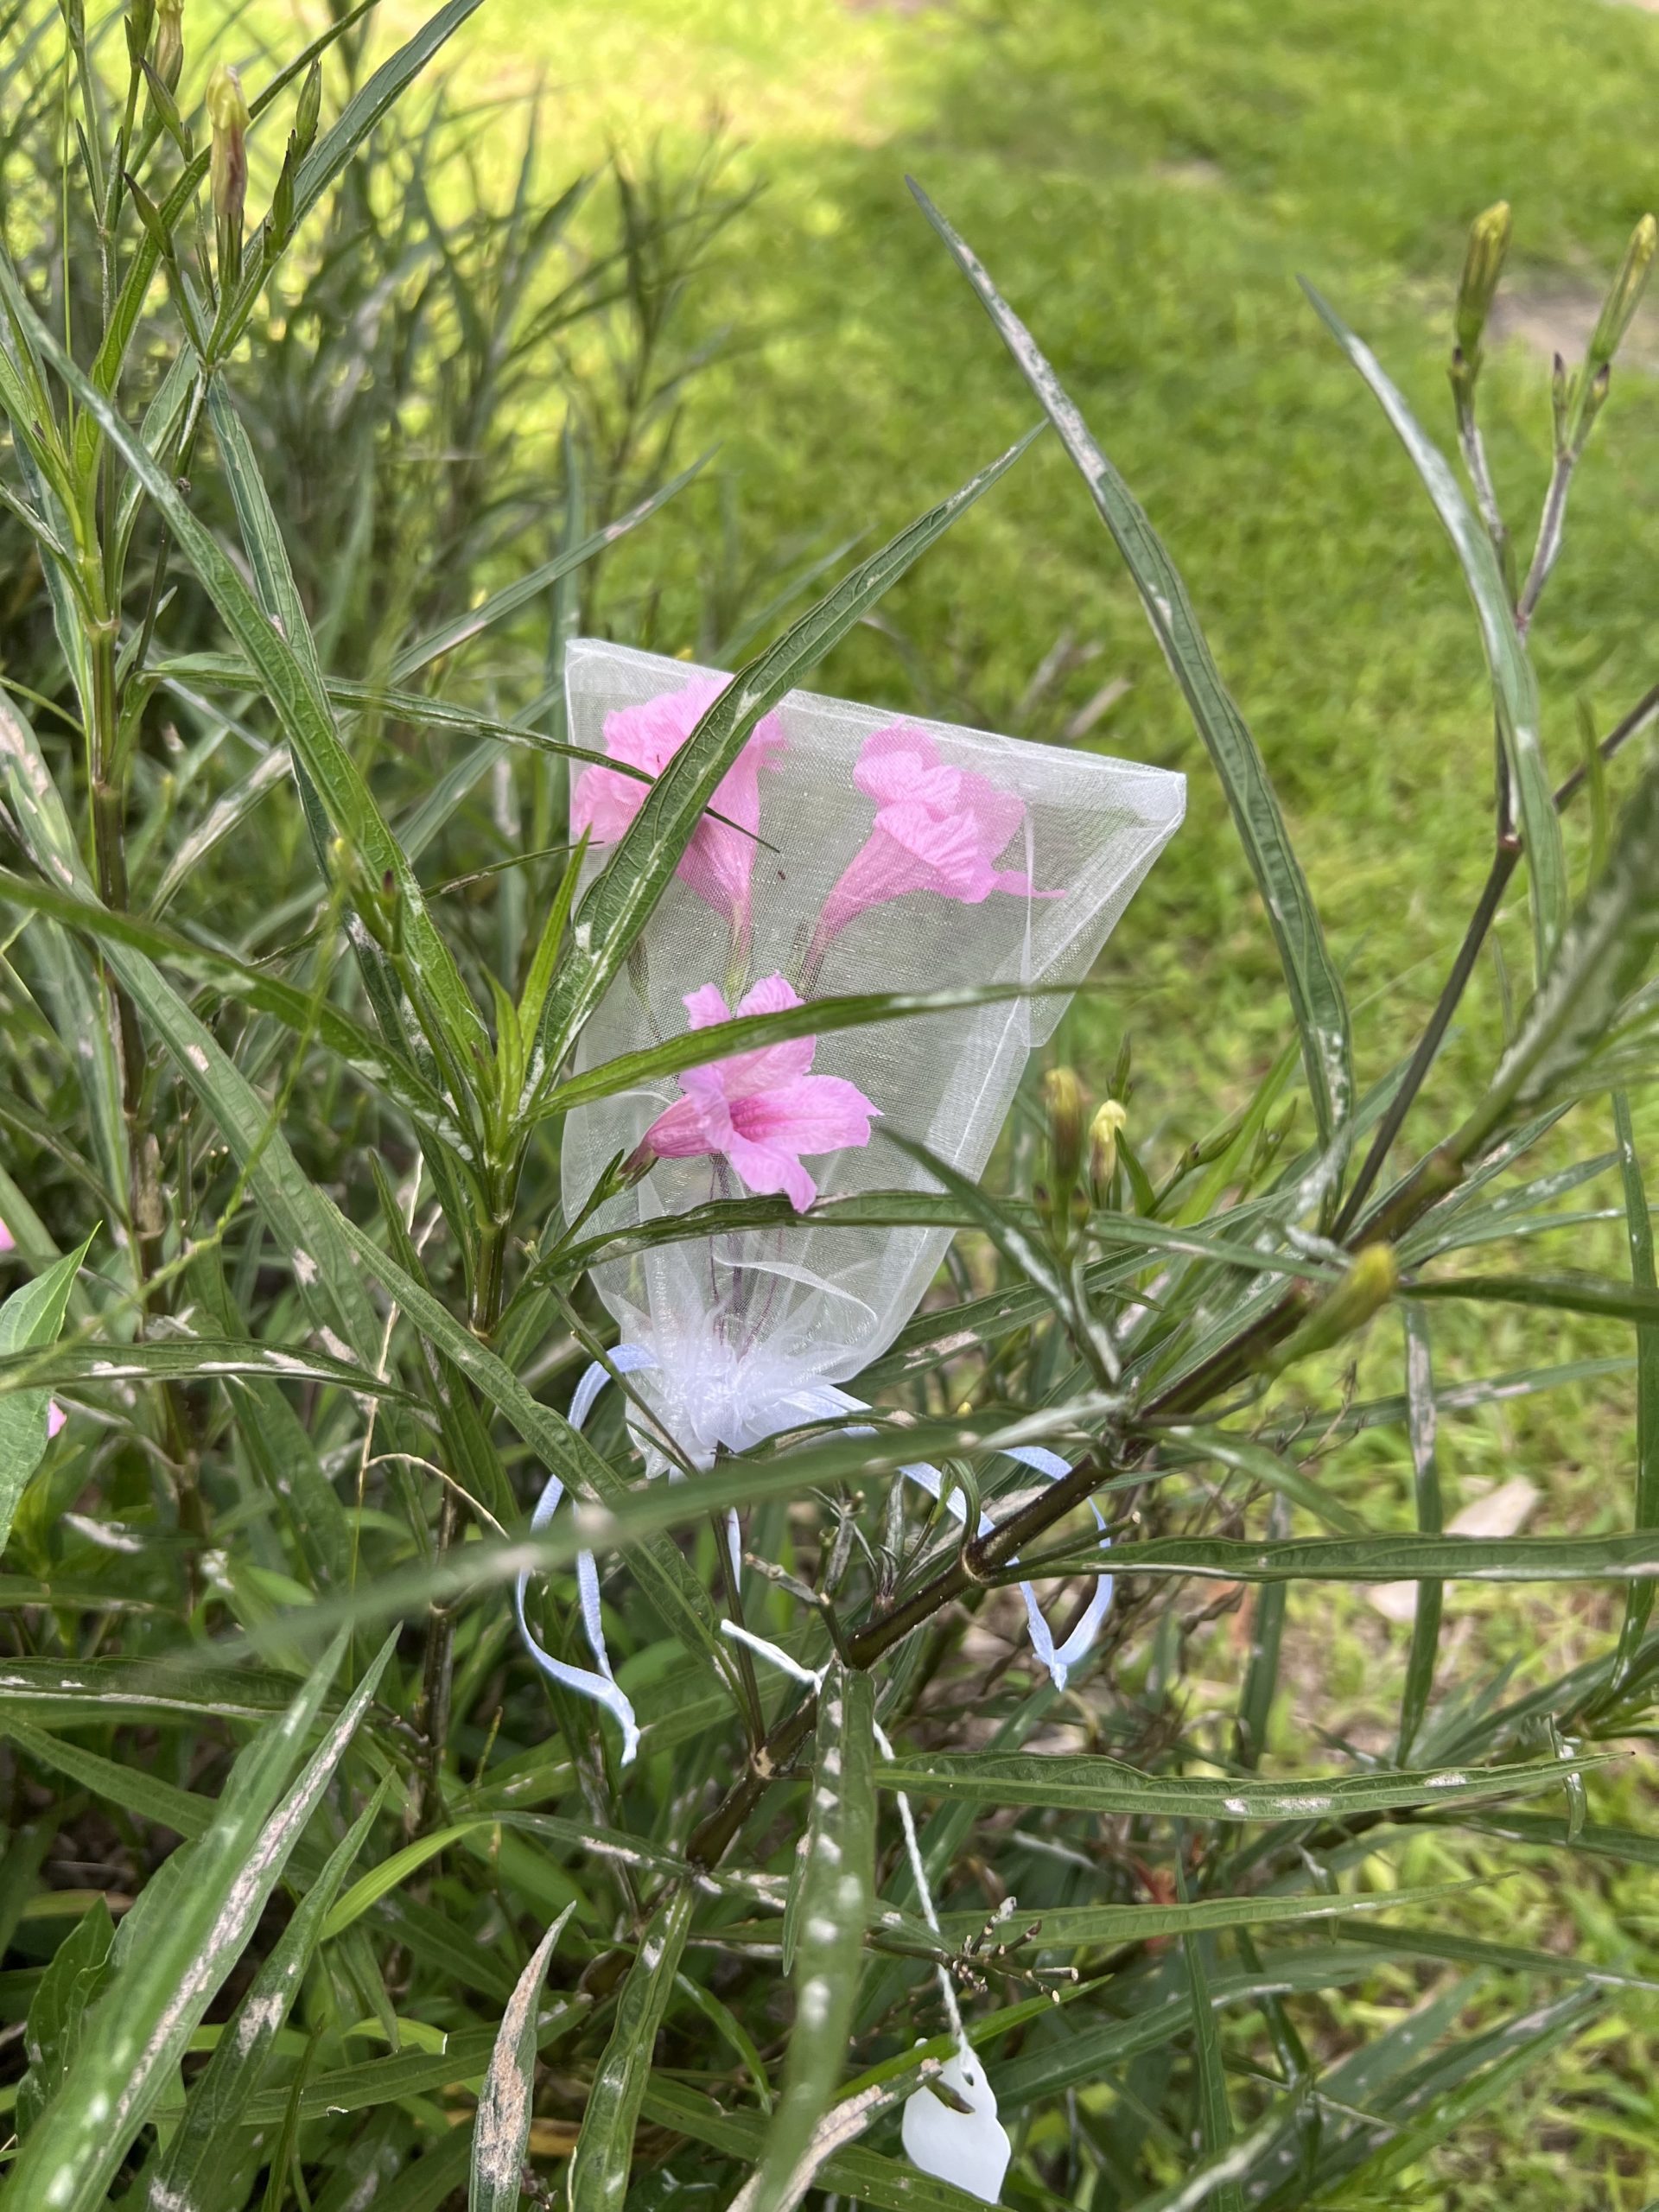
A Mexican petunia in the bagged self-pollination treatment.

The activities are as follows:

Pollination is one of nature’s most important processes. Without pollen moving from one plant to another, many plants would not be able to produce fruits or seeds. Without pollination, we wouldn’t have food like apples, strawberries, or even chocolate! But not all pollination works the same way. Some plants rely on pollinators like bees and butterflies, while others can reproduce without any help at all. Scientists are still exploring why plants have these different strategies.

As a science teacher, Cynthia is always looking for ways to bring real science into her classroom. To learn more about the work of scientists, she joined a summer research program. While there, she had the opportunity to design and carry out a study on pollination in a plant species, Mexican petunia.

Mexican petunias are a flowering plant found in gardens, parks, and wild spaces. They have bright purple flowers. This plant has two ways it can be pollinated, called pollination methods. First, insect pollinators visit and move pollen. When pollen is moved from one plant to another, this is called outcrossing. Second, these plants can self-pollinate, meaning pollen from a single flower can pollinate that same flower. 

Pollination methods make a big difference for plants. Outcrossing mixes the genetics of two different plants together, which creates new genetic combinations that may help offspring survive and thrive. In contrast, self-pollination means the genetics of the plant are the same as the parent plant and no new genetic combinations are made. Plants that use self-pollination don’t need to rely on pollinators, however many times the seeds they produce are not viable and are not able to grow. 

Cynthia predicted that outcrossing would produce the most fruits and seeds, and flowers that relied on self-pollination would produce fewer seeds. She designed a garden experiment where she could control how Mexican petunias were pollinated. To set up her study, she used four different treatments. 

Bagged – Cynthia put mesh bags around the petunia flowers. This prevents pollination from other plants, so this treatment shows whether flowers are able to successfully self-pollinate on their own.

Open pollination – Cynthia left these flowers open to visits from insects. These plants could be self-pollinated or outcrossed.

Self-pollinated by hand – Cynthia hand-pollinated these flowers using pollen from another flower on the same plant. This treatment shows whether the plant produces fruit when the flowers are self-pollinated by hand.

Outcrossed by hand – Cynthia hand-pollinated these flowers with pollen from a different Mexican petunia plant. These plants are all outcrossed.

Cynthia monitored the Mexican petunia plants in her four treatments for three weeks. She checked the flowers every few days to see which ones developed fruit. If a flower made a fruit, she counted the number of seeds per fruit. In the open pollination treatment, a few times the fruit opened and launched out its seeds before Cynthia could count them, meaning she could get fruit data from the flower, but not a seed count. At the end of her experiment, she had collected data on percent fruit development, or the chance of successful development of a fruit from a flower, and the number of seeds produced within those fruits, called seed count.

Featured scientist: Cynthia Nuñez from Florida International University

Flesch–Kincaid Reading Grade Level = 8.8

The science of stamen loss

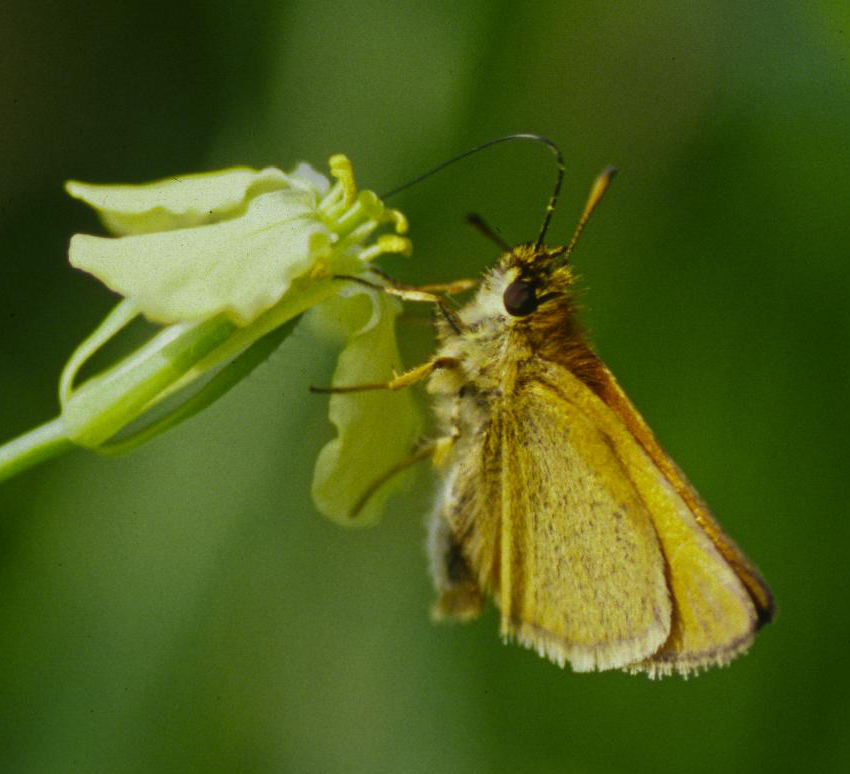
A pollinator visiting a mustard flower, drinking nectar and picking up pollen from anthers.

The activities are as follows:

Plants and animals have adaptations, or traits that help them survive and pass on more of their genes to the next generation. Flowers are a key adaptation for plants because they help the attract pollinators and reproduce.

Flowers come in many different shapes, sizes, colors, and forms. While flowers as a whole are an adaptation, traits within flowers are often adaptations themselves. For example, different flower colors attract different types of animals to the plant. Some flowers make nectar that gives animals a food reward for visiting. Other plants have small flowers with no petals so that pollen can be easily picked up and travel by wind.

Many of the animals that visit the plant serve as pollinators. Pollinators help plants reproduce by bringing reproductive parts together. Pollination happens when pollen from the stamen reaches the stigma. This is needed for seeds to form. By moving pollen, pollinators help plants make more seeds. More seeds lead to more plants in the next generation. Small differences in flower traits can change which plant is the most successful at reproducing and setting seed.

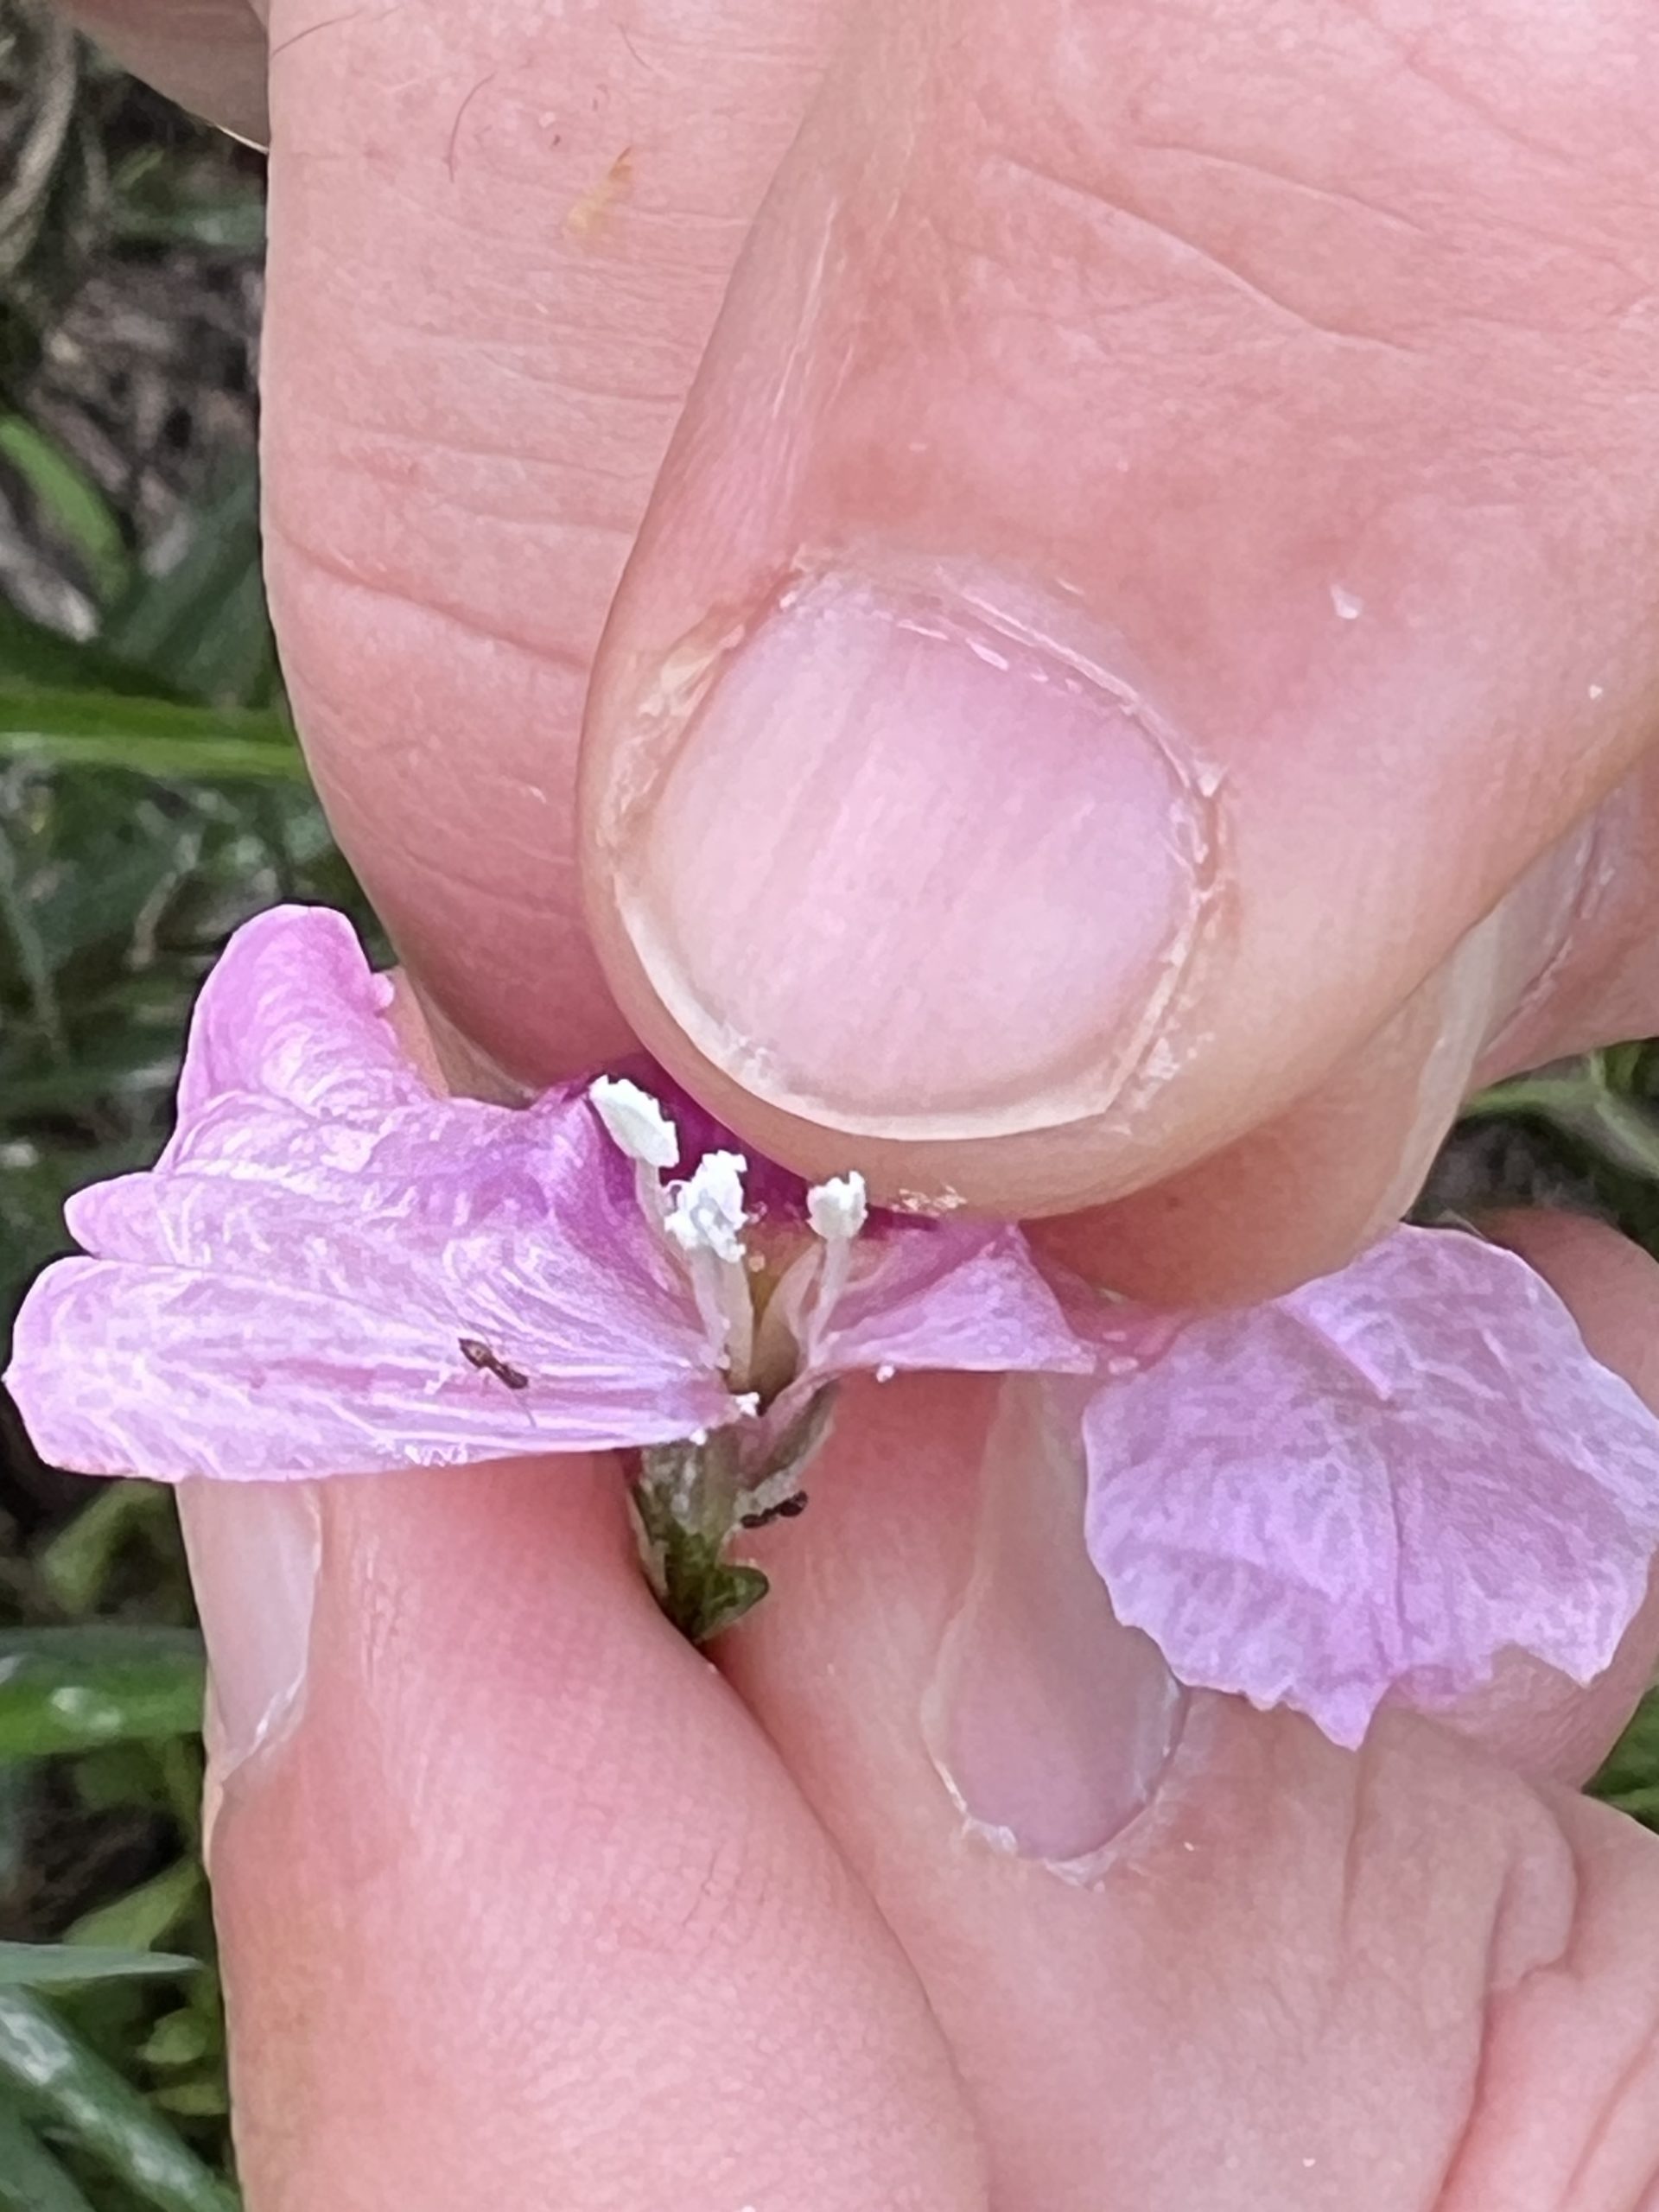
Jeff is a scientist studying a very particular flower shape seen in plants of the mustard family. Most plants in this family have flowers with 4 long stamens and 2 short stamens. No other plants have this shape, and no one knows why! The short stamens are a particular mystery.

Jeff wanted to see why mustards might have these short stamens. He thought that short stamens are an adaptation because they make it harder for pollinators to reach the pollen, so that more pollen would be left over for later pollinators. This might be beneficial because the first pollinator visiting the flower wouldn’t be able to take all the pollen, leaving none for the following visitors. If his hypothesis was correct, he predicted that short stamens would have less pollen removed with each pollinator visit compared the long stamens.

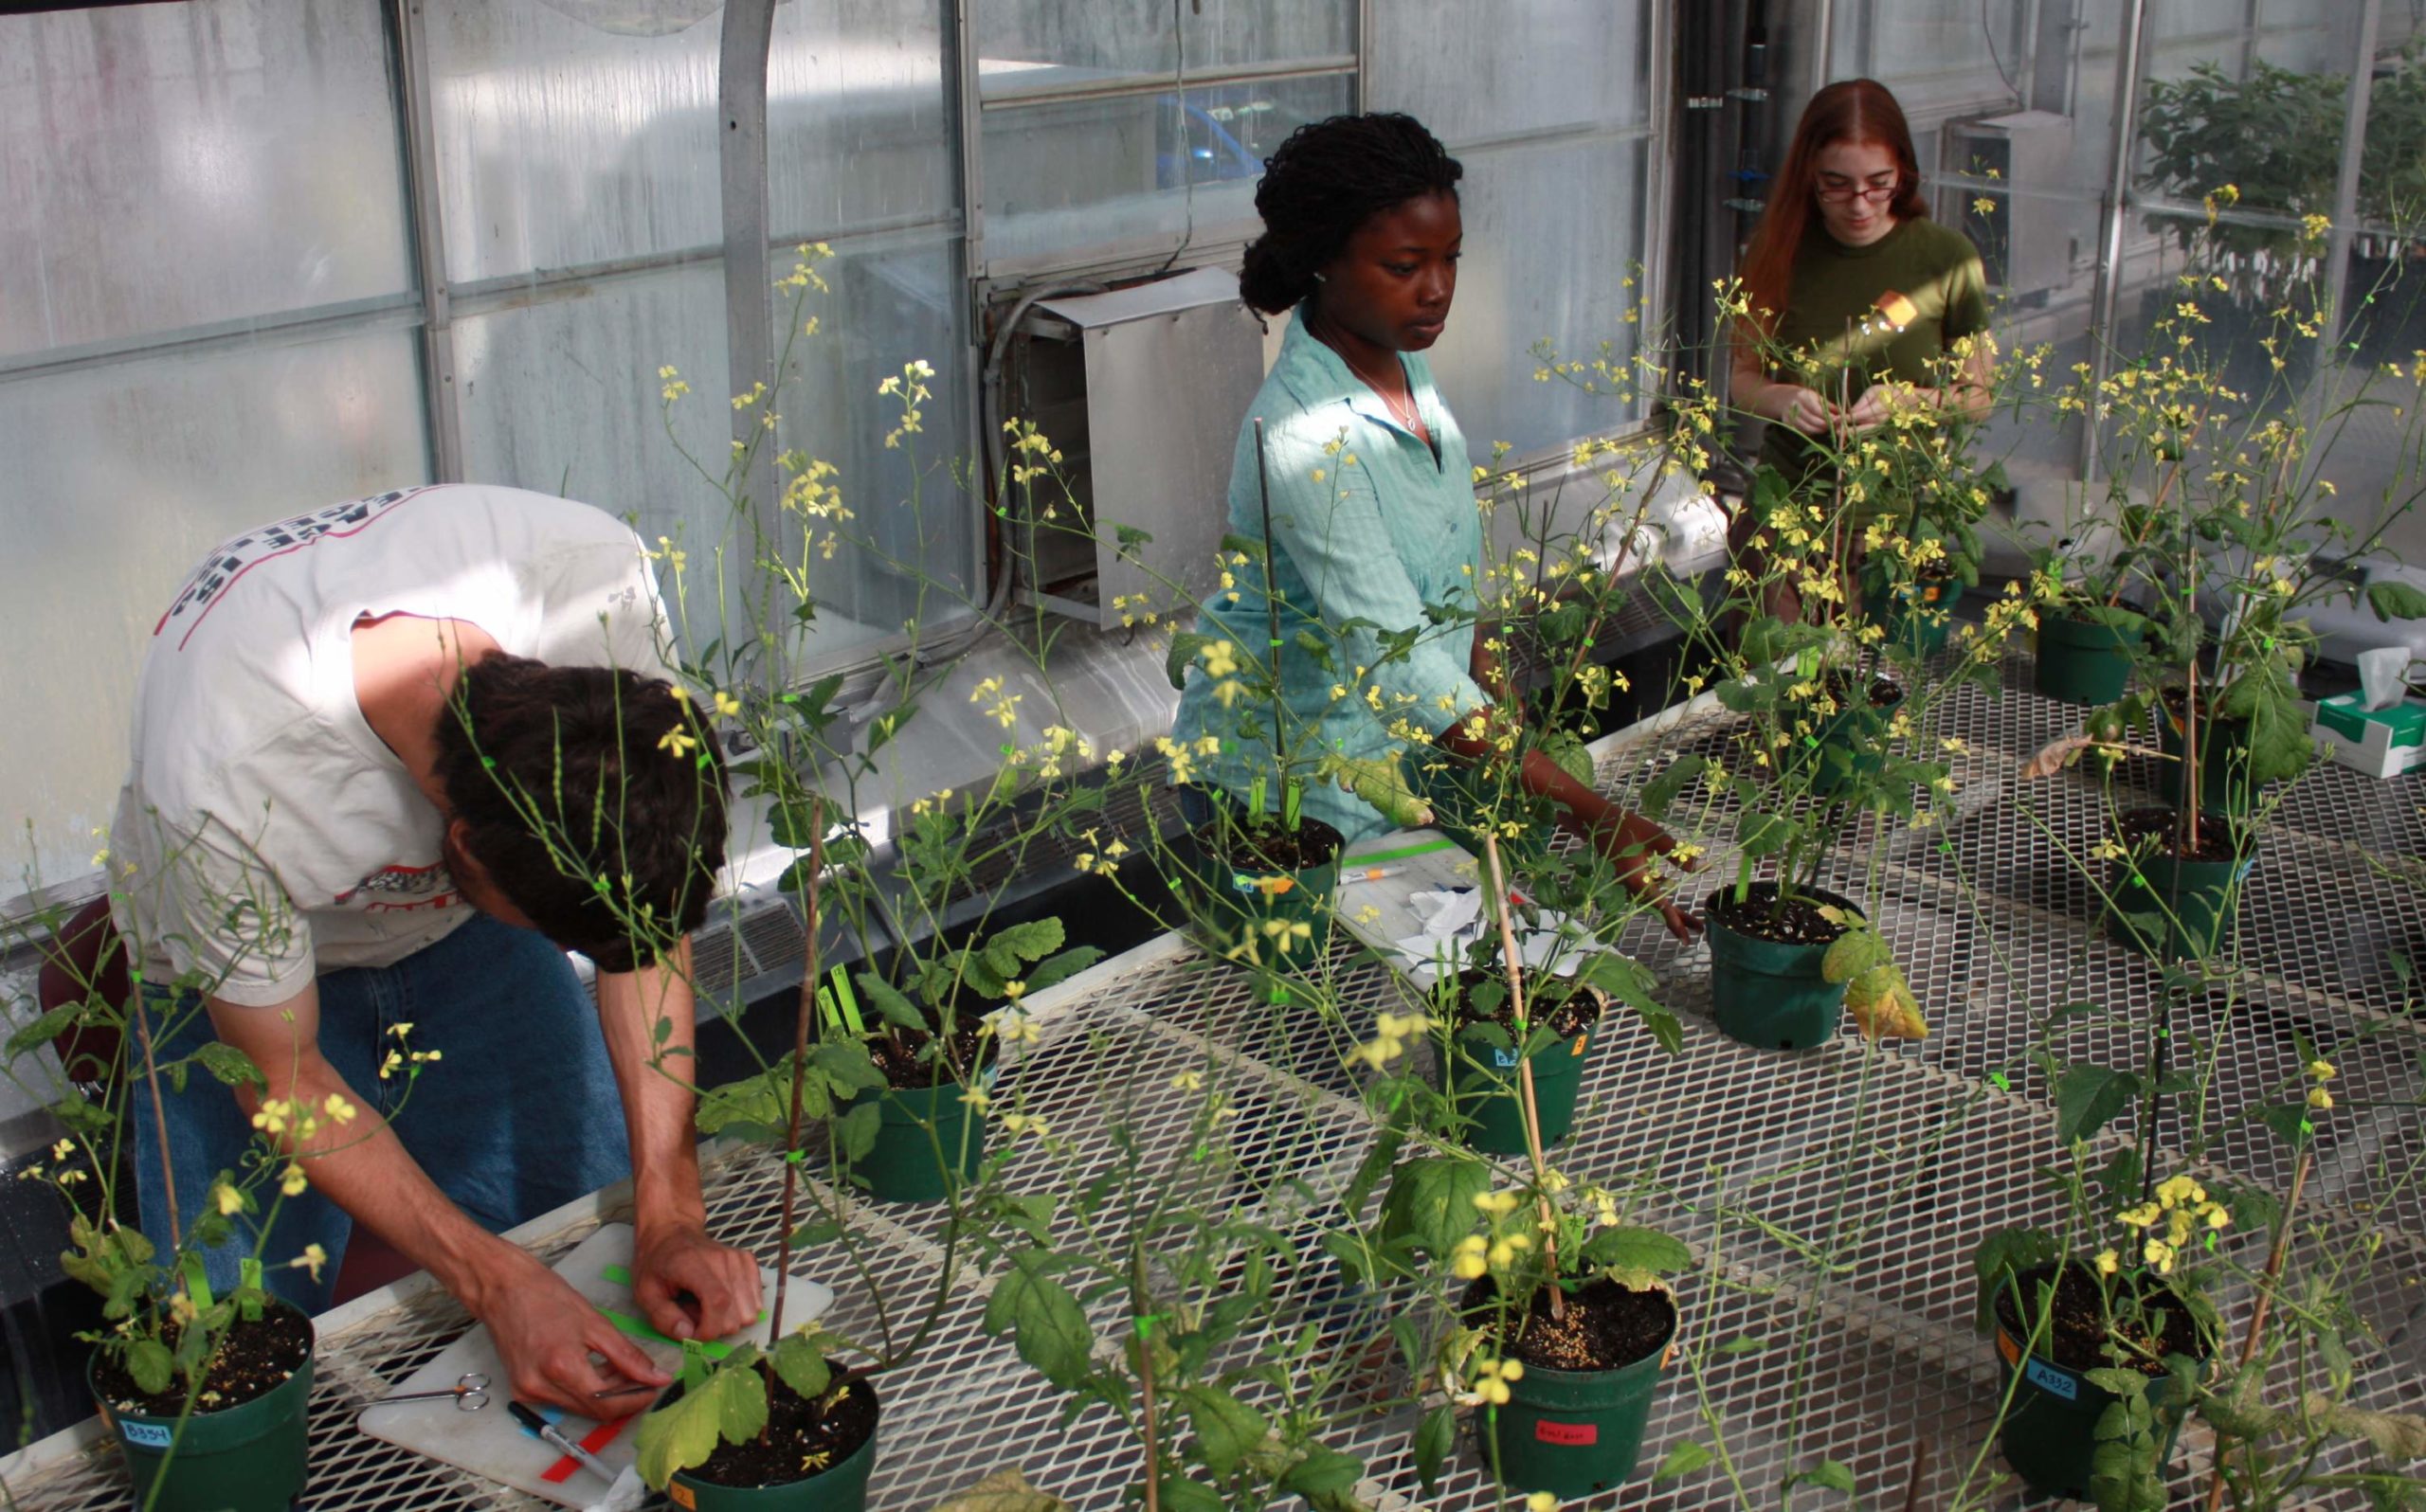
Members of the Conner Lab taking measurements of pollen found on the anthers of short and long stamens.

To collect his data, Jeff and other scientists in his lab needed to measure how much pollen was removed by pollinators on short and long stamens. To do this, they grew mustard plants in the greenhouse and let them flower. This made sure no pollinators could visit the plants before the experiment. Next, they exposed the plants to the three most common pollinators for mustards – bumblebees, small bees, and syrphid flies. To test honeybees, plants were put into flight cages with bees inside. To test small bees and syrphids, plants were put outside. Pollinators chose the flower to visit. After each visit, the lab counted the pollen on the visited flower. They then compared it to the amount of pollen on a flower that was not visited. They used these values to calculate the percent pollen removed. This was repeated for short and long stamens.

Featured scientists: Jeff Conner (he/him) from the W.K. Kellogg Biological Station. Written with Kirsten Salonga, Justice High School, Research Experience for Teachers.

Flesch–Kincaid Reading Grade Level = 7.6

Additional teacher resource related to this Data Nugget:

The data featured in this activity has been published. If you are interested in having students read primary scientific literature, they can complete this Data Nugget and then explore the full study here: 

Stormy shorelines

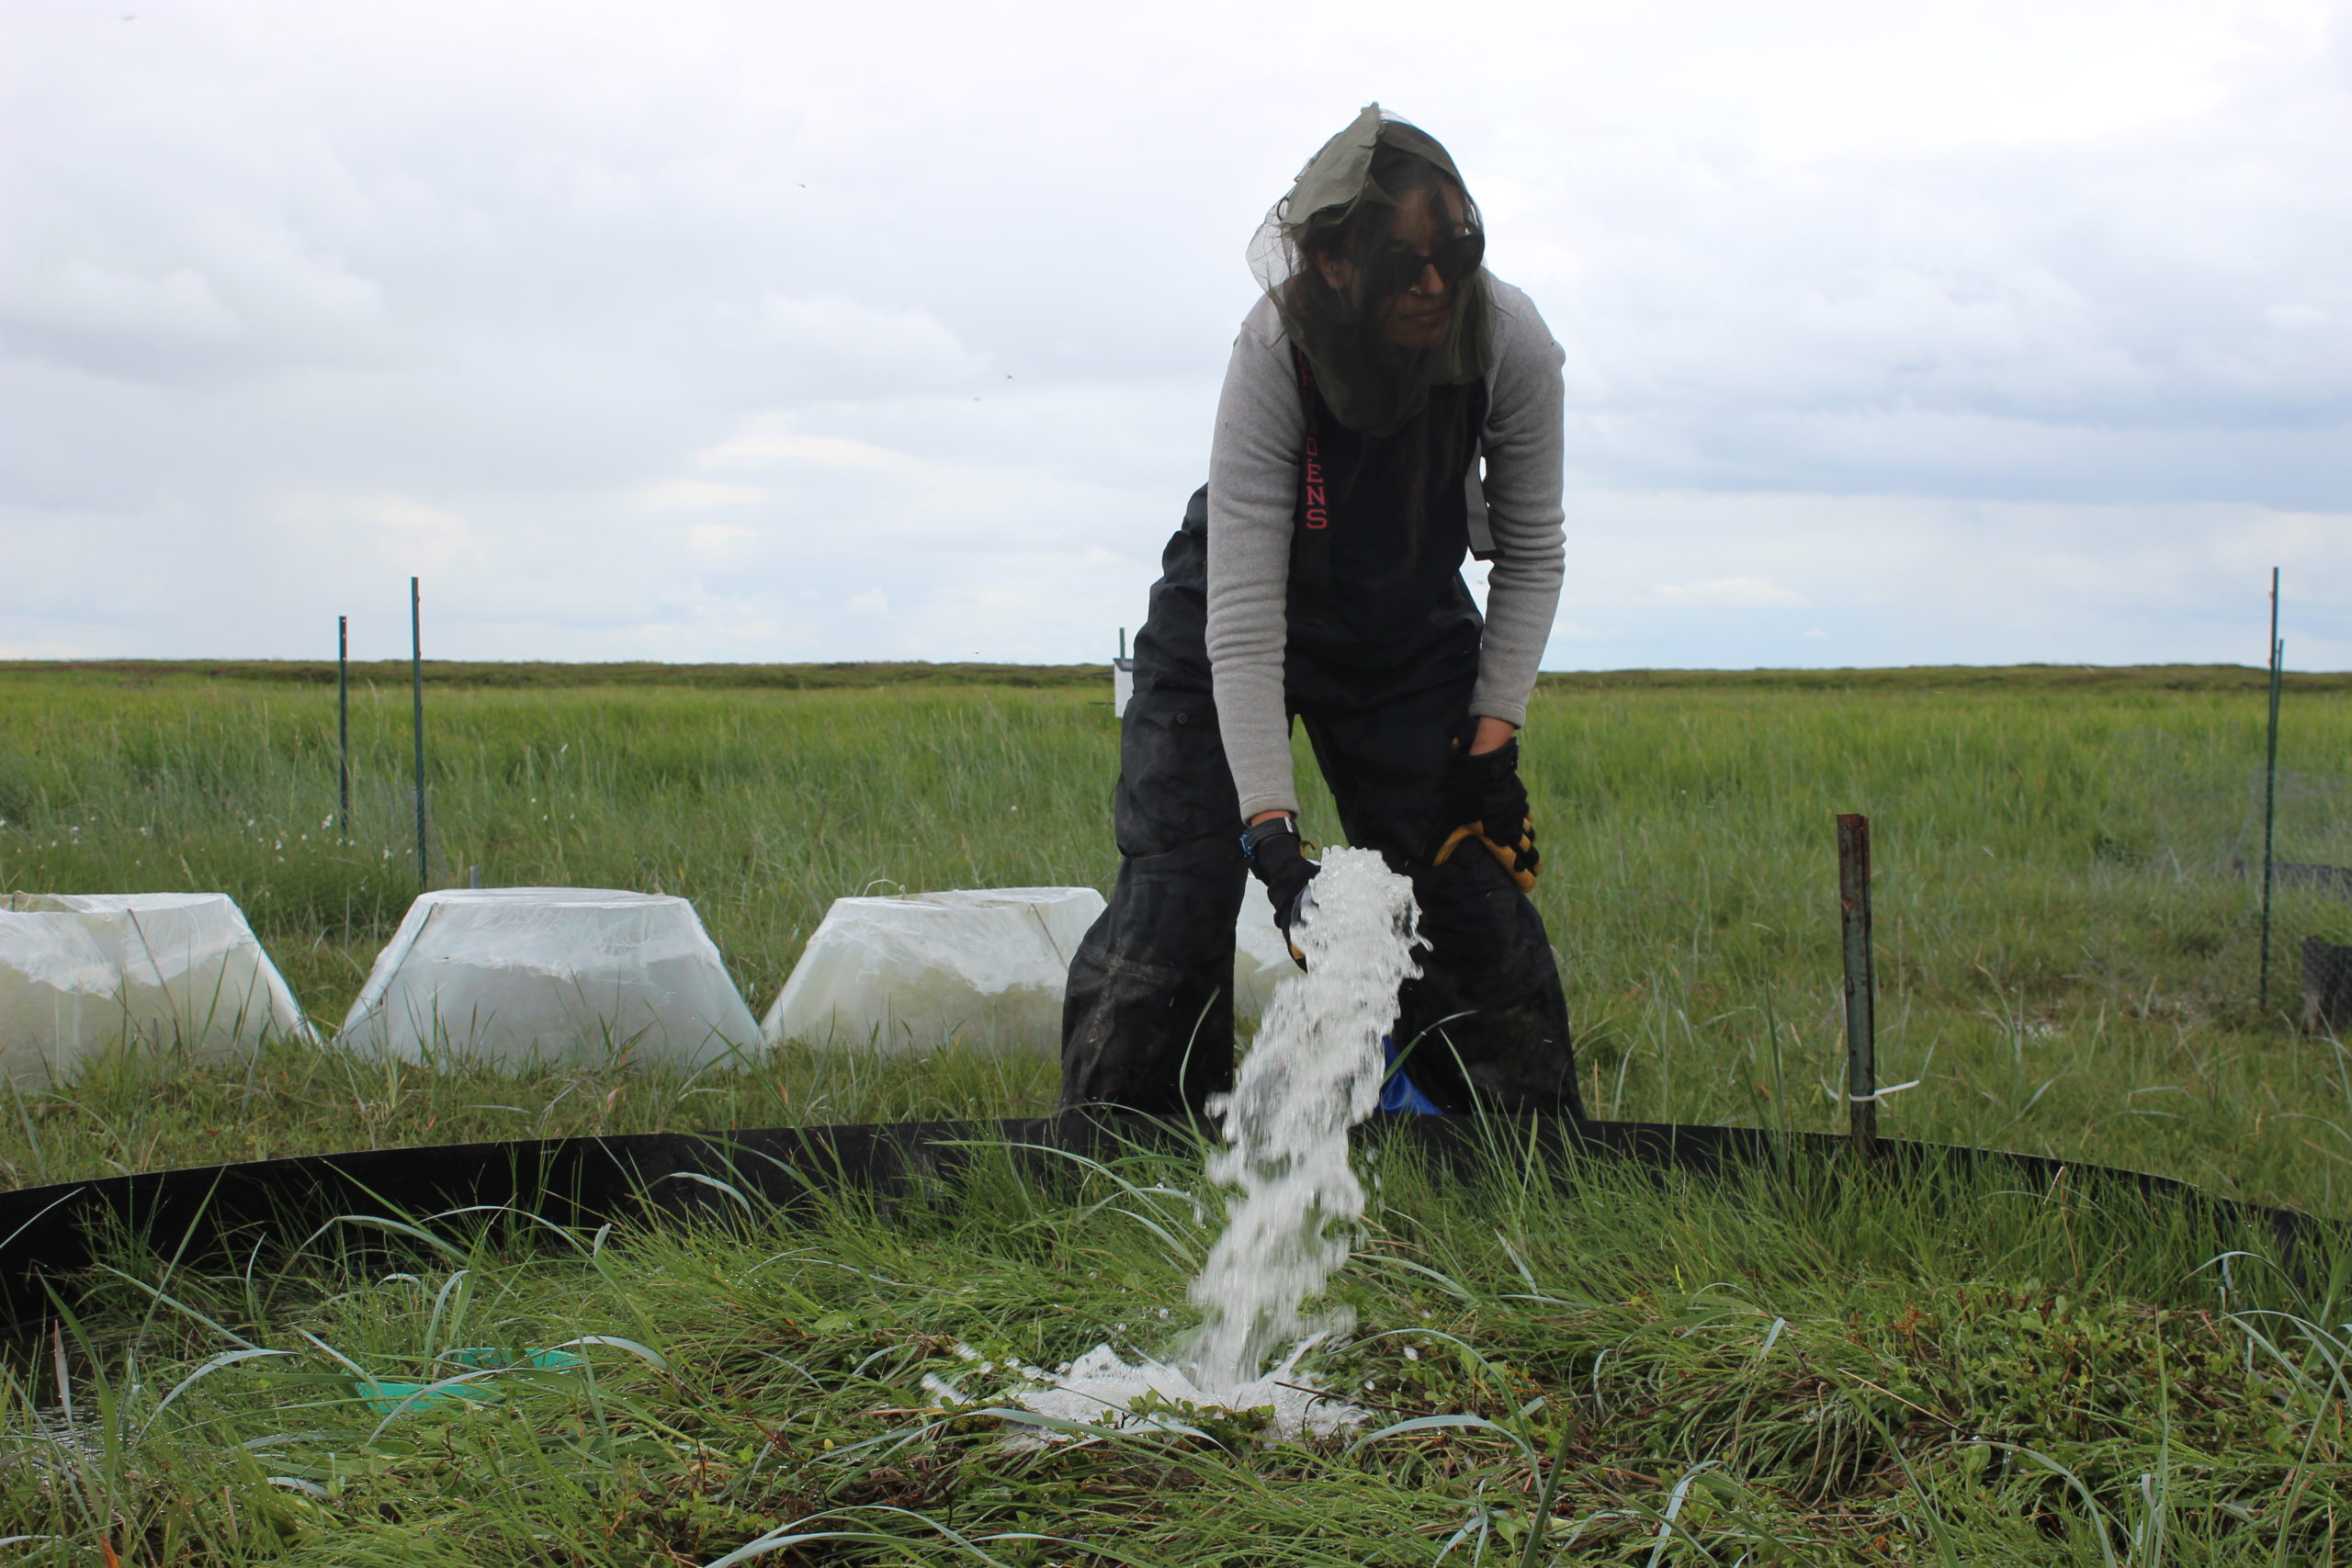
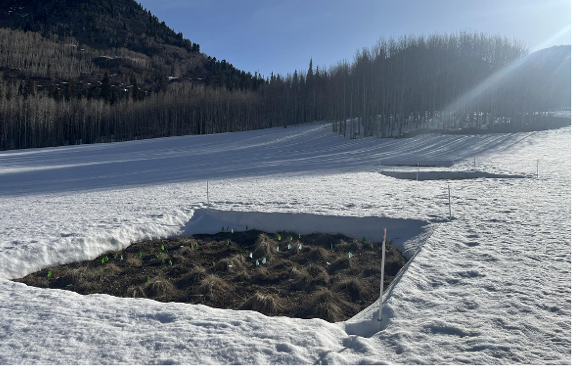
A scientist adding water to simulate flooding.

The activities are as follows:

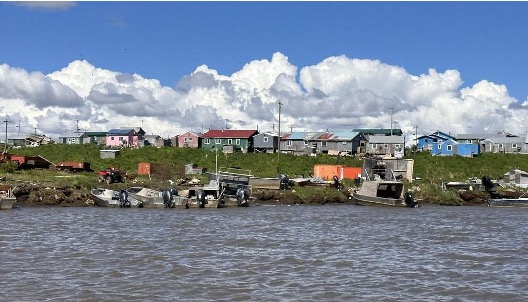
Chevak is a village that sits along the Ningliqvak River in Alaska. The area around the village is a flat coastal wetland, a landscape of winding river channels, marshes, and salty lakes. In the Yup’ik language, this low-lying terrain is called maraq. Here, salt-tolerant grasses and sedges thrive in an environment with brackish water, which is saltier than fresh water, but less salty than sea water. These wetlands serve as nesting grounds for waterfowl during the spring and summer months.

Further upland, the higher ground that sits roughly three meters in elevation is called nunapik, meaning tundra. Brackish water does not usually touch these areas. The tundra has many freshwater lakes and supports a different plant community, rich with forbs, shrubs, and lichen. Because it experiences less flooding, more types of plants can live in the upland tundra, providing important resources for food and medicine.

In recent years, coastal flooding has become more common near Chevak. Protective sea ice melts earlier each year. Storm surges and rising sea levels now push brackish water further inland. These flooding events increase erosion, damage property, and alter the delicate balance of wetland and tundra ecosystems.

Ecologists Karen, Kathy, and Josh began studying the plants around Chevak to better understand how flooding affects these ecosystems. To understand how plant communities at high and low elevations respond to flooding, the scientists designed an experiment at Old Chevak, the original village site abandoned decades ago due to flooding.

Chevak, a village in Alaska.

Working in collaboration with the Chevak community and the Yukon Delta National Wildlife Refuge, they established experimental plots to simulate flooding. The flooded plots were created by pumping in seawater to simulate high-tide flooding. This was repeated 3 times during the summer. Karen, Kathy, and Josh also kept control plots where no brackish water was added. The treatments were repeated at both high and low elevation sites. There were 7 replicates at each location.

At the summer’s end the team collected data on plant growth. They measured the biomass, or weight, of all plants in all of the plots. Karen, Kathy, and Josh grouped the plants into 4 groups. Graminoids, which include grasses and sedges, are the dominant plant group of the maraq. They typically grow well in flooded wetland areas. Forbs are broadleaf herbs, like salmonberries, that grow well in the nunapikShrubs include species such as blueberries, cranberries, and tundra tea. Like forbs, they also grow well in the nunapikLichens are plant-like species that form low crusts along the ground and are only found in the higher elevation sites.

Karen, Kathy, and Josh thought that plants from the low elevation sites would be made up of more salt and flood-tolerant species and would therefore be less harmed by frequent floods. On the other hand, high elevation sites would consist mostly of plant species that are not salt or flood-tolerant and would not do well during floods.

Featured scientists: Karen Beard (she/her) of Utah State University, Kathy Kelsey (she/her) of the University of Colorado Denver and Joshua Leffler (he/him) of South Dakota State University. Written by: Andrea Pokrzywinski (she/her).

Flesch–Kincaid Reading Grade Level = 8.9

Additional Resources:

This activity pairs with another Data Nugget, “Salmonberries in our future”, which features this same collaboration, but focuses on one culturally significant type of Arctic plant, salmonberries.

Additional video resources and lesson extensions can be found at the project website “Working Together”, including the following:

  • Voices from the Land” introduces the collaboration between scientists and Yup’ik community members. They are working together to respect and care for the land. This narrative is told by the students from Bethel and Chevak Alaska. 
  • Mapping Merbok” describes the questions scientists are researching to document how increased flooding, such as that from Typhoon Merbok, will drive landscape changes.
  • Warming and Flooding on the Tundra” describes the research scientists are conducting to measure the impact of both warming and flooding on plant communities.

What grows when the forest goes?

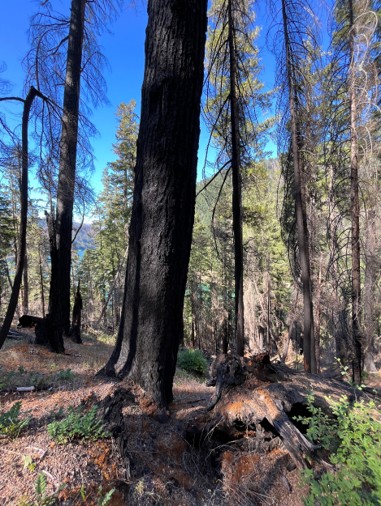
Area of the H.J. Andrews Experimental Forest in Oregon, a few years after a fire.

The activities are as follows:

The H.J. Andrews Experimental Forest, or Andrews for short, is a long-term ecological research site in the Cascade Mountains of Oregon. The forest is a temperate old-growth rainforest. It is known for its lush and green understory of flowering plants, ferns, mosses and a towering canopy of Douglas fir, Western hemlock, Red cedar, and other trees. Scientists have spent decades studying how plants, animals, land use, and climate are all connected in this ecosystem.

Matt is a biology teacher who has spent two summers in the field working with scientists at the Andrews. These experiences have been valuable ways to bring real data and research back to his students! When he visits, Matt works closely with Joe and Cole. Joe is a scientist who has spent many years working in the forest studying the impact of disturbances on plants. Cole is in Joe’s lab and has been focusing on fire’s effects on the forest during graduate school.

Historically, large, severe fires have been a part of the ecology of forests in Oregon. They typically occur every 200-500 years. Many of the plants at the Andrews Forest are those that can deal with fire. Fires clear out dead plants, return nutrients to the soil, and promote new growth of understory and canopy plants. With climate change impacting temperature and rainfall across the globe, forests in Oregon are increasingly experiencing longer periods of dry and hot weather. These changes are causing an increase in the frequency and severity of wildfires.  

On Matt’s last day at the Andrews in 2023, a lightning strike started a wildfire in a far corner of the forest. With hundreds of firefighters on the ground and several helicopters in the air, the “Lookout Fire” burned for several months, consuming about 70% of the Andrews forest! 

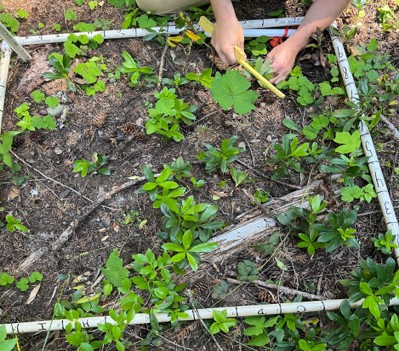
Plots in 2023 being surveyed for native and invasive plants to calculate the proportion that are invasive after a burn.

When Matt returned in the summer of 2024, it looked nothing like the forest he had left. The fire completely changed the course of his research experience. When he saw the scorched forest, he began to wonder how it would recover. He also observed that the fire had not burned at the same intensity throughout the forest. Some areas of Andrews were burned more, and in some spots, the fire had been less intense.  

Matt thought that some plants may do better after a severe burn, while other species might do worse. Specifically, Matt wanted to see whether native and invasive plants would show differences after a fire. Plants that have historically grown in an area without human interference are called native plants. These plants have a long history of adapting to the specific conditions in an area. When a plant species is moved by humans to a new area and grows outside of its natural range, it is called an invasive plant. Invasives often grow large and fast, taking over habitats, and pushing out native species. Invasive plants tend to be the ones that can grow fast and handle disturbances, so the team expected that invasive species would recover more quickly than native plants after high severity fires.  

It was still too early to re-enter the areas burned by the Lookout Fire, so Matt and Joe chose another recent fire. They used data collected from a section of the forest that had burned in 2020. In 2021, a year after the fire, scientists put out 80 plots that were 1m2 in size to collect data on the understory plants. 

Each section was given a burn severity value based on the amount the canopy trees had burned directly over the plot. Scientists would look up at the tree canopy and see how much was missing, and the more that was gone, they knew the burn severity had been higher. Scientists then identified every species of plant in the plots and counted the number of individual plants of each species. This was repeated every year after 2021 to observe changes over time. Matt and Joe decided to analyze data from 2023, which Matt helped collect with Cole. To answer their question, they calculated the proportion of invasive plants in each plot. 

Featured scientists: Joe LaManna (he/him) and Cole Doolittle (he/him) from Marquette University and
Matt Retterath (he/him) from Fridley Public Schools.

Flesch–Kincaid Reading Grade Level = 8.9

Additional teacher resources related to this Data Nugget:

There are two blog posts written about the Andrews LTER research featured in this activity.

  • https://lternet.edu/stories/fire-brings-new-perspectives-on-disturbance-at-h-j-andrews-experimental-forest/
  • https://lternet.edu/stories/burned-forest-bleached-reef-lter-sites-adapt-to-learn-from-disturbance/

CO2 and trees, too much of a good thing?

The activities are as follows:

Kristina conducting the tree survey, measuring the size of a tree, which will later be used to calculate the mass of carbon in that tree.

The amount of carbon dioxide (CO2) in the atmosphere has steadily increased since the start of the Industrial Revolution in 1750. This extra CO2 traps heat like a blanket, causing the global climate to warm. The resulting climate change effect is known and widely accepted in science. While scientists are certain that climate change is happening, they still have many questions about its impacts.

For example, scientists today are exploring whether climate change will help or hurt trees and forests. Many scientists think that elevated CO2 in the atmosphere can actually help trees. We can see why in the formula for photosynthesis:

6𝐶𝑂2+6𝐻2𝑂+𝐸𝑛𝑒𝑟𝑔𝑦→𝐶6𝐻12𝑂6 +6𝑂2

Carbon Dioxide + Water + Energy (sunlight) → Glucose + Oxygen

If you add more CO2 to the atmosphere, trees will have more resources for photosynthesis and can make more glucose. Glucose is food for the trees. Trees can use their glucose for growth, using it to make wood. However, trees sometimes have to put glucose towards other things. Just like us, plants break down glucose for energy through cellular respiration:

C6𝐻12𝑂6 +62→ 6𝐶𝑂2+6𝐻2𝑂+𝐸𝑛𝑒𝑟𝑔𝑦
Glucose + Oxygen → Carbon Dioxide + Water + Energy (ATP)

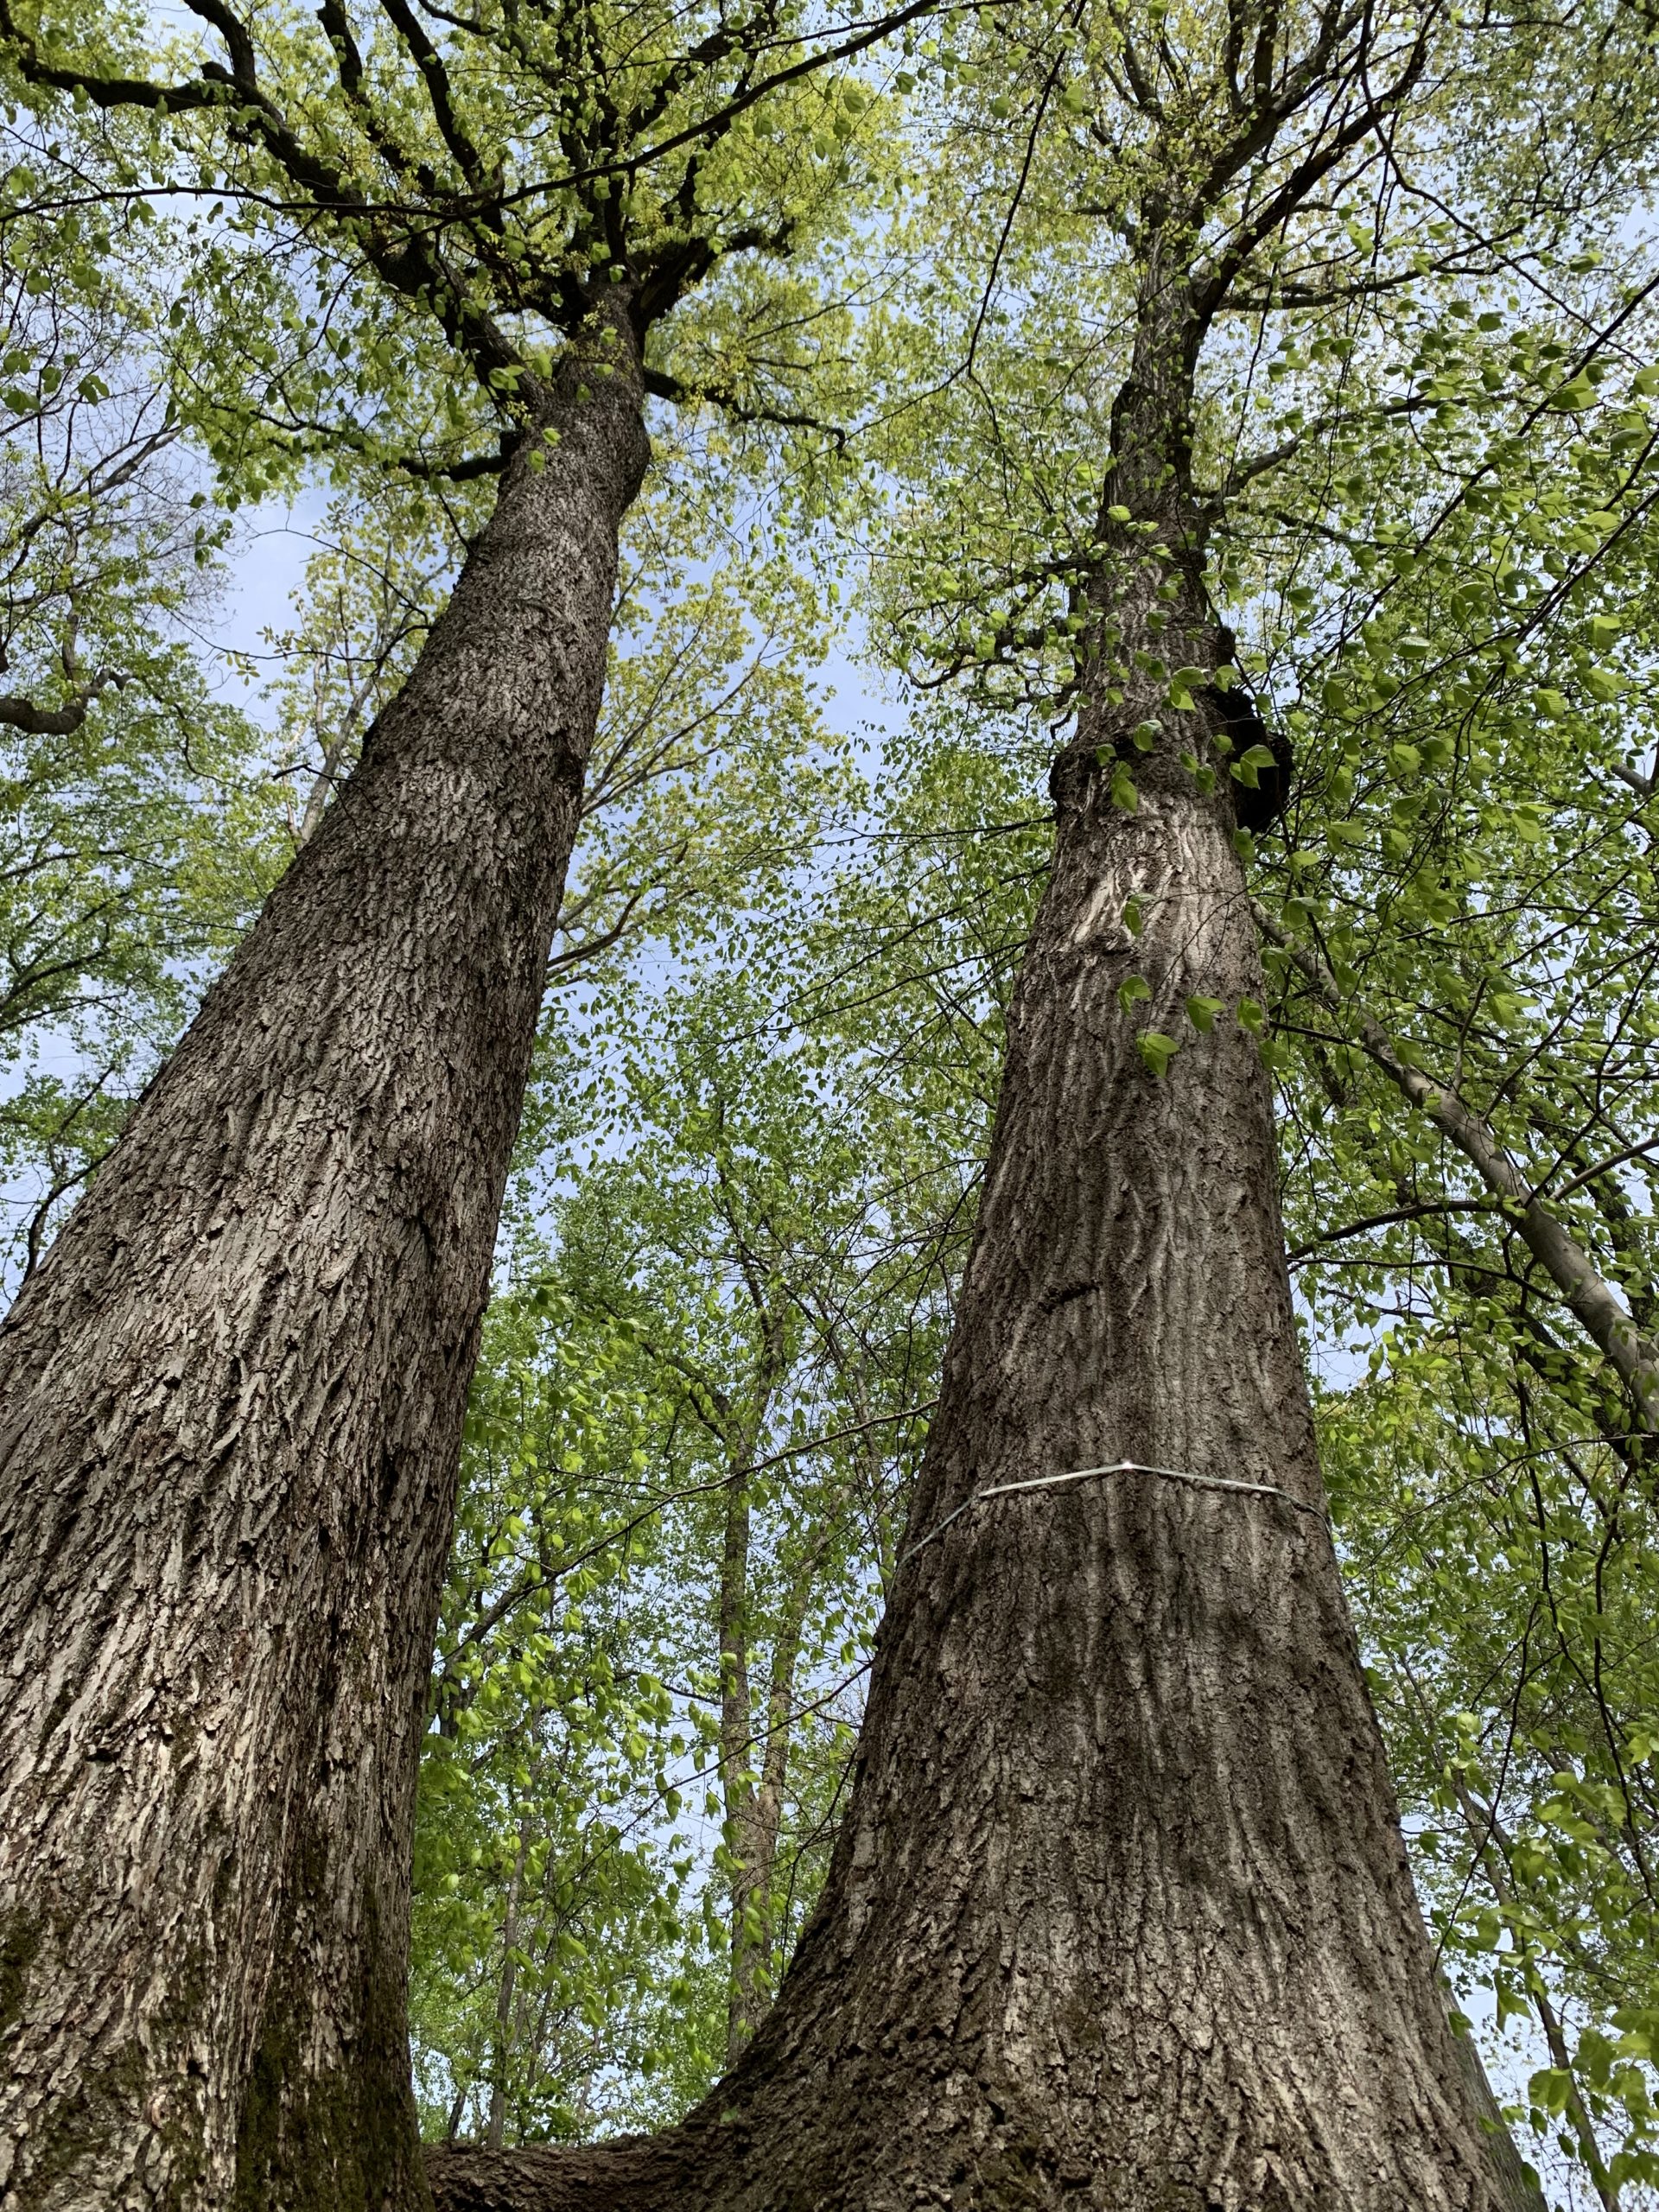
Two large trees stand in the experimental plot after a survey. The tree to the right has been banded to measure its growth.

Trees need energy for everyday functioning, or to respond to stress. Under climate change, trees might experience more stress. Stress for trees might increase if summer temperatures get too hot, or they don’t have enough water. More stress means more respiration and less growth. Or, even worse, the trees could die. Dead trees can’t photosynthesize, and they also decompose, which releases CO2 into the atmosphere
as microbes break down wood and other materials.

Kristina and Luca are scientists looking at the effects of climate change on trees. They wanted to test whether climate change was benefitting or hurting trees. They set out to find some data that would allow them to test these alternative hypotheses.

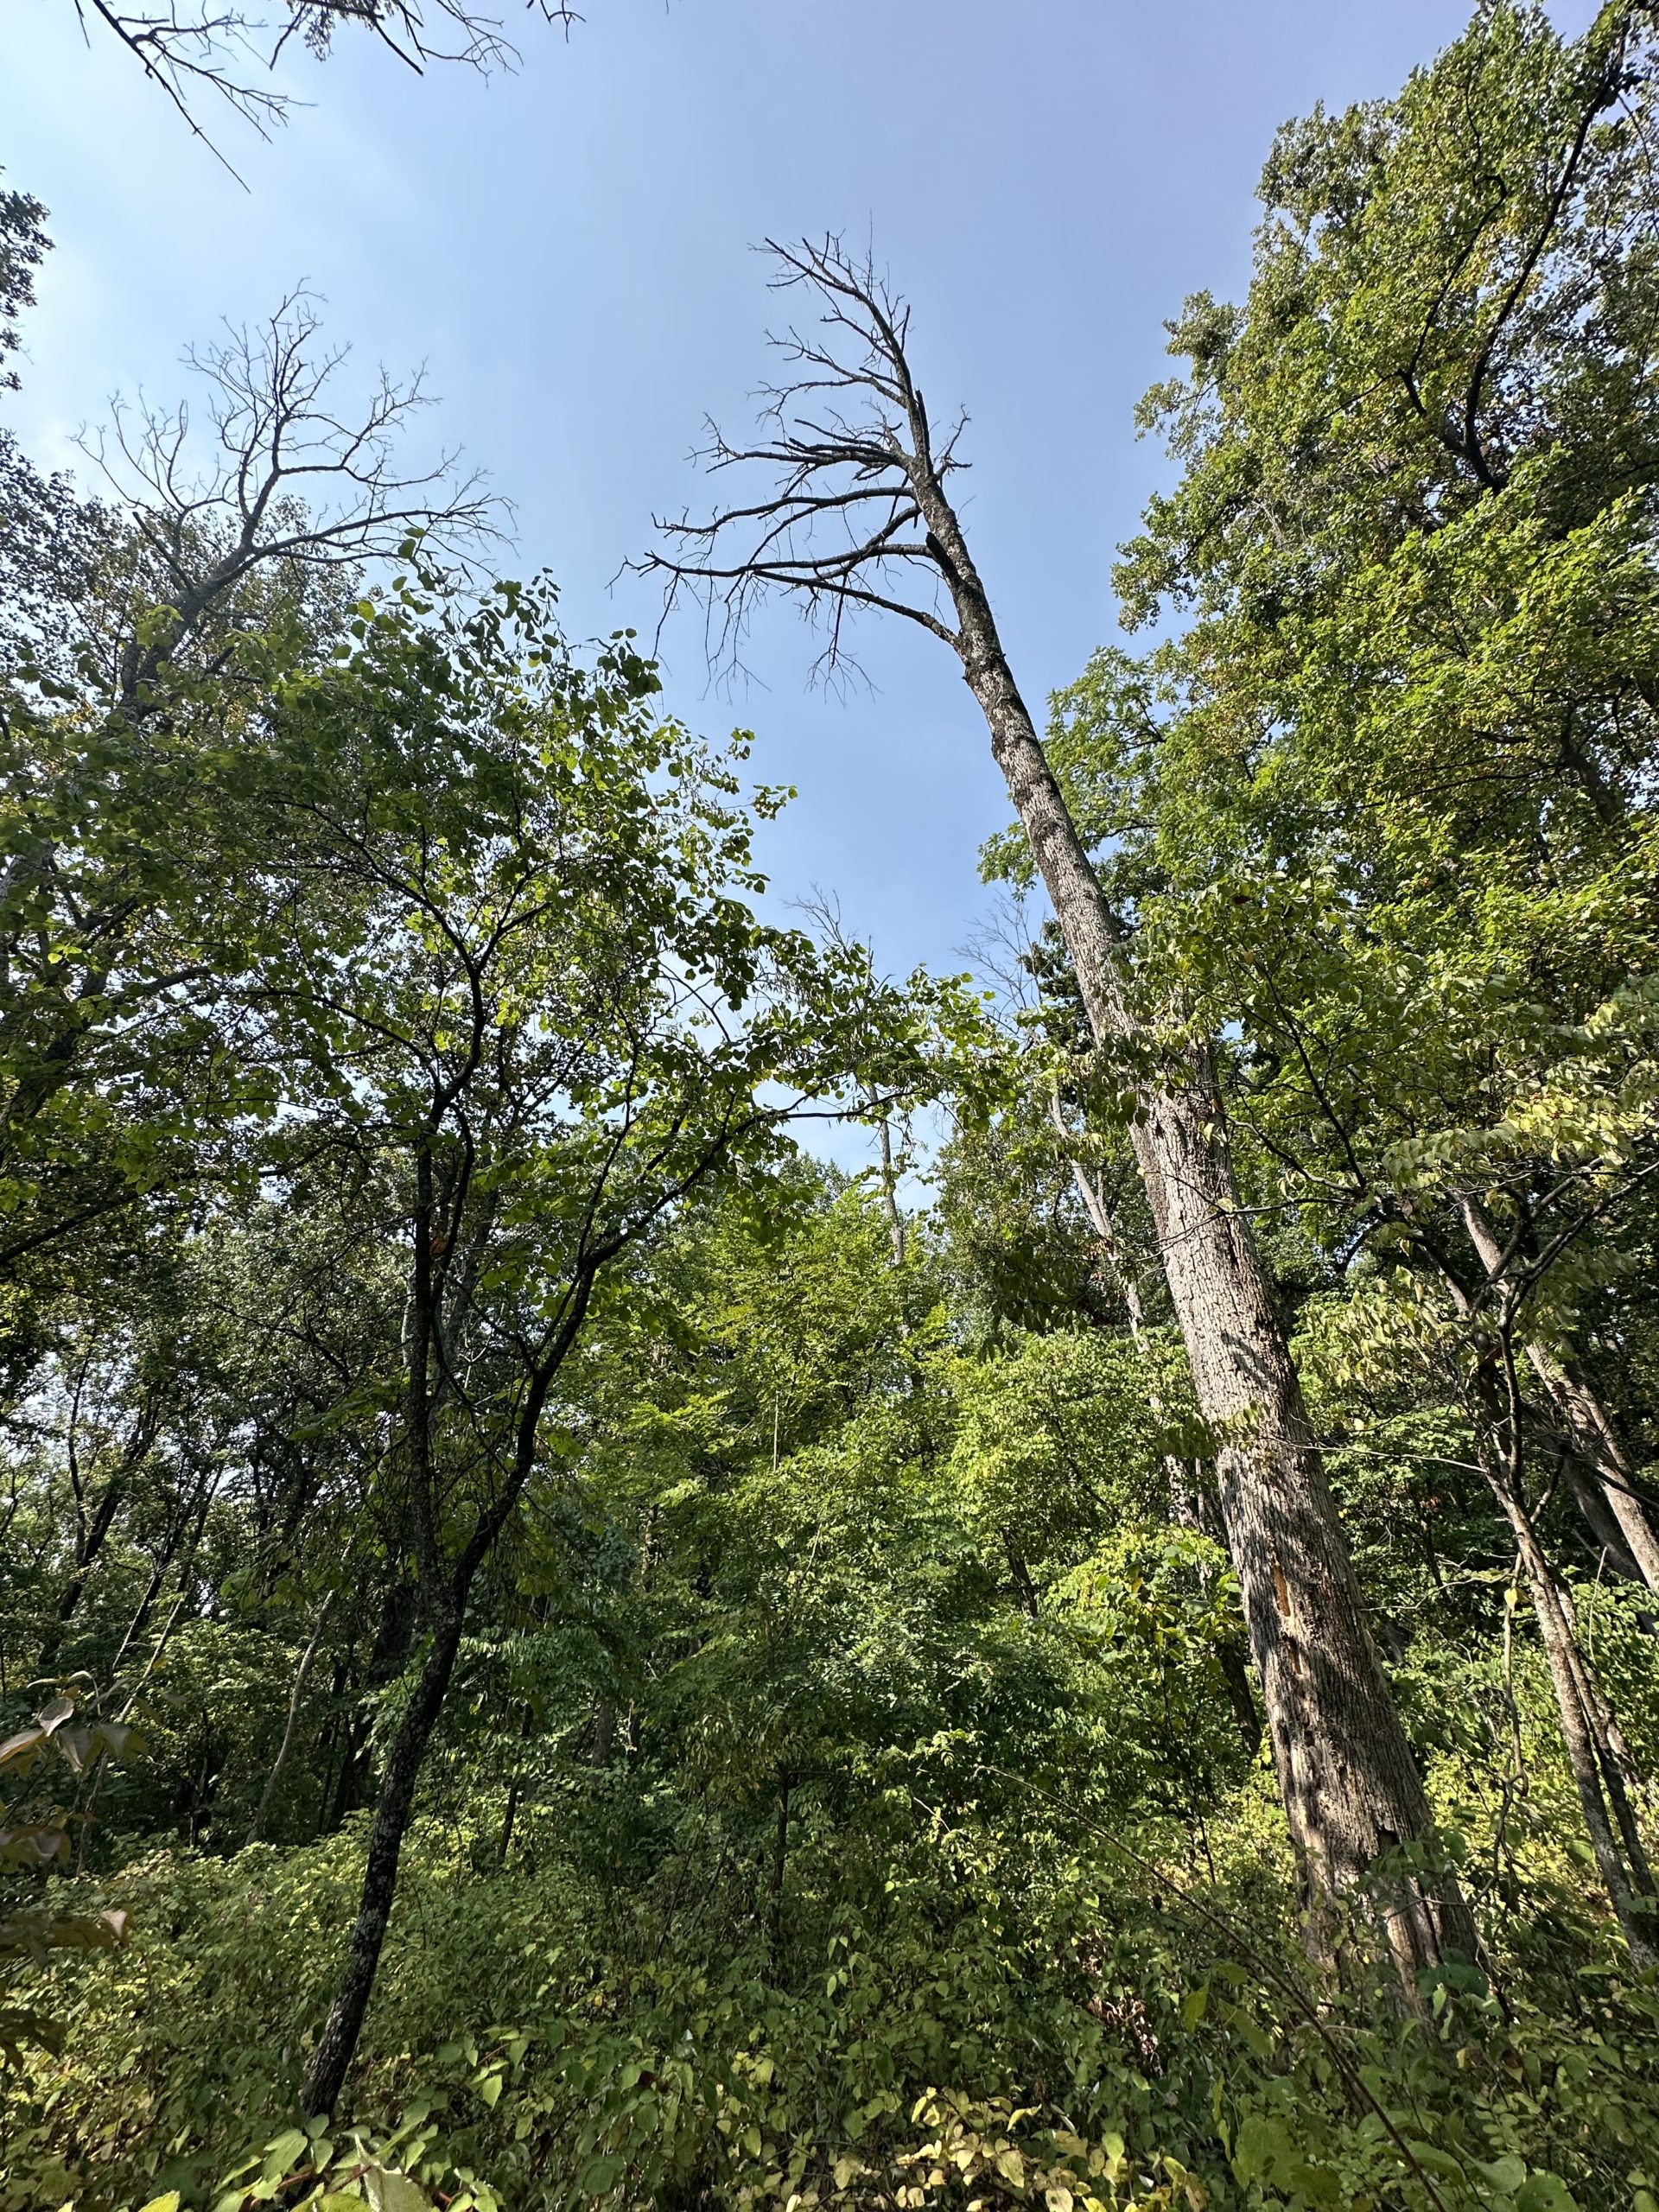
A dead ash tree stands in the experimental plot after a survey. The carbon in this tree
will return to the atmosphere through decomposition.

Kristina runs a tree census in a forest at the Smithsonian Conservation Biology Center in Virginia. Since 2008, she and many other scientists have surveyed every tree in their 26-hectare plot. Every five years, they count up how many trees are alive, how much they’ve grown, and how many have died. Luca joined Kristina’s lab in 2022. He and Kristina worked together with many other scientists to collect and process data on tree growth and mortality in 2023.

They used this growth and mortality data for individual trees to calculate levels of carbon gained and lost by the whole forest. The amount of carbon used for growth across the whole forest was measured as the mass of carbon gained. They also calculated the weight of the trees that died, which was measured as the mass of carbon lost. Both of these measurements were calculated in megagrams (Mg, that’s one million grams) of carbon (C) per hectare (ha) of forest per year (yr), or (MgC/ha/yr). The difference between these
two values is the change in carbon. This value gives the balance between carbon gained and lost. A positive value means there is more carbon being taken in by the forest than lost, and a negative value means that more carbon is being lost back to the atmosphere.

Featured scientists: Kristina J. Anderson-Teixeira (she/her) & Luca Morreale (he/him) at Smithsonian’s National Zoo & Conservation Biology Institute. Written by Ryan Helcoski

Flesch–Kincaid Reading Grade Level = 7.8

Microbes facing tough times

Jennifer sampling soil before the shelters were set up. Here you can see the control (left) and carbon addition (right) plots.

The activities are as follows:

As the climate changes, Michigan is expected to experience more drought. Droughts are periods of low rainfall when water becomes limiting to organisms. This is a challenge for our agricultural food system. Farmers in Michigan will be planting crops into conditions that make it harder for corn, soybean, and wheat to grow and survive.

Scientists are looking into how crop interactions with other organisms may help. Microbes are microscopic organisms that live in soils everywhere. Some microbes can help crops get through time times. These beneficial microbes are called mutualists. They give plants nutrients and water in exchange for carbon from the plant. Microbes use the carbon they get from plants as food. If plants are stressed and don’t have any carbon to give, microbes get carbon from dead plant material in the soil.

Jennifer is a biologist studying the role of microbes in agriculture. She has always been interested in a career that would help people. As a student, Jennifer thought she would have a career in politics. Along the way, she learned that a career in science is a great way to study questions that may lead to solutions for the challenges we are facing today. Jennifer was drawn to the Kellogg Biological Station, where she joined a team of scientists studying the impacts of climate change and drought on agriculture.

Jennifer and other scientists set out to test ways that we can give mutualists in the soil a boost. She thought, perhaps if we were to give microbes more food, they would be less stressed during a drought and would be able to help out crops growing in these stressful conditions.

To test this idea, Jennifer needed to test how well microbes were doing under different carbon and drought conditions. First, she set up treatments in soybean fields to manipulate the amount of carbon in the soil. She set up control plots where she left the soil alone. She also set up carbon treatment plots where dead plant litter was added to the soil to increase the carbon available to microbes.

Next, Jennifer manipulated the availability of water in her plots to test the microbes under stress. To do this, she set up her plots under shelters that kept out rain. The shelters had sprinklers, which were automated to add specific amounts of water to the plots. This design allowed Jennifer to control the watering schedule for each plot. One shelter treatment was a control, where water was added to the plots every week. This is similar to the schedules of local farmers who add water through irrigation. The other shelter treatment was drought, where plots received no water for six weeks. This experiment was replicated 4 times, meaning there were 4 shelters on the control watering schedule and 4 shelters that were under drought conditions.

A view of one of the shelters used in Jennifer’s experiment.

Finally, Jennifer had to measure how the microbes were doing in each treatment. She did this by measuring their enzyme activity. Enzyme activity is a measure of how active the microbes are. The higher the enzyme activity, the happier the microbes are. To measure this, Jennifer collected soil samples from each plot throughout the growing season and took them to the lab to measure enzyme levels in the soil samples. These enzymes are made by microbes when they are active. She then calculated the mean of all her samples for each treatment combination.

Jennifer predicted two things. First, if drought is harmful to microbes, then she would expect to see lower enzyme activity in the drought treatment compared to the irrigated treatment. Second, if adding carbon to the soil is a way to help microbes overcome the challenge of drought, she expected higher enzyme activity in the plots with plant litter added compared to the control treatment. Both of these taken together would indicate that drought is stressful for microbes, but we can help them out by adding resources like plant litter to soils.

Featured scientist: Jennifer Jones (she/her) from the Kellogg Biological Station Long Term Ecological Research Site. Written with Melissa Frost and Liz Schultheis.

Flesch–Kincaid Reading Grade Level = 8.2

Additional teacher resources related to this Data Nugget:

To introduce this Data Nuggets activity, students can watch a talk by Jennifer when she made a classroom visit to share her background and research interests. This video is a great way to introduce students to scientist role models and learn more about what a career in science looks like, as well as get an introduction to the themes in the research.

There is also a video of Jennifer and her scientist colleague, Grant Falvo, out in the field talking about their research under the rainout shelters.

For more information about the rainout shelter experiment, students can watch this short video featuring Jennifer Jones and another scientist on the team, Grant Falvo:

These data are part of the Kellogg Biological Station Long Term Ecological Research Program (KBS LTER). To learn more about the KBS LTER, visit their website.

Seagrass survival in a super salty lagoon

A researcher in the Dunton Lab measures seagrasses underwater using a mask, snorkel, and a white PVC quadrat.

The activities are as follows:

Seagrasses are a group of plants that can live completely submerged underwater. They grow in the salty waters along coastal areas. Seagrasses are important because they provide a lot of benefits for other species. Like land plants, seagrasses use sunlight and carbon dioxide to grow and produce oxygen in a process called photosynthesis. The oxygen is then used by other organisms, such as animals, for respiration. Other organisms use seagrasses for food and habitat. Seagrass roots hold sediments in place, creating a more stable ocean bottom. In addition, the presence of seagrasses in coastal areas slows down waves and absorbs some of the energy, protecting shorelines.

Unfortunately, seagrasses are disappearing worldwide. Some reasons include damage from boats, disease, environmental changes, and storms. Seagrasses are sensitive to changes in their environment because they have particular conditions that they prefer. Temperature and light levels control how fast the plants can grow while salinity levels can limit their growth. Therefore, it is important to understand how these conditions are changing so that we can predict how seagrass communities might change as well.

Ken is a plant ecologist who has been monitoring seagrasses in southern Texas for over 30 years! Because of his long-term monitoring of the seagrasses in this area, Ken noticed that some seagrass species seemed to be in decline. Kyle started working with Ken during graduate school and wanted to understand more about what environmental conditions might have caused these changes. 

Manatee grass (Syringodium filiforme) located within the Upper Laguna Madre.

Texas has more seagrasses than almost any other state, and most of these plants are found in a place called Laguna Madre. During his yearly seagrass monitoring, Ken noticed that from 2012 – 2014 one of the common seagrasses, called manatee grass, died at many locations across Laguna Madre. Since then, the seagrass has grown back in some places, but not others. Kyle thought this would be an opportunity to look back at the long-term dataset that Ken has been collecting to see if there are any trends in environmental conditions in years with seagrass declines.

Each year, Ken, Kyle, and other scientists follow the same research protocols to collect data to monitor Laguna Madre meadows. Seagrass sampling takes place 2 – 4 times a year, even in winter! To find the manatee grass density, scientists dig out a 78.5 cm2 circular section (10 cm diameter) of the seagrass bed while snorkeling. They then bring samples back to the lab and count the number of seagrasses. While they are in the field, they also measure environmental conditions, like water temperature and salinity. A sensor is left in the meadow that continuously measures the amount of light that reaches the depth of the seagrass.

Kyle used data from this long-term monitoring to investigate his question about how environmental conditions may have impacted manatee grass. For each variable, he calculated the average across the sampling dates to obtain one value for that year. He wanted to compare manatee grass density with salinity, water temperature, and light levels that reach manatee grass. He thought there could be trends in environmental conditions in the years that manatee grass had low or high densities.

Featured scientists: Kyle Capistrant-Fossa (he/him) & Ken Dunton (he/him) from the U-Texas at Austin

Flesch–Kincaid Reading Grade Level 9.8

Additional teacher resources related to this Data Nugget:

There is another Data Nugget that looks at these seagrass meadows! Follow Megan and Kevin as they look at how photosynthesis can be monitored through the sound of bubbles and the acoustic data they produce.

Follow this link for more information on the Texas Seagrass Monitoring Program, including additional datasets to examine with students.

There are articles in peer-reviewed scientific journals related to this research, including:

National Park Service information about the Gulf Coast Inventory and Monitoring.

Texas Parks and Wildlife information on seagrass: