The activities are as follows:
- Teacher Guide
- Student activity, Graph Type A, Level 4
- Student activity, Graph Type B, Level 4
- Student activity, Graph Type C, Level 4
- PowerPoint of images
- Grading Rubric
Stepping out into a prairie feels like looking at a sea of grass, with the horizon evoking a sense of eternity. Grasses and other prairie plants provide important benefits, such as creating habitat for many unique plants, mammals, insects, and microbes. They also help keep our water clean by using nutrients from the soil to grow. When plants take up these nutrients, they prevent them from going into streams. High levels of plant growth also keeps carbon bound up in the bodies of plants instead of in the atmosphere.
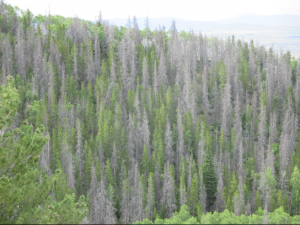
Prairies grow where three environmental conditions come together – a variable climate, frequent fires, and large herbivores roaming the landscape. However, prairies are experiencing many changes. For example, people now work to prevent fires, which allows forest species to establish and eventually take over the prairie. In addition, a lot of land previously covered in prairie is now being used for agriculture. When land is used for agriculture, farmers add nutrients through fertilizer. With all these changes, prairie ecosystems have been declining globally. Scientists are concerned that as they disappear so will the benefits they provide.
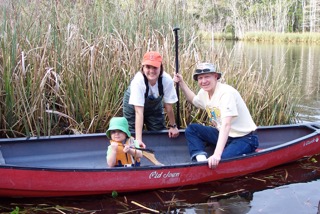
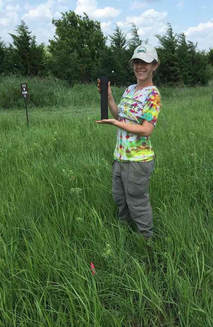
Lydia and Christine are two scientists contributing to the effort to learn more about how to preserve prairies. They both became interested in studying soil because of their appreciation for prairies at a young age. For Lydia, she lived in an area that was covered by trees and farmland, but knew at one time it used to be prairie. This made her want to learn more about prairie environments and how places like where she grew up have changed through history. For Christine, she grew up surrounded by prairies where she developed a passion and curiosity for the natural world. Especially for the organisms living in the soil that you cannot see, called microbes.
Lydia and Christine read about how grassland scientists have been doing research to learn more about what happens when fire is stopped and excess nutrients are added. These changes reduce biodiversity and affect which species of plants can grow in the prairie. However, Lydia and Christine noticed that the research had been mostly focused on what happens aboveground. Lydia and Christine had a hunch that the aboveground communities were not the only things changing. They thought that belowground components would be changed by fire and fertilizer too. They turned their focus to microbes in the soil, because they also use nutrients. In addition, they thought these microorganism would be affected by the changes in aboveground plant biodiversity.
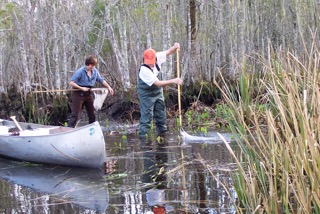
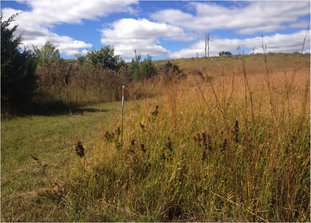
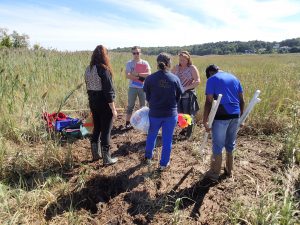
To see if this was true, they used data that they and other scientists collected at Konza Prairie Biological Station from a large field experiment. The experiment was set up in 1986 and the treatments were applied at the field site every year until 2017! Lydia and Christine focused on the fertilizer (nitrogen) addition and prescribed burning treatments to answer their questions. The nitrogen treatment had eight plots where nitrogen had been added and eight with no nitrogen as a control. Similarly, the prescribed burn treatment was applied to eight plots, while eight plots had no burning as a control. These two treatments were also crossed with each other, meaning that some plots were burned and nitrogen was added.
Lydia and Christine expected the types of microbes in the soil to change in response to the nitrogen and burning treatments because of the different aboveground plant communities and difference in soil nutrients. Soil microbial communities can change in multiple ways. First, the number of unique species can increase or decrease, measured as richness. The other way is how many individuals of each species there are in the community, measured as evenness. Taken together, richness and evenness give a measure of diversity, which can be summarized using the Shannon-Wiener index. The value will get bigger if either richness or evenness increases because it incorporates both. For example, a community with five species that has equal abundance of each will have a larger Shannon-Wiener index than a community with five species where one species has a lot more individuals than the other four.
Featured Scientists: Lydia Zeglin and Christine Carson from the Konza Prairie Biological Station. Written By: Jaide Allenbrand

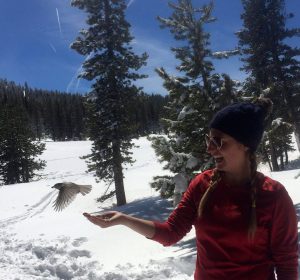 About Carrie: I have been interested in animal behavior and behavioral ecology since my second year in college at the University of Tennessee. I am primarily interested in how variation in ecology and environment affect communication and signaling in birds. I have also studied various types of memory and am interested in how animals learn and use information depending on how their environment varies over space and time. I am currently working on my PhD in Ecology, Evolution, and Conservation Biology at the University of Nevada Reno and once I finish I hope to become a professor at a university so that I can continue to conduct research and teach students about animal behavior. In my spare time I love hiking with my friends and dogs, and watching comedies!