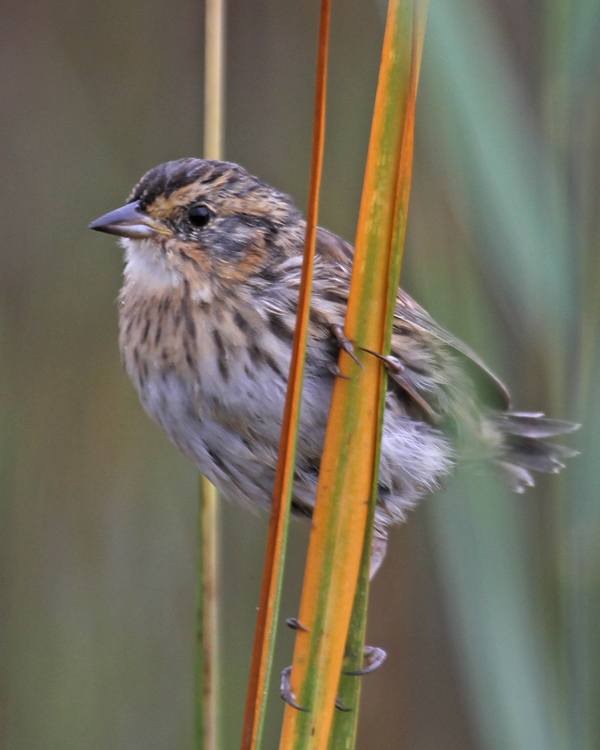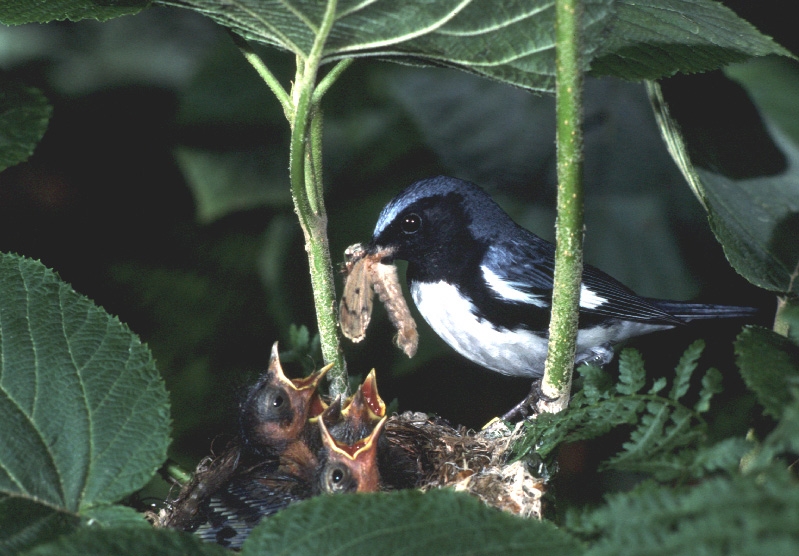
Male Black-throated Blue Warbler feeding nestlings. Nests of this species are built typically less than one meter above ground in a shrub such as hobblebush. Photo by N. Rodenhouse.
The activities are as follows:
- Teacher Guide
- Student activity, Graph Type A, Level 2
- Student activity, Graph Type B, Level 2
- Student activity, Graph Type C, Level 2
- Grading Rubric
- PowerPoint of images
- Digital Data Nugget on DataClassroom
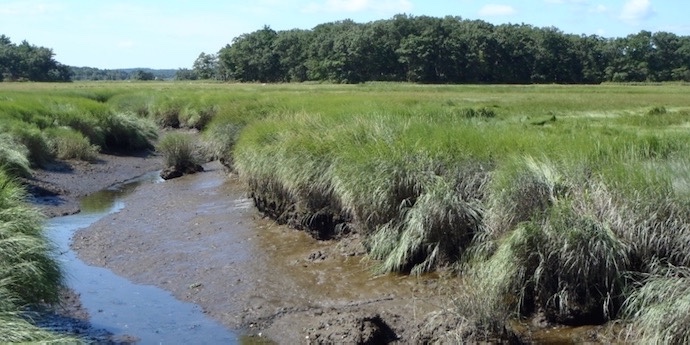
The Hubbard Brook Experimental Forest is an area where scientists have collected ecological data for many years. It is located in the White Mountains of New Hampshire. Data collected in this forest helps uncover environmental trends over long periods of time, such as changes in air temperature, precipitation, forest growth, and animal populations. It is important to collect data on ecosystems over time because these patterns could be missed with shorter observation periods or short-term experiments.
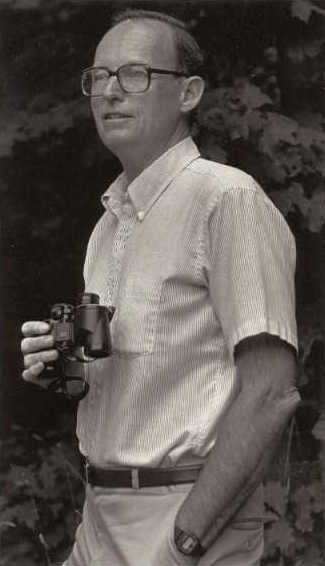
Richard Holmes is an avian ecologist who began this study because he was interested in how bird populations were responding to long-term environmental change.
Each spring, Hubbard Brook comes alive with the arrival of migratory birds. Many come from the tropics to take advantage of abundant insects and the long summer days of northern areas. In the spring, avian ecologists, or scientists who study the ecology of birds, also become active in the forest at Hubbard Brook. They have been keeping records on the birds that live in the experimental forest for over 50 years. These data are important because they represent one of the longest bird studies ever conducted!
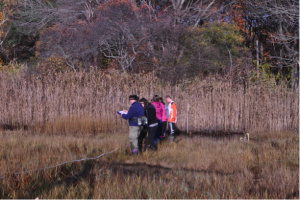
Richard is an avian ecologist who began this study early in his career as a scientist. He was interested in how bird populations respond to long-term environmental changes at Hubbard Brook. Every summer since 1969, Richard takes his team of trained scientists, students, and technicians into the field to identify which species are present. Richard’s team monitors populations of over 30 different bird species. They count the number of birds that are in the forest each year and study their activities during the breeding season. The researchers wake up every morning before the sun rises and travel to the far reaches of the forest. They listen for, look for, identify, and count all the birds they find. The team has been trained to be able to identify the birds by sight, but also by their calls. Team members are even able to identify how far away a bird is by hearing its call!
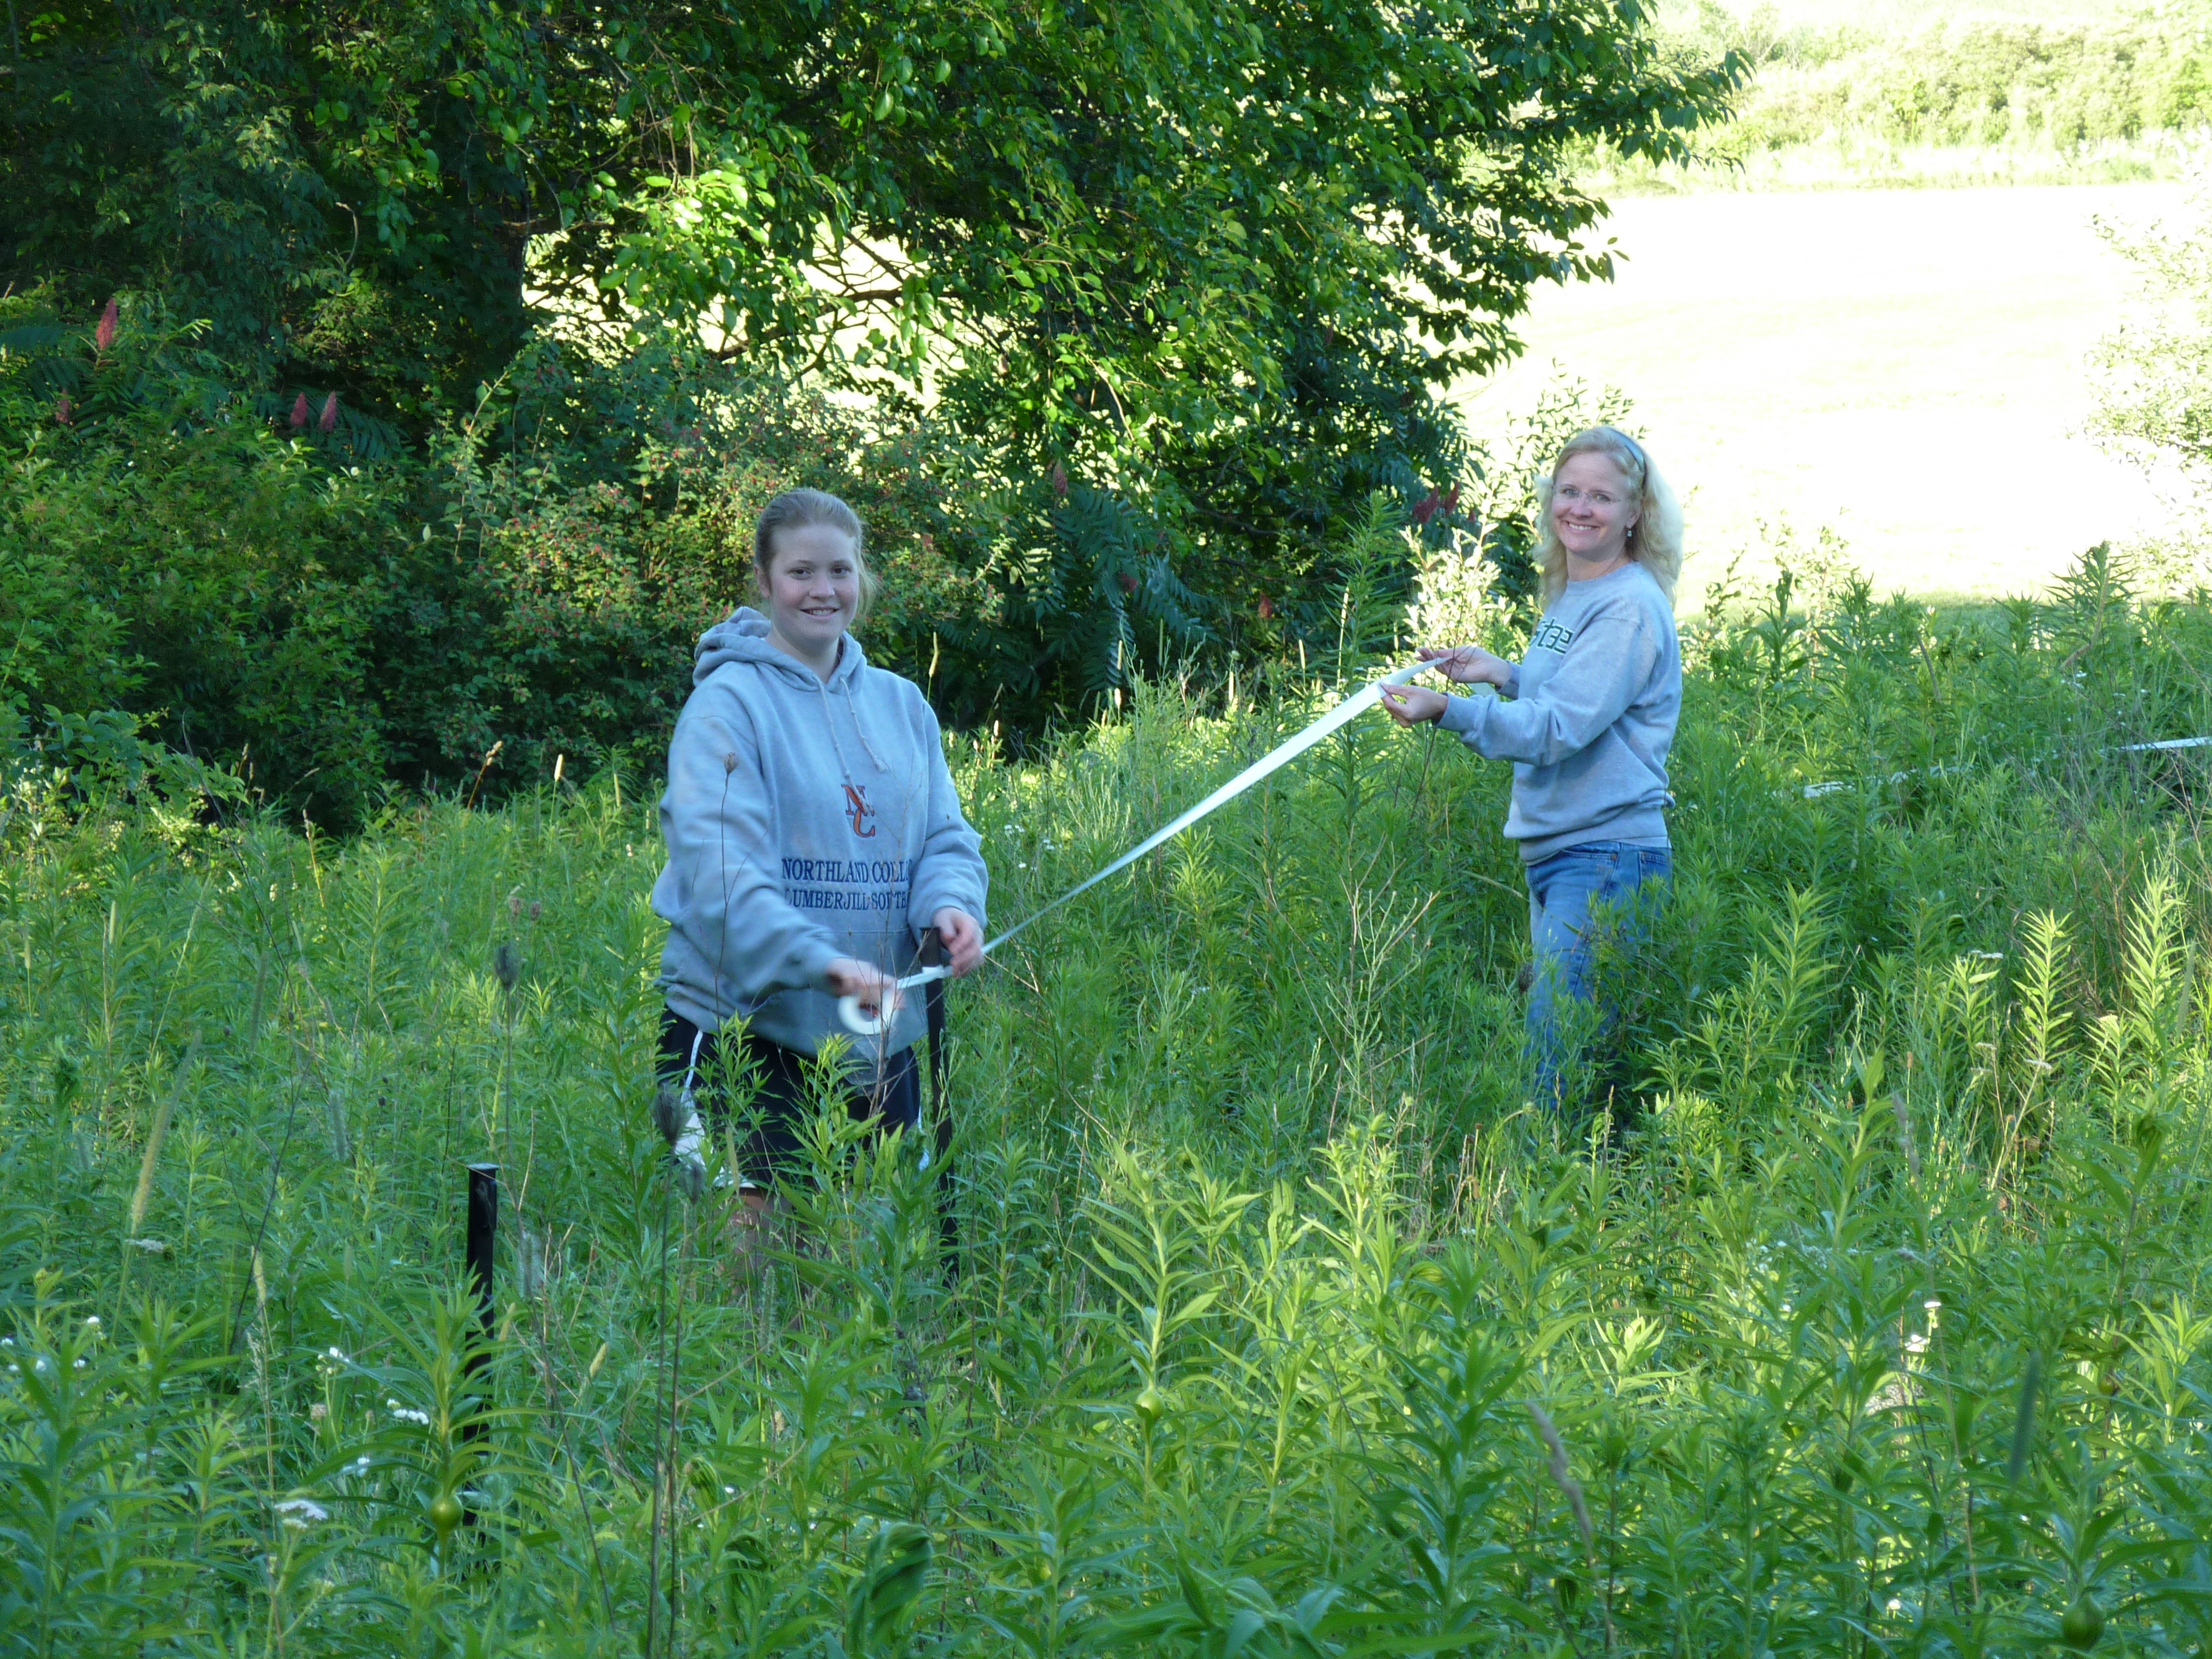
The study area is located away from any roads or other disturbed areas. To measure the abundance, or number of birds found in the 10 hectare study area, the researchers used what is called the spot-mapping method. They use plastic flags on trees 50 meters apart throughout the study area to create a 50×50 meter grid. The grid allows them to map where birds are found in this area, and when possible, where they locate their nests. Using the grid the researchers systematically walk through the plot several days each week from early May until July, recording the presence and activities of every bird they find. They also note the locations of nearby birds singing at the same time. These records are combined on a map to figure out a bird’s territory, or activity center. At the end of the breeding season they count up the number of territories to get an estimate of the number of birds on the study area. This information, when paired with observations on the presence and activities of mates, locations of nests, and other evidence of breeding activity provide an accurate estimate for bird abundance. Finally, some species under close study, like American Redstart and Black-throated Blue Warbler, were captured and given unique combinations of colored bands, which makes it easier to track individuals.
By looking at bird abundance data across many years, Richard and his colleagues can identify trends that reveal how avian populations change over time.
Featured scientist: Richard Holmes from the Hubbard Brook Experimental Forest. Data Nugget written by: Sarah Turtle and Jackie Wilson.
Flesch–Kincaid Reading Grade Level = 11.3

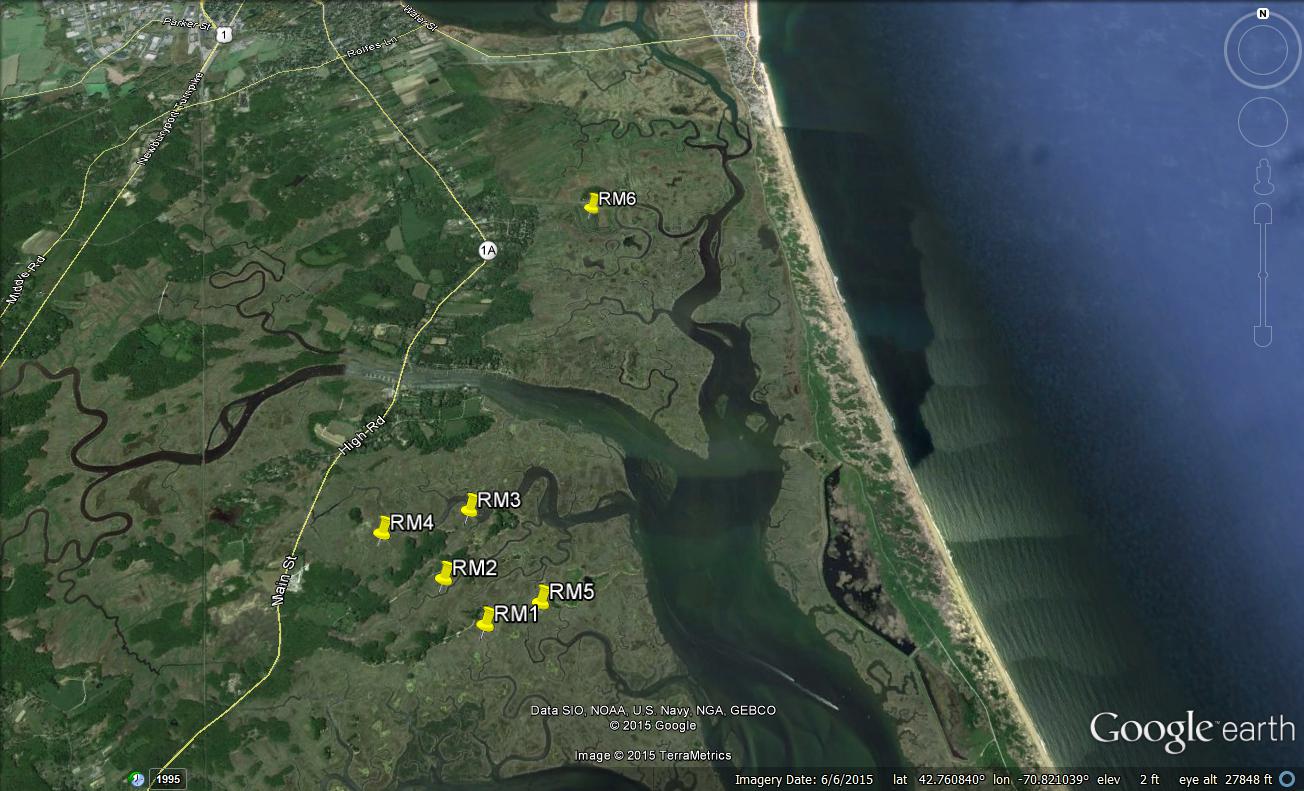
A view of the Hubbard Brook Experimental Forest
Additional teacher resource related to this Data Nugget:
- There is an engaging video that can be used before the students begin the activity. It introduces some of the researchers behind this body of work, including Richard Holmes, and highlights the importance of the long-term nature of this dataset.
- For the full dataset associated with this Data Nugget, check out the Hubbard Brook Data Catalog page. Search for “Bird abundances” in the search bar to find the dataset.
- For more information on this research, check out the Hubbard Brook Experimental Forest’s page on their songbird research
- For more lessons created from data collected on birds at Hubbard Brook, check out the page “Migratory Birds Math and Science Lessons from Hubbard Brook.”

There are multiple publications related to the data included in this activity:
- Holmes, R. T. 2011. Birds in northern hardwoods ecosystems: Long-term research on population and community processes in the Hubbard Brook Experimental Forest. Forest Ecology and Management doi:10.1016/j.foreco.2010.06.021.
- Holmes, R.T., 2007. Understanding population change in migratory songbirds: long-term and experimental studies of Neotropical migrants in breeding and wintering areas. Ibis 149 (Suppl. 2), 2-13.
- Townsend, A. K., et al. (2016). The interacting effects of food, spring temperature, and global climate cycles on population dynamics of a migratory songbird. Global Change Biology 2: 544-555.