Search Results for: lter
LTER Data Nuggets

The following Data Nuggets are written by LTER scientists and created using LTER Data.
To learn more about the ongoing collaboration between Data Nuggets and the LTER, check out our blog posts, “Data Nuggets: small activities with big impacts for students” and “LTER Data Nuggets: Breathing new life into long-term data“. If you have any questions about the research in an LTER Data Nugget, or want help accessing original datasets, please contact us or the Education and Outreach Coordinator (EOC) for that site.
| Title | LTER Site | EOC & Website | Content Level | Summary | |
|---|---|---|---|---|---|
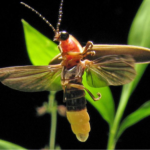 | Blinking out? | Kellogg Biological Station LTER | Liz Schultheis | 2 | Many people have fond memories of watching fireflies blink across open fields and collecting them in jars as children. This is one of the reasons why fireflies are a beloved insect species. However, there is concern that their populations are in decline. Scientists turned to the longest-running study of fireflies known to science to see if this is the case! |
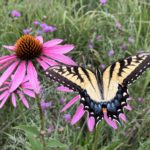 | Little butterflies on the prairie | Kellogg Biological Station LTER | Liz Schultheis | 2 | Many farmers are concerned with growing our food while still protecting habitat wildlife. They want to know - how can we grow food for ourselves while still providing good habitat for other species? Prairie strips are a new idea that might help both farmers and the environment. These strips are small areas of prairie that can be added to farm fields. They look like rows of flowers and grasses within a field. They create habitat for many species, like butterflies, birds, ants, and even microscopic fungi and bacteria! |
 | Farms in the fight against climate change | Kellogg Biological Station LTER | Liz Schultheis | 2 | Different farming practices affect the amount of carbon stored in soil, an important factor for soil health and climate change. Soil scientist Caro analyzed long-term data from a 30-year experiment at Kellogg Biological Station, comparing four land management types—including conventional farming, no-till, and cover crops—to see which ones best increase soil carbon. Her work helps identify practices that benefit both farmers and the planet. |
 | Microbes facing tough times | Kellogg Biological Station LTER | Liz Schultheis | 3 | As the climate changes, Michigan is expected to experience more drought. Scientists are looking into how crop mutualistic interactions with microbes may help them withstand drought periods. First they need to know how microbes are impacted by different carbon and drought conditions. |
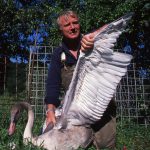 | Bringing back the Trumpeter Swan | Kellogg Biological Station LTER & Kellogg Bird Sanctuary | Liz Schultheis | 3 | Trumpeter swans are the biggest native waterfowl species in North America. At one time they were found across North America, but by 1935 there were only 69 known individuals in the continental U.S.! In the 1980s, many biologists came together to create a Trumpeter Swan reintroduction plan. Since then the North American Trumpeter Swan survey has been conducted to measure swan populations and determine whether this species is recovering. |
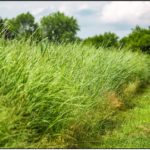
 | Growing energy: comparing biofuel crop biomass | Kellogg Biological Station LTER & University Wisconsin-Madison GLBRC | Liz Schultheis | 3 | Corn is one of the best crops for producing biomass for fossil fuels, however it is an annual and needs very fertile soil. To grow corn, farmers add a lot of chemical fertilizers and pesticides to their fields. Other crops, like switchgrass, prairie, poplar trees, and Miscanthus grass are perennials and require fewer fertilizers and pesticides to grow. If perennials can produce high levels of biomass with low inputs, perhaps they could produce more biomass than corn under certain low nutrient conditions. |
 | A difficult drought | Kellogg Biological Station LTER & University Wisconsin-Madison GLBRC | Liz Schultheis | 2 | Biofuels are made from plants that are growing today, and are being considered as an alternative to fossil fuels. To become biofuels, plants need to go through a series of chemical and physical processes that transform the sugars into ethanol. Scientists are interested in seeing how yeast’s ability to transform sugar into fuel is affected by environmental conditions in fields, such as temperature and rainfall. They used data from a year with drought and a year with normal rainfall to determine if plants that grew under drought conditions were lower quality for ethanol production. |
 | Fertilizing biofuels may cause release of greenhouse gasses | Kellogg Biological Station LTER & University Wisconsin-Madison GLBRC | Liz Schultheis | 3 | One way to reduce the amount of greenhouse gases we release into the atmosphere could be to grow our fuel instead of drilling for it. Unlike fossil fuels that can only release CO2, biofuels remove CO2 from the atmosphere as they grow and photosynthesize, potentially balancing the CO2 released when they are burned for fuel. However, the plants we grow for biofuels don’t necessarily absorb all greenhouse gas that is released during the process of growing them on farms and converting them into fuels. |
 | The ground has gas! | Kellogg Biological Station LTER & University Wisconsin-Madison GLBRC | Liz Schultheis | 3 | Nitrous oxide and carbon dioxide are responsible for much of the warming of the global average temperature that is causing climate change. Sometimes soils give off, or emit, these greenhouse gases into the earth’s atmosphere, adding to climate change. Currently scientists figuring out what causes differences in how much of each type of greenhouse gas soils emit. |
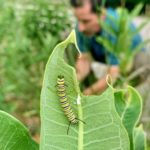 | Mowing for monarchs, Part I | Kellogg Biological Station LTER | Liz Schultheis | 2 | During the spring and summer months, monarch butterflies lay their eggs on milkweed plants. Milkweed plays an important role in the monarch butterfly’s life cycle. When milkweed is cut at certain times of the year new shoots grow, which are softer and easier for caterpillars to eat. Scientists set out to see if mowing milkweed plants could help boost struggling monarch populations. |
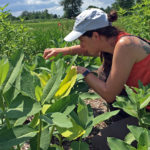 | Mowing for monarchs, Part II | Kellogg Biological Station LTER | Liz Schultheis | 2 | When the scientists mowed down milkweed plants for their experiment, they changed more than the age of the milkweed plants. They also removed other plant species in the background community. Perhaps the patterns they were seeing were driven not by milkweed age, but by eliminating predators from the patches they mowed. |
 | Invasion Meltdown: will climate change make invasions even worse? | Kellogg Biological Station LTER | Liz Schultheis | 3 | Humans are changing the earth in many ways, including adding greenhouse gasses to the atmosphere, which contributes to climate change, and introducing species around the globe, which can lead to invasive species. Scientists wanted to know, could climate change actually help invasive species? Because invasive species have already survived transport from one habitat to another, they may be species that are better able to handle change, such as temperature changes. |
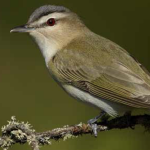
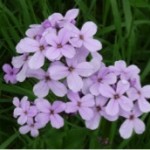 | Springing forward | Kellogg Biological Station LTER | Liz Schultheis | 1 & 3 | What does climate change mean for flowering plants that rely on temperature cues to determine when it is time to flower? Scientists who study phenology, or the timing if life-history events in plants and animals, predict that with warming temperatures, plants will produce their flowers earlier and earlier each year. |
 | Cheaters in nature – when is a mutualism not a mutualism? | Kellogg Biological Station LTER | Liz Schultheis | 4 | Mutualisms are a special type of relationship in nature where two species work together and both benefit. This cooperation should lead to each partner species doing better when the other is around – without their mutualist partner, the species will have a harder time acquiring resources. But what happens when one partner cheats and takes more than it gives? |
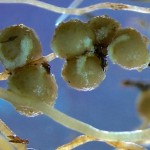
 | Fair traders or freeloaders? | Kellogg Biological Station LTER | Liz Schultheis | 3 | One example of a mutualism is the relationship between a type of bacteria, rhizobia, and plants like peas, beans, soybeans, and clover. Rhizobia live in bumps on the plant roots, where they trade their nitrogen for sugar from the plants. Rhizobia turn nitrogen from the air into a form that plants can use. Under some conditions, this mutualism could break down, for example, if one of the traded resources is very abundant in the environment. |
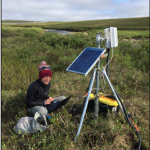 | Streams as sensors: Arctic watersheds as indicators of change | Arctic LTER | Amanda Morrison | 3 | As the world warms from climate change, the Alaskan Arctic is heating up. This is causing permafrost, or the frozen underground layer of rock and ice, to melt. When permafrost melts, plant material that has been stored for thousands of years begins to decay, releasing carbon and nitrogen from the system. Ecologists can act like “ecosystem accountants” measuring the balance of material that goes into and out of these systems. |
 | Limit by limit: Nutrients control algal growth in Arctic streams | Arctic LTER | Amanda Morrison | 3 | Aquatic algae, a type of microbe that live in the water, need to take in nutrients from their surroundings for growth. Two important nutrients for algal growth are nitrogen (N) and phosphorous (P). Climate change may be altering which nutrients are limiting to algae, changing food webs in the ecosystem. |
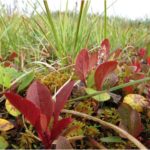 | Which tundra plants will win the climate change race? | Arctic LTER | Amanda Morrison | 3 | While you might think of the arctic tundra as a blanket of snow and polar bears, this vast landscape supports a diversity of unique plant and animal species. Climate change is altering the arctic environment. With warmer seasons and fewer days with snow covering the ground, soils are thawing more deeply and becoming more nutrient-rich. With more nutrients available, will some plant species be able to outcompete other species by growing taller and making more leaves than other plant species? |
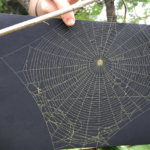 | Spiders under the influence | Baltimore Ecosystem Study LTER | Bess Caplan & Alan Berkowitz | 2 | People use pharmaceutical drugs, personal care products, and other chemicals on a daily basis. Often, they get washed down our drains and end up in local waterways. Chris knew that many types of spiders live near streams and are exposed to toxins through the prey they eat. Chris wanted to compare effects of the chemicals on spiders in rural and urban environments. By comparing spider webs in these two habitats, they could see how different the webs are and infer how many chemicals are in the waterways. |
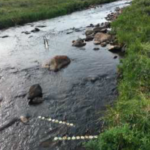
 | All washed up? The effect of floods on cutthroat trout | Andrews Forest LTER | Kari O'Connell | 2 | Floods are very common disturbances in streams. If floods happen right after fish breed and eggs hatch, young fish that cannot swim strongly may not survive. Although floods can be dangerous for fish, they are also very important for creating new habitat. Cutthroat trout are a species of fish living in Mack Creek, which experiences occasional floods. Trout breed in the early spring, right at the peak of flooding, so scientists are collecting long-term data on this species. Will floods hurt trout populations or help? |
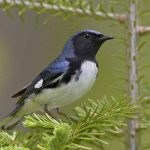
 | Trees and bushes, home sweet home for warblers | Andrews Forest LTER | Kari O'Connell | 4 | The vast coniferous forests of the Pacific Northwest provide surprisingly rich and diverse habitat types for birds. Andrews Forest is a long-term ecological research site where there have been manipulations of timber harvest and forest re-growth. This land use history has large impacts on the bird habitats found in an area. Each year since 2009, scientists have gone out and measured bird populations and habitat types. Two species of warbler, with very different habitat preferences, can give insight into how birds are responding to these disturbances. |
 | What grows when the forest goes? | Andrews Forest LTER | Kari O'Connell | 2 | The H.J. Andrews Experimental Forest in Oregon is a long-term research site where scientists study how ecosystems respond to disturbances like wildfire. After a major fire in 2023, biology teacher Matt and scientist Joe investigated how native and invasive plants recover from fires of varying severity. Using data from a 2020 fire, they analyzed plant communities to see if invasive species recovered more quickly than native ones. |
 | Benthic buddies | Beaufort Lagoon Ecosystems LTER | Katie Gavenus | 2 | Arctic lagoons support a surprisingly wide range of marine organisms! Marine worms, snails, and clams live in the muddy sediment of these lagoons. Having a rich variety of benthic animals in these habitats supports fish, which migrate along the shoreline and eat these animals once the ice has left. Ken, Danny, and Kaylie are interested in learning more about how the extreme seasons of the High Arctic affect the marine life that lives there. |
 | The birds of Hubbard Brook, Part I | Hubbard Brook Experimental Forest | Sarah Garlick & Amey Bailey | 2 | Avian ecologists at the Hubbard Brook Experimental Forest have been monitoring bird populations for over 50 years. The data collected during this time is one of the longest bird studies ever conducted! What can we learn from this long-term data set? Are bird populations remaining stable over time? |
 | The birds of Hubbard Brook, Part II | Hubbard Brook Experimental Forest | Sarah Garlick & Amey Bailey | 3 | Hubbard Brook was heavily logged and disturbed in the early 1900s. When logging ended in 1915, trees began to grow back. The forest then went through secondary succession, which refers to the naturally occurring changes in forest structure that happen as a forest ages after it has been cut or otherwise disturbed. Can these changes in habitat availability, due to succession, explain why the number of birds are declining at Hubbard Brook? Are all bird species responding succession in the same way? |
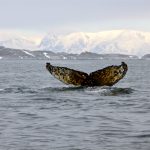 | When whale I sea you again? | Palmer Station Antarctica LTER | Janice McDonnell | 4 | People have hunted whales for over 5,000 years for their meat, oil, and blubber. Today, as populations are struggling to recover from whaling, humpback whales are faced with additional challenges due to climate change. Their main food source is krill, which are small crustaceans that live under sea ice. As sea ice disappears, the number of krill is getting lower and lower. Humpback whale population recovery may be limited because their main food source is threatened by ongoing ocean warming. |
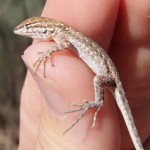 | Lizards, iguanas, and snakes! Oh my! | Central Arizona–Phoenix LTER | Lisa Herrmann | 3 | People have dramatically changed the natural riparian habitat found along rivers and streams. In many urban areas today, these riparian habitats are being rehabilitated with the hope of bringing back native species, such as reptiles. Reptiles, including snakes and lizards, are extremely important to monitor as they play important roles in ecosystems. Are rehabilitation efforts in Phoenix successful at restoring reptile diversity and abundance? |
 | The mystery of Plum Island Marsh | Plum Island Ecosystems LTER & The TIDE Project | David Moon | 3 | Salt marshes are among the most productive coastal ecosystems, and support a diversity of plants and animals. Algae and marsh plants feed many invertebrates, like snails and crabs, which are then eaten by larger fish and birds. In Plum Island, scientists have been fertilizing and studying salt marsh creeks to see how added nutrients affect the system. They noticed that fish populations seemed to be crashing in the fertilized creeks, while the mudflats were covered in mudsnails. Could there be a link? |
 | Urbanization and estuary eutrophication | Plum Island Ecosystems LTER | David Moon | 4 | Estuaries are very productive habitats found where freshwater rivers meet the ocean. They are important natural filters for water and protect the coast during storms. A high diversity of plants, fish, shellfish and birds call estuaries home. Estuaries are threatened by eutrophication, or the process by which an ecosystem becomes more productive when excess nutrients are added to the system. Parts of the Plum Island Estuary in MA may be more at risk from eutrophication due to their proximity to urban areas. |
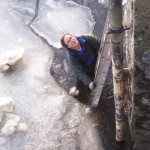
 | Does sea level rise harm saltmarsh sparrows? | Plum Island Ecosystems LTER | David Moon | 3 | For the last 100 years, sea levels around the globe have increased dramatically. Salt marshes grow right at sea level and are therefore very sensitive to sea level rise. Saltmarsh sparrows rely completely on salt marshes for feeding and nesting, and therefore their numbers are expected to decline as sea levels rise and they lose nesting sites. Will this threatened bird species decline over time as sea levels rise? |
 | Keeping up with the sea level | Plum Island Ecosystems LTER | David Moon | 3 | Salt marshes are very important habitats for many species and protect the coast from erosion. Unfortunately, rising sea levels due to climate change are threatening these important ecosystems. As sea levels rise, the elevation of the marsh soil must rise as well so the plants have ground high enough to keep them above sea level. Basically, it is like a race between the marsh floor and sea level to see who can stay on top! |
 | Is your salt marsh in the zone? | Plum Island Ecosystems LTER | David Moon | 3 | Beginning in the 1980s, scientist James began measuring the growth of marsh grasses. He discovered that their growth was higher in some years and lower in others and that there was a long-term trend of growth going up over time. Marsh grasses grow around mean sea level, or the average elevation between high and low tides. Are the grasses responding to mean sea level changing year-to-year, and increasing as our oceans warm and water levels rise due to climate change? |
 | Marsh makeover | Plum Island Ecosystems LTER | David Moon | 3 | The muddy soils in salt marshes store a lot of carbon, compared to terrestrial dry soils. This is because they are low in oxygen needed for decomposition. For this reason they play a key role in the carbon cycle and climate change. If humans disturb marshes, reducing plant diversity and biomass, are they also disturbing the marsh's ability to sequester carbon? If a marsh is restored, can the carbon holding capacity also be brought back to previous levels? |
 | Invasive reeds in the salt marsh | Plum Island Ecosystems LTER | David Moon | 2 | Phragmites australis is an invasive reed that is taking over saltwater marshes of New England, outcompeting other plants that serve as food and homes for marsh animals. Once Phragmites has invaded, it is sometimes the only plant species left, called a monoculture. Phragmites does best where humans have disturbed a marsh, and scientists were curious why that might be. They thought that perhaps it was caused by changing salinity, or amount of salt in the water, after a marsh is disturbed. |
 | Can a salt marsh recover after restoration? | Plum Island Ecosystems LTER | David Moon | 2 | Before restoration began, it was clear the Saratoga Creek salt marsh was in trouble. Invasive Phragmites plants covered large areas of the marsh, crowding out native plants and animals. Human activity was thought to be the culprit – storm drains were dumping freshwater into the marsh, lowering salinity. In 1999 a restoration took place to divert freshwater away from the marsh in an attempt to reduce Phragmites numbers. Did it work? |
 | Make way for mummichogs | Plum Island Ecosystems LTER | David Moon | 4 | Mummichogs are small fish that live in tidal marshes all along the US Atlantic coast. Because they are so widespread and can be found in most streams, they are a valuable tool for scientists looking to compare the health of different marshes. The absence of mummichogs in a salt marsh is a sign that it is highly damaged. Students collected data on mummichog numbers before and after a marsh restoration. Did the restoration successfully bring back mummichogs to the marsh? |
 | Do you feel the urban heat? | Florida Coastal Everglades LTER | Nick Oehm | 3 | Record-breaking temperatures climb higher every year, and Florida is no exception. These extreme temperatures affect organisms of all types, including humans. Irvin wanted to see how much the heat varies across Miami and compare it to the sensor at the airport that is used to issue heat warnings. He focused on sites where people gather outside - bus stops. He also chose sites that varied in shade coverage to see how temperatures fluctuate in different environments. |
 | The case of the collapsing soil | Florida Coastal Everglades LTER | Nick Oehm | 4 | The Everglades are a unique and vital ecosystem threatened by rising sea levels due to climate change. Recently scientists have observed in some areas of the wetland the soils are collapsing. What is causing this strange phenomena? Sea level rise might be stressing microbes, causing carbon to be lost to the atmosphere through increased respiration. |
 | The carbon stored in mangrove soils | Florida Coastal Everglades LTER | Nick Oehm | 2 | Mangroves are globally important for many reasons. They form dense forested wetlands that protect the coast from erosion and provide critical habitat for many animals. Mangrove forests also help in the fight against climate change by storing carbon in their soils. The balance between how much carbon is added to the soils and how much is released might be dependent on a variety of factors, including tree size and amount of disturbance to the site. |
 | Are forests helping in the fight against climate change? | Harvard Forest LTER | Clarisse Hart & Katharine Hinkle | 3 | In the 1990s, scientists began to wonder what role forests were having in the exchange of carbon in and out of the atmosphere. Were forests overall storing carbon (carbon sink), or releasing it (carbon source)? To test this, they built large metal towers that stand taller than the forest trees around them and use sensors to measure the speed, direction, and CO2 concentration of each puff of air that passes by. These long term measurements can tell us whether forests help in the fight against climate change. |
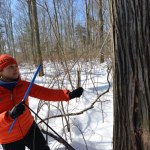 | A window into a tree’s world | Harvard Forest LTER | Clarisse Hart & Katharine Hinkle | 2 | Scientists are very interested in learning how trees respond to rapidly warming temperatures. Luckily, trees offer us a window into their lives through their growth rings. Growth rings are found within the trunk, beneath the bark. These rings provide a long historical record, which can be used to study how trees respond to climate change. |
 | Love that dirty water | Harvard Forest LTER | Clarisse Hart & Katharine Hinkle | 4 | As green spaces are lost to make room for homes and businesses, there are fewer forests and wetlands to filter our drinking water. A team of scientists used the New England Landscapes Future Explorer to study this challenge for the Merrimack River, an important river for the people of New England. |
 | Fertilizer and fire change microbes in prairie soil | Konza Prairie LTER | Jill Haukos | 4 | Prairies grow where three environmental conditions come together – a variable climate, frequent fires, and large herbivores roaming the landscape. However, prairies are experiencing many changes. For example, people now work to prevent fires, which allows forest species take over. In addition, land previously covered in prairie is now being used for agriculture. How do these changes affect the plants, animals, and microbial communities that inhabit prairies? |
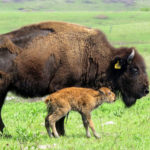 | Does more rain make healthy bison babies? | Konza Prairie LTER | Jill Haukos | 2 | The North American Bison is an important species for the prairie ecosystem. Bison affect the health of the prairie in many ways, and are also affected by the prairie as well. Each year when calves are born, scientists go out and determine their health by weighing them. This long-term dataset can be used to figure out whether environmental conditions from the previous year affect the health of the calves born in the current year. |
 | Trees and the city | Minneapolis-St. Paul Metropolitan Area LTER | Meredith Keller | 3 | Trees provide important benefits, such as beauty and shade. The number and types of tree species that are planted in a neighborhood can increase the benefits received from trees in urban areas. Based on her own observations, Adrienne started conversations with her colleagues about differences in urban landscapes. They conducted a study to see how social demographics of neighborhoods may be related to tree species richness and tree cover. |
 | Do urchins flip out in hot water? | Santa Barbara Coastal LTER | Scott Simon | 1 & 3 | Periods of unusual warming in the ocean are called marine heatwaves. During marine heatwaves, water gets 2-3 degrees hotter than normal. That might not sound like much, but for an urchin, it is a lot. The research team decided to test whether marine heat waves could be stressing urchins by looking at a simple behavior that they could easily measure - how long it takes urchins to flip back over. |
 | Catching fish with sound | Northeast U.S. Shelf LTER | Mei Sato | 4 | Climate change is warming our oceans, and scientists like Mei are studying how this affects marine food webs, especially small schooling fish that play a crucial role between predators and prey. As part of a long-term ecological research project in the Northeast U.S., Mei collects data using advanced sound technology (echosounders) to measure fish abundance, along with water temperature and depth. Her work helps build a clearer picture of how ocean ecosystems are changing over time, providing valuable information for fishers and resource managers preparing for the future. |
4.8.16
LTER Data Nuggets: Breathing new life into long-term data
The original blog post can be found on the KBS LTER website here.

Each year the KBS LTER program awards graduate students summer fellowships. Here Elizabeth Schultheis and Melissa Kjevik, now both postdoctoral researchers with Michigan State University, describe the project their summer fellowship supported.
Today it is apparent that students and the public continue to struggle when faced with data and its interpretation. When asked to make sense of data taught in their science classrooms, gathered during classroom inquiry projects, or found in the news, students are unable to connect quantitative information to explanations of the way the world works. Without exposure and practice, a large dataset or complicated graph can seem insurmountable. In collaboration with K-12 teachers, the Kellogg Biological Station (KBS) GK-12 program, BEACON, and the LTER, we created Data Nuggets to help students overcome roadblocks when working with and interpreting data.
Data Nuggets are targeted classroom activities focused on developing quantitative skills for K-16 students. They are created from recent and ongoing research, bringing cutting edge science into the classroom and helping scientists share their work with broad audiences. The standard format of each Data Nugget provides background information about a scientist and their research, along with how they became interested in their research questions and system that they study. Each Data Nugget includes a real dataset for students to graph, interpret, and use to construct an explanation.
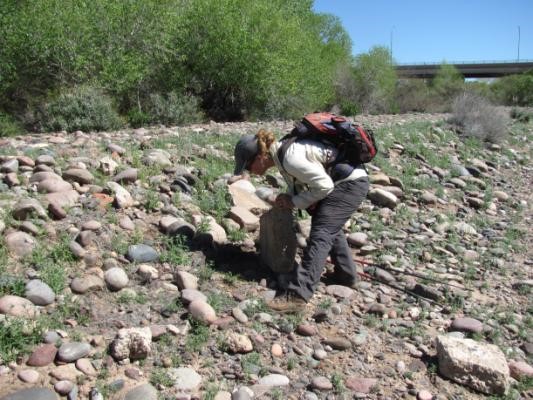
Scientist Mélanie Banville searching for reptiles in the Central Arizona-Phoenix LTER. Her and Heather Bateman’s Data Nugget, “Lizards, Iguanas, and Snakes! Oh My!”
LTER Data Nuggets
The collaboration between Data Nuggets and the LTER is a mutually beneficial fit. LTER scientists help strengthen the Data Nuggets project by increasing the diversity of data and research available to students. In turn, Data Nuggets provide an avenue for LTER scientists to share their work and findings with a broad audience of students, teachers, and fellow scientists. Sharing research findings with the non-science public is an important part of the science process, yet is often one of the most challenging to achieve. With broader impacts a factor in most grants, finding effective methods of communication and transmission is key. Researchers who create Data Nuggets must dig deep to uncover the core messages of their research and think back to the big question that got them passionate about the research in the first place. Also, by creating a Data Nugget and practicing communicating research to a 6th grader, scientists can rest assured that at their next conference they’ll be better able to discuss their work with collaborators and those outside their field!
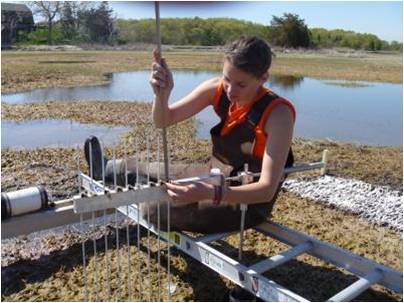
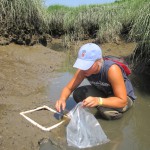
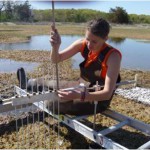
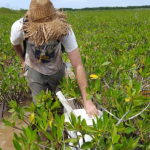
Researcher Sam Bond taking Sediment Elevation Table measurements in Plum Island Ecosystems Long Term Ecological Research site. For more information on this research, check out Anne Giblin’s Data Nugget, “Keeping Up With the Sea Level”.
Most importantly, a great outcome of using LTER data to create Data Nuggets is that teachers and students will directly benefit from additional resources that highlight the importance of data and science in an authentic context. Activities aiming to improve quantitative skills are more effective if they’re grounded in real world situations that students can relate to. Connecting science to a student’s experiences and local ecosystems makes the content more accessible, particularly for culturally and linguistically diverse students. These connections also allow students to envision a place for themselves in science. To assist with place-based learning, each Data Nugget is categorized and searchable by the location where the study occurred, allowing teachers to connect data to their students’ environment. In this way, LTER Data Nuggets have the potential to increase interest and engagement with science and data, in both students and the public.
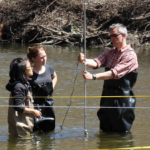
Robert Buchsbaum, from Mass Audubon, preparing his team for a morning of salt marsh bird surveys. Find out more about his research on the endangered Saltmarsh Sparrow in his Data Nugget, “Does Sea Level Rise Harm Saltmarsh Sparrows?”
Working with LTER Scientists and Educators
This past summer (2015), we received support from the LTER Summer Fellowship program. This support allowed us to continue our work with Data Nuggets, and to strengthen their connection to the vast stores of data available through the LTER, including the KBS site and the other 24 sites in the LTER Network. While the LTER Network has conducted over three decades of amazing research, spanning diverse ecosystems and taxa, LTER education and outreach specialists are still finding creative new ways to share this important research with the public. Data Nuggets can breath new life into long-term
datasets, opening them up to the public and future scientists. These funds were used to support training workshops at the LTER All Scientists Meeting (ASM) in Estes Park, CO in August and at KBS in July. These two workshops supported early and late career scientists (graduate students, postdocs, faculty, and REUs) and many LTER education and outreach specialists looking to broaden the impact of the LTER’s research and improve their communication skills. In addition, at the LTER ASM we participated in a poster session to reach out to those who were unable to attend our workshop. Our outreach efforts strengthened the connection between Data Nuggets and the LTER, and resulted in the creation of nine (and counting!) new Data Nuggets based on LTER research. Additionally, in August, we spoke to the teachers working with the KBS K-12 Partnership, connecting them with the LTER Data Nuggets and the vast pool of LTER data, freely available online.
When reflecting back on this summer, it was so great to work with a diversity of LTER scientists across the network. We enjoyed learning new science stories and are very happy to now include coastal, urban riparian, and other ecosystems in the Data Nuggets collection. Please feel free to contact Melissa or Elizabeth if you would like more information or to get started creating your own Data Nugget! For a list of all the Data Nuggets created by LTER scientists and outreach leaders, click here!
7.15.15
Increase your broader impacts with Data Nuggets! LTER ASM Meeting 2015
 Sharing research findings with the non-science public is an important part of the science process, yet is often one of the most challenging to achieve. With broader impacts a factor in most grants, finding effective methods of transmission is key. Data Nuggets, a GK-12 initiative from the Kellogg Biological Station is a practical, high-impact solution to this conundrum. If you need to increase broader impacts for your research and want to further develop your communication skills, come to our hands-on workshop and create a Data Nugget based on your research!
Data Nuggets are targeted classroom activities that emphasize developing quantitative skills for K-16 students. They are created from recent and ongoing research, bringing cutting edge science into the classroom and helping scientists share their work with broad audiences. The standard format of each Data Nugget provides a brief background to a researcher and their study system along with a dataset from their research. Students are challenged to answer a scientific question, using the dataset to support their claim, and are guided through the construction of graphs to facilitate data interpretation.
 We are currently seeking to add to our collection of Data Nuggets to showcase science done at LTER sites across the country. See examples of LTER Data Nuggets and learn more about our project by clicking on our LTER tag. During the workshop we will walk you through our templates for experimental and observational data, and help you identify a proper dataset, scientific question, and hypothesis for students of many ages. In order to finish a Data Nugget within the allotted time, participants must come to the workshop with a dataset already selected and analyzed.
- Workshop info can be found here.
- Organizers: Mary Spivey, Elizabeth Schultheis, and Melissa Kjelvik
- Monday, August 31st – Working Group Session II
7.5.25
Catching fish with sound
The activities are as follows:
- Teacher Guide
- Student activity, Graph Type A, Level 4
- Student activity, Graph Type B, Level 4
- Grading Rubric
In our ocean, the connections between the environment and marine organisms are intricate and complex. The watery surroundings connect each level of the food web – including marine mammals, large fish, schooling fish, phytoplankton, and more. Climate change is causing our ocean to become warmer, and organisms are already starting to respond. When ocean waters change, the effects cascade through different levels of the food web. In order to understand how marine organisms, and their interactions, are affected by changing climate, we need accurate measurements that tell us what populations are like today and continue monitoring into the future.
As a biological oceanographer, Mei’s research focuses on organisms in the middle of marine food webs. These are the small schooling fish, like anchovies and herring, that consume other organisms, but are also vulnerable to predation. Growing up in Japan, the ocean was always a part of Mei’s life through hobbies such as swimming, fishing, and also from knowing the cultural importance of eating seafood and learning to prepare for tsunamis. She was first introduced to ocean science through a local fisher who had an oyster farm near her hometown. Since then, she has pursued her career as an oceanographer across three different countries – Japan, Canada, and the United States – both in academia and industry.
Mei now does research as part of a Long-Term Ecological Research project out of Massachusetts. This means that Mei is part of a scientist team working together to study long-term patterns in the ocean.
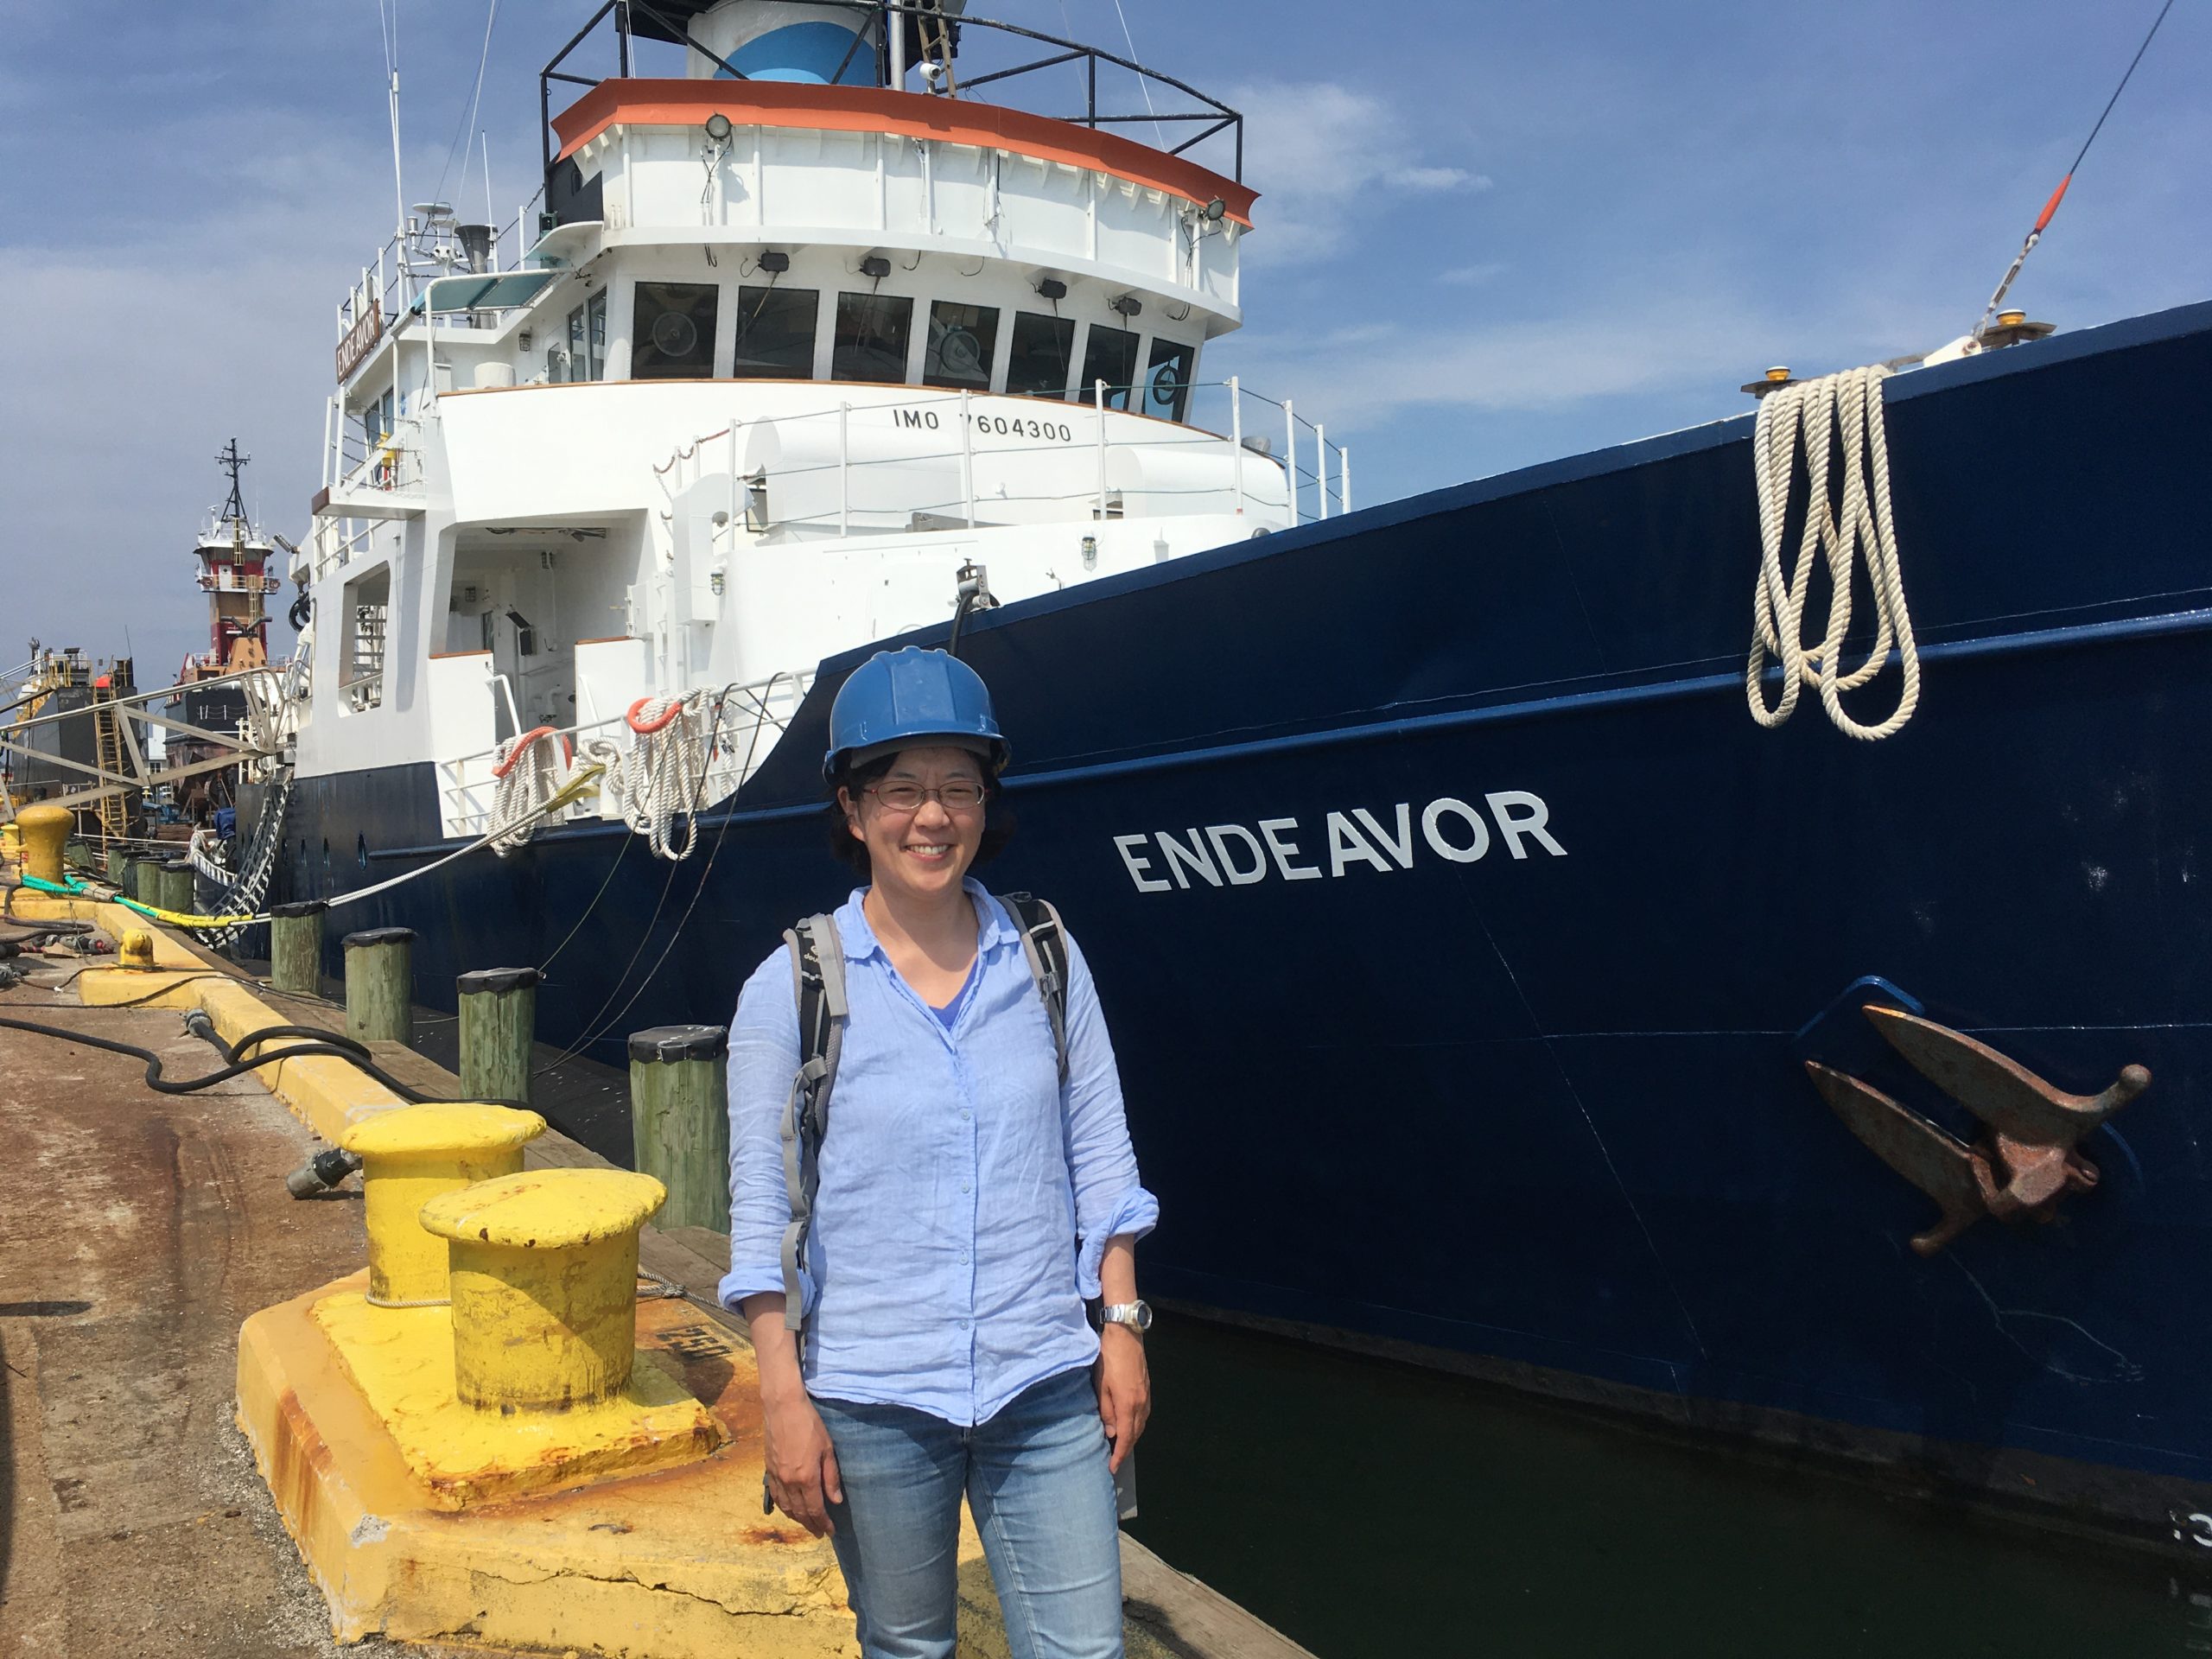
Looking at data over time allows Mei and others to better identify and understand the consequences of climate change. This information Mei next to the research vessel, Endeavor will help fishers and fisheries managers make decisions and prepare for the future.
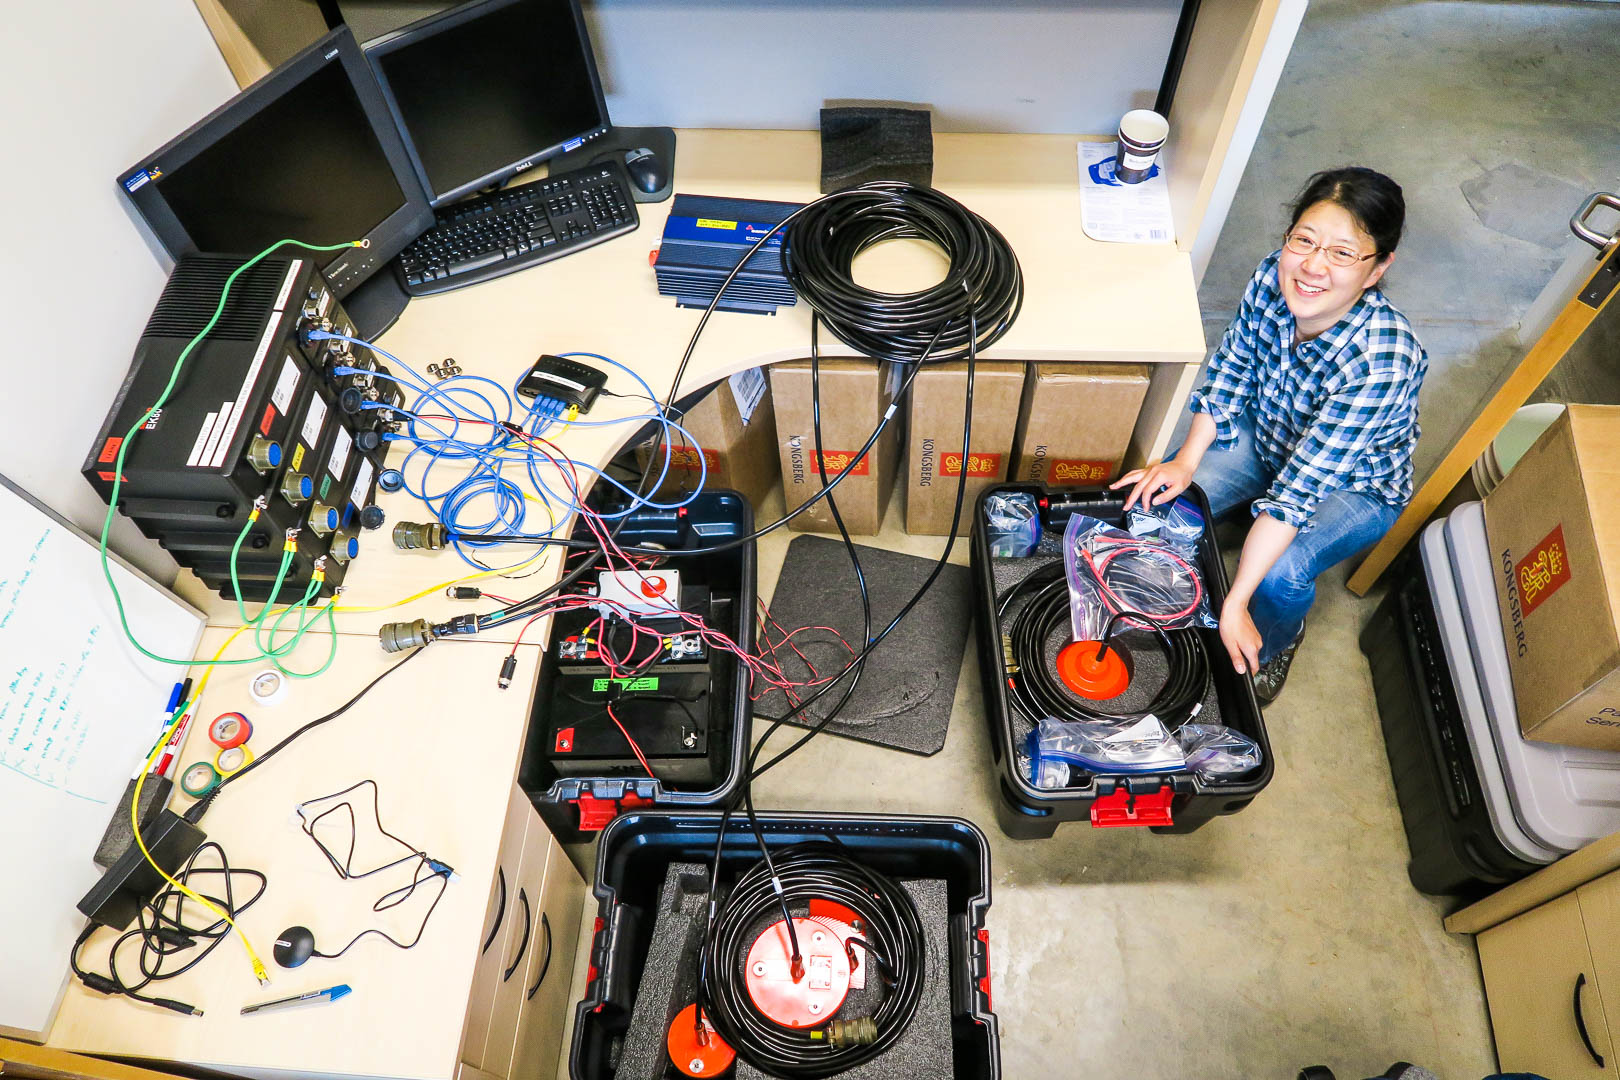
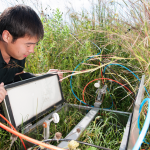
In August 2023, Mei went to sea on one of the project’s research cruises. She wanted to take a closer look at one of the fastest-warming ocean areas and richest fisheries in the world – the continental shelf of the Northeast U.S. She boarded a large research ship for 6 days with a team of 14 other scientists who specialize in different areas of oceanographic research. To more accurately collect these data, Mei used sound! Echosounders bounce sound off marine organisms, such as fish. This tool is similar to fish finders that are used by most fishing boats. However, the technology used by Mei is more sensitive and provides more detailed data.
The amount of sound that comes back to the ship after bouncing off fish or anything in the water is called volume backscattering strength, and is measured in decibels (dB). The intensity of what comes back can serve as a measure of fish abundance. If there are more fish, the number becomes larger (less negative).
While the echosounder is operating, other members of the research team measure water temperature and other parameters from the surface to near the bottom. Temperature is measured in degrees Celsius (ºC), and depth is recorded in meters (m). Mei wanted to use these data to give her a snapshot in time of where fish are located.
Featured scientist: Mei Sato (she/her) from Woods Hole Oceanographic Institution and
Northeast U.S. Shelf LTER (NES-LTER)
6.13.25
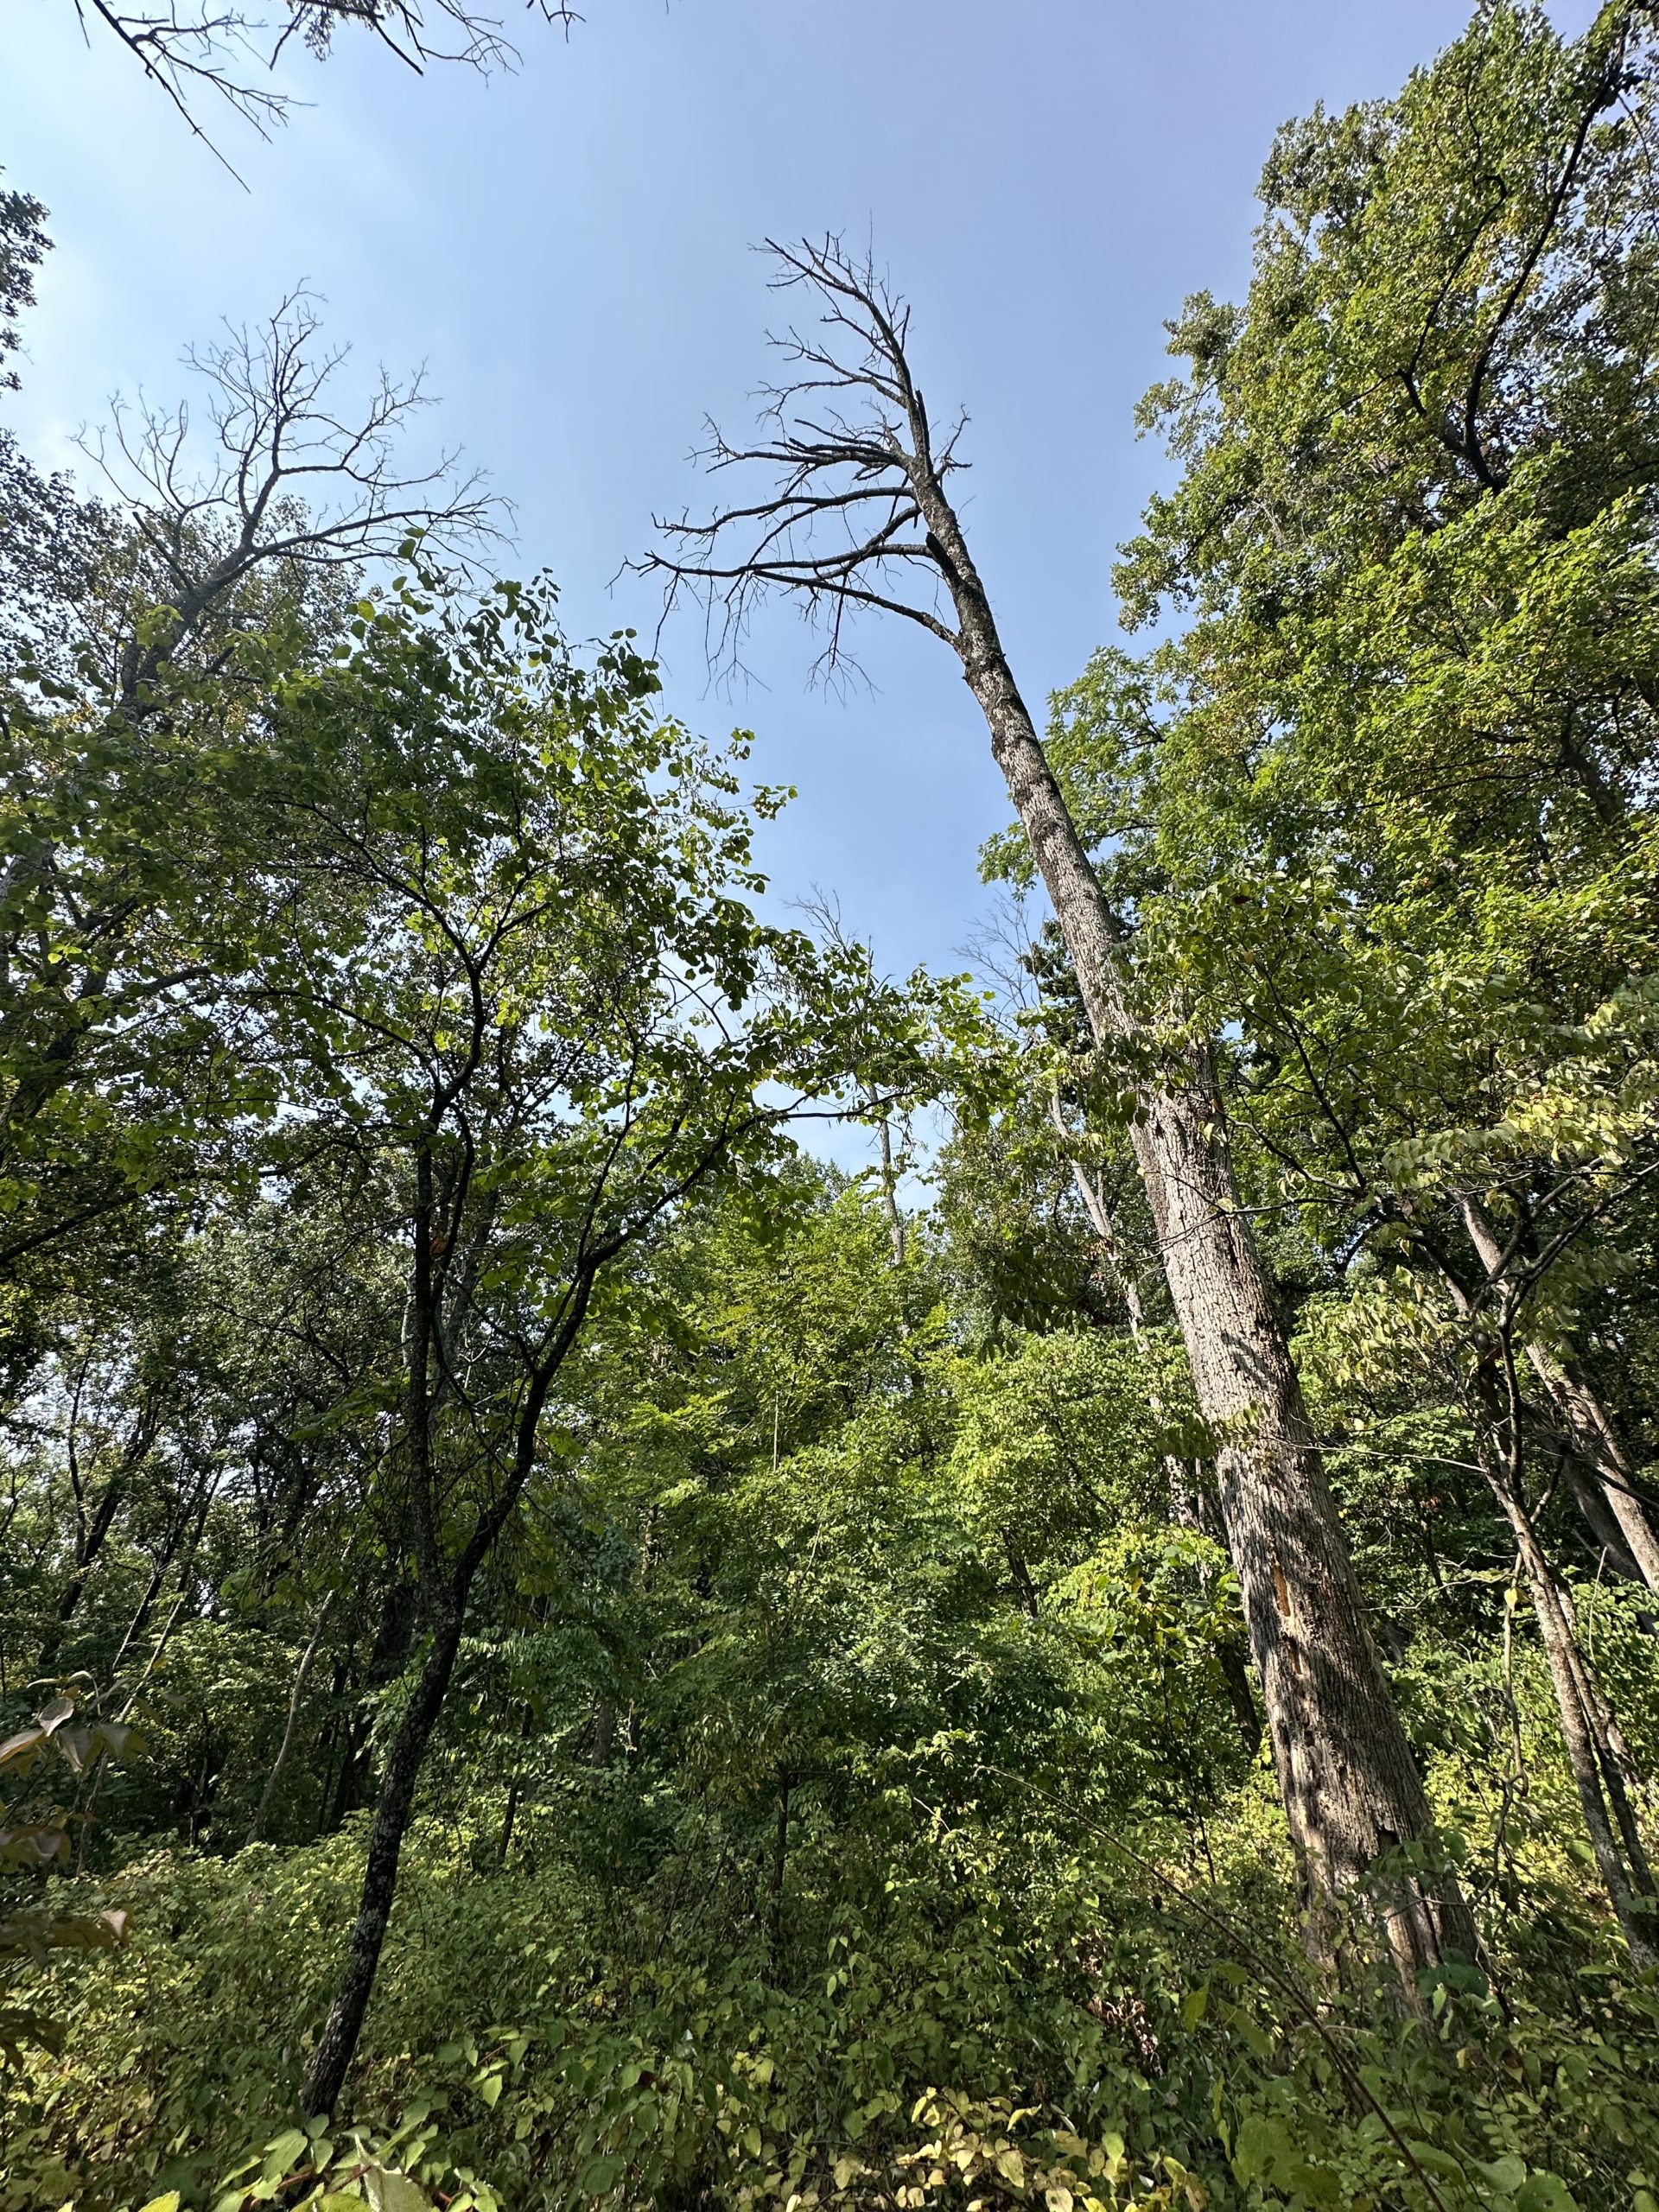
What grows when the forest goes?
The activities are as follows:
- Teacher Guide
- Student activity, Graph Type A, Level 2
- Student activity, Graph Type B, Level 2
- Student activity, Graph Type C, Level 2
- PowerPoint of images
- Grading Rubric
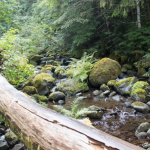
The H.J. Andrews Experimental Forest, or Andrews for short, is a long-term ecological research site in the Cascade Mountains of Oregon. The forest is a temperate old-growth rainforest. It is known for its lush and green understory of flowering plants, ferns, mosses and a towering canopy of Douglas fir, Western hemlock, Red cedar, and other trees. Scientists have spent decades studying how plants, animals, land use, and climate are all connected in this ecosystem.
Matt is a biology teacher who has spent two summers in the field working with scientists at the Andrews. These experiences have been valuable ways to bring real data and research back to his students! When he visits, Matt works closely with Joe and Cole. Joe is a scientist who has spent many years working in the forest studying the impact of disturbances on plants. Cole is in Joe’s lab and has been focusing on fire’s effects on the forest during graduate school.
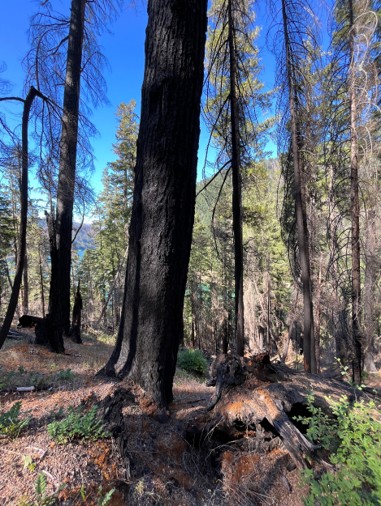
Historically, large, severe fires have been a part of the ecology of forests in Oregon. They typically occur every 200-500 years. Many of the plants at the Andrews Forest are those that can deal with fire. Fires clear out dead plants, return nutrients to the soil, and promote new growth of understory and canopy plants. With climate change impacting temperature and rainfall across the globe, forests in Oregon are increasingly experiencing longer periods of dry and hot weather. These changes are causing an increase in the frequency and severity of wildfires.
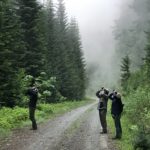
On Matt’s last day at the Andrews in 2023, a lightning strike started a wildfire in a far corner of the forest. With hundreds of firefighters on the ground and several helicopters in the air, the “Lookout Fire” burned for several months, consuming about 70% of the Andrews forest!
When Matt returned in the summer of 2024, it looked nothing like the forest he had left. The fire completely changed the course of his research experience. When he saw the scorched forest, he began to wonder how it would recover. He also observed that the fire had not burned at the same intensity throughout the forest. Some areas of Andrews were burned more, and in some spots, the fire had been less intense.
Matt thought that some plants may do better after a severe burn, while other species might do worse. Specifically, Matt wanted to see whether native and invasive plants would show differences after a fire. Plants that have historically grown in an area without human interference are called native plants. These plants have a long history of adapting to the specific conditions in an area. When a plant species is moved by humans to a new area and grows outside of its natural range, it is called an invasive plant. Invasives often grow large and fast, taking over habitats, and pushing out native species. Invasive plants tend to be the ones that can grow fast and handle disturbances, so the team expected that invasive species would recover more quickly than native plants after high severity fires.
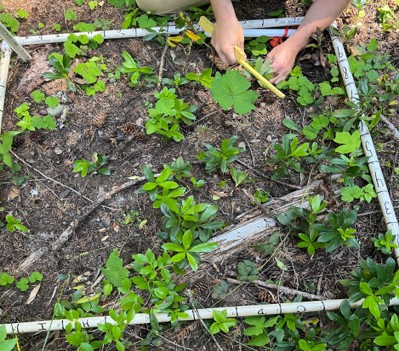
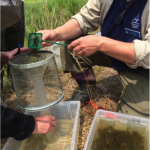
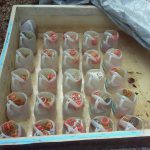
It was still too early to re-enter the areas burned by the Lookout Fire, so Matt and Joe chose another recent fire. They used data collected from a section of the forest that had burned in 2020. In 2021, a year after the fire, scientists put out 80 plots that were 1m2 in size to collect data on the understory plants.
Each section was given a burn severity value based on the amount the canopy trees had burned directly over the plot. Scientists would look up at the tree canopy and see how much was missing, and the more that was gone, they knew the burn severity had been higher. Scientists then identified every species of plant in the plots and counted the number of individual plants of each species. This was repeated every year after 2021 to observe changes over time. Matt and Joe decided to analyze data from 2023, which Matt helped collect with Cole. To answer their question, they calculated the proportion of invasive plants in each plot.
Featured scientists: Joe LaManna (he/him) and Cole Doolittle (he/him) from Marquette University and
Matt Retterath (he/him) from Fridley Public Schools.
Flesch–Kincaid Reading Grade Level = 8.9
Additional teacher resources related to this Data Nugget:
There are two blog posts written about the Andrews LTER research featured in this activity.
- https://lternet.edu/stories/fire-brings-new-perspectives-on-disturbance-at-h-j-andrews-experimental-forest/
- https://lternet.edu/stories/burned-forest-bleached-reef-lter-sites-adapt-to-learn-from-disturbance/
5.30.25
CO2 and trees, too much of a good thing?
The activities are as follows:
- Teacher Guide
- Student activity, Graph Type A, Level 4
- Student activity, Graph Type B, Level 4
- Student activity, Graph Type C, Level 4
- PowerPoint of images
- Grading Rubric
The amount of carbon dioxide (CO2) in the atmosphere has steadily increased since the start of the Industrial Revolution in 1750. This extra CO2 traps heat like a blanket, causing the global climate to warm. The resulting climate change effect is known and widely accepted in science. While scientists are certain that climate change is happening, they still have many questions about its impacts.
For example, scientists today are exploring whether climate change will help or hurt trees and forests. Many scientists think that elevated CO2 in the atmosphere can actually help trees. We can see why in the formula for photosynthesis:
6𝐶𝑂2+6𝐻2𝑂+𝐸𝑛𝑒𝑟𝑔𝑦→𝐶6𝐻12𝑂6 +6𝑂2
Carbon Dioxide + Water + Energy (sunlight) → Glucose + Oxygen
If you add more CO2 to the atmosphere, trees will have more resources for photosynthesis and can make more glucose. Glucose is food for the trees. Trees can use their glucose for growth, using it to make wood. However, trees sometimes have to put glucose towards other things. Just like us, plants break down glucose for energy through cellular respiration:
C6𝐻12𝑂6 +62→ 6𝐶𝑂2+6𝐻2𝑂+𝐸𝑛𝑒𝑟𝑔𝑦
Glucose + Oxygen → Carbon Dioxide + Water + Energy (ATP)
Trees need energy for everyday functioning, or to respond to stress. Under climate change, trees might experience more stress. Stress for trees might increase if summer temperatures get too hot, or they don’t have enough water. More stress means more respiration and less growth. Or, even worse, the trees could die. Dead trees can’t photosynthesize, and they also decompose, which releases CO2 into the atmosphere
as microbes break down wood and other materials.
Kristina and Luca are scientists looking at the effects of climate change on trees. They wanted to test whether climate change was benefitting or hurting trees. They set out to find some data that would allow them to test these alternative hypotheses.
will return to the atmosphere through decomposition.
Kristina runs a tree census in a forest at the Smithsonian Conservation Biology Center in Virginia. Since 2008, she and many other scientists have surveyed every tree in their 26-hectare plot. Every five years, they count up how many trees are alive, how much they’ve grown, and how many have died. Luca joined Kristina’s lab in 2022. He and Kristina worked together with many other scientists to collect and process data on tree growth and mortality in 2023.
They used this growth and mortality data for individual trees to calculate levels of carbon gained and lost by the whole forest. The amount of carbon used for growth across the whole forest was measured as the mass of carbon gained. They also calculated the weight of the trees that died, which was measured as the mass of carbon lost. Both of these measurements were calculated in megagrams (Mg, that’s one million grams) of carbon (C) per hectare (ha) of forest per year (yr), or (MgC/ha/yr). The difference between these
two values is the change in carbon. This value gives the balance between carbon gained and lost. A positive value means there is more carbon being taken in by the forest than lost, and a negative value means that more carbon is being lost back to the atmosphere.
Featured scientists: Kristina J. Anderson-Teixeira (she/her) & Luca Morreale (he/him) at Smithsonian’s National Zoo & Conservation Biology Institute. Written by Ryan Helcoski
4.18.25
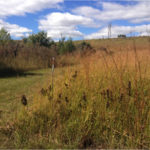
Farms in the fight against climate change
The activities are as follows:
- Teacher Guide
- Student activity, Graph Type A, Level 4
- Student activity, Graph Type B, Level 4
- Student activity, Graph Type C, Level 4
- Grading Rubric
- Scientist profile
Carbon, when it is found in the soil, has a lot of benefits. Soil carbon makes water more available to plant roots, supports microbes and insects, helps water move through the soil and not flood at the surface, and holds on to critical nutrients for plants, like nitrogen and phosphorus. It is a key measure of soil health used by farmers.
The more carbon stored in soils, the less that ends up in our atmosphere as greenhouse gas, which contributes to climate change. Farming practices that increase soil carbon are a double benefit – they help crop plants grow and produce more return for farmers, while also helping to fight climate change.
Yet, accumulating carbon in the soil is a slow and mysterious process. It can take decades to see greater levels of carbon in most agricultural soils. Farmers need information about which farming practices reliably and continually increase soil carbon.

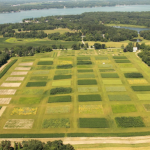
Caro is a soil scientist working with farmers to figure out how they can increase carbon in their soils. Her passion for soils brought her to the Kellogg Biological Station. This site is very special because it houses the Long-Term Ecological Research Program, which has been running the same experiment since 1989! When the study began, the soils were the same across the site. But, after decades of different treatments taking place in research plots, a lot has changed above and below ground.
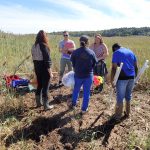
In 2013, a team of scientists worked to sample soil carbon at this site, 25 years after the experiment began. The team processed the samples to determine the percent, by weight, of each soil sample that is made up of carbon. This is called % soil carbon. They collected samples from 4 different treatments, each with 6 replicate plots:
(1) Conventional: plots grown in a corn soybean-wheat crop rotation. The soil in these plots is tilled during spring, meaning they are disturbed and turned over. These plots represent how agriculture is conventionally done in the area with standard chemical inputs of fertilizer, herbicides, and pesticides.
(2) No-till: plots that are grown in the same way as conventional, but with one key difference. The soil in these plots is not tilled, meaning it has been undisturbed for 25 years at the time of sampling.
(3) Cover crops: plots grown similarly to conventional, with a few key differences. First, cover crops were added. Cover crops are plants that are planted alongside crops or at times of the year when the main crop is not growing. This means the soil has living plant roots year-round, not just during the season with crops. Second, this treatment had no chemicals added; all nutrients came from the addition of manure. These plots were tilled.
(4) Not farmed: non-agricultural plots growing in a diverse mix of plant species. Plots are unmanaged, but are sometimes burned to keep out woody species.
These 4 treatments represent different ways that land can be managed. The goal of the study was to see how different types of land management had changed % soil carbon over time. When Caro came to KBS in 2018, she was excited to see such a cool dataset waiting to be analyzed! She thought that keeping the soil undisturbed and having living roots in the soil for more of the year would increase soil carbon over time. This led her to predict that she would see higher % spoil carbon in the cover crop and no-till treatments, compared to conventional.
Featured scientist: Caro Córdova from University of Nebraska-Lincoln and the W. K.
Kellogg Biological Station Long Term Ecological Research Program.
Flesch–Kincaid Reading Grade Level = 4.1
Additional teacher resources related to this Data Nugget:
The results from this study are published and the article is available online.
Table 2 in the paper matches the dataset that students are working with in this activity.
If students want to read more about this paper, there is a blog post summarizing the study.
The full dataset is also available online in the Dryad Digital Repository. The file has lots of details about the variables measured and the different cropping systems studied. The first tab of the spreadsheet contains the data used in this activity, plus many more variables and treatments that students can explore to ask new questions!
More information on Regenerative Agriculture from MSU here.

These data are part of the Kellogg Biological Station Long Term Ecological Research Program (KBS LTER). To learn more about the KBS LTER, visit their website.
4.7.25
Data Nuggets awarded the Huxley from the Society for the Study of Evolution

The SSE T. H. Huxley Award Committee has announced the winner of the 2025 T. H. Huxley Award, Dr. Elizabeth Schultheis, Education and Outreach Coordinator for the Kellogg Biological Station Long-Term Ecological Research Program at Michigan State University, for her collection of educational resources called “Data Nuggets”. Data Nuggets, which are developed in collaboration with Dr. Melissa Kjelvik, bring real data and scientific role models into the classroom to build quantitative and critical thinking skills.
As part of the award, Dr. Schultheis will receive funding to present her work at the National Association of Biology Teachers (NABT) conference in October.
The T. H. Huxley Award is administered by the T. H. Huxley Award Committee, a subset of the SSE Education and Outreach Committee.
2.10.25
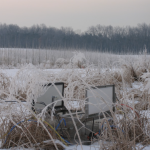
Science Doesn’t Stop in the Winter!
When the days grow shorter and the landscape is blanketed in snow, it might seem like nature has gone dormant. Trees stand bare, ponds freeze over, and many animals disappear from sight. But winter is a critical time for many species. Researchers brave the cold to study how organisms survive and even thrive in winter’s harsh conditions.
For many species, winter isn’t an obstacle—it’s a necessity. Some organisms have evolved incredible adaptations to endure the cold. Insects use snow as an insulating blanket and even plants rely on winter conditions, with some seeds requiring a cold period before they can sprout.
But winter isn’t what it used to be; Climate change is altering seasonal patterns, leading to shorter, warmer winters. These changes disrupt the delicate balance that many species depend on. Snow cover is disappearing earlier, and fluctuating temperatures cause unpredictable freeze-thaw cycles, which can be harmful to plants and animals alike.
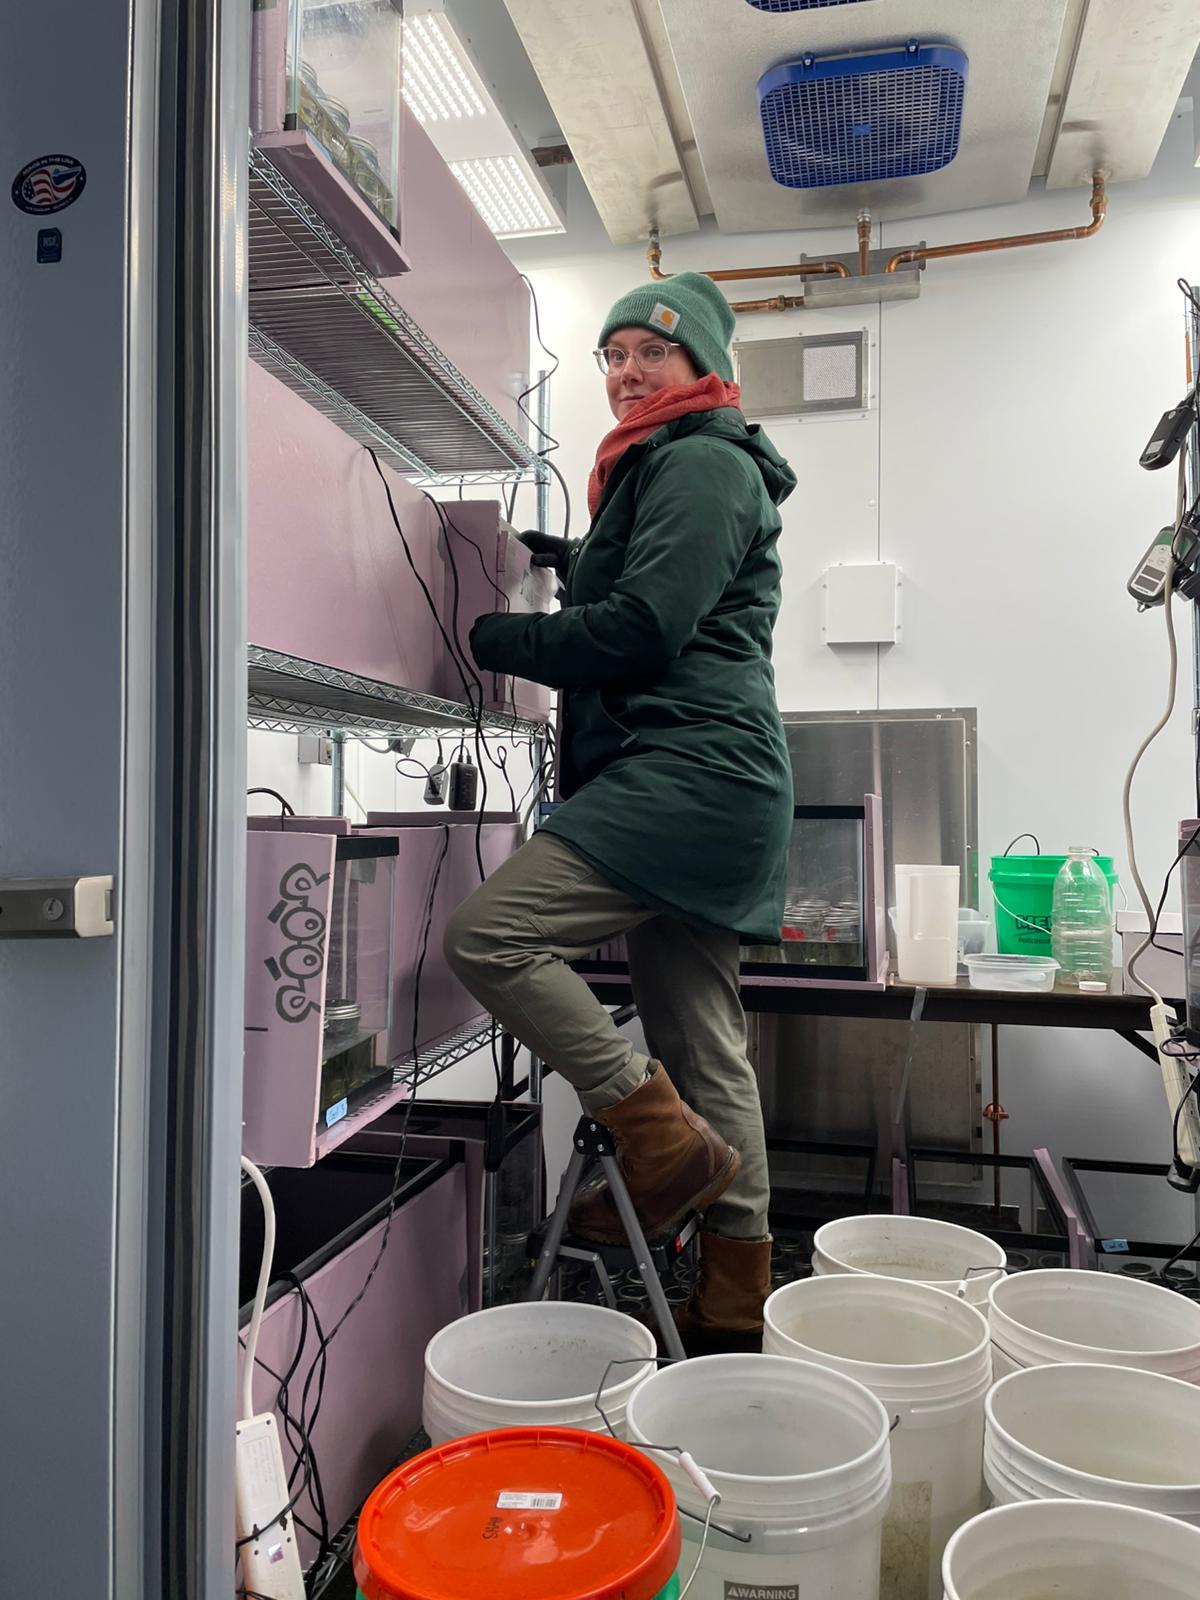
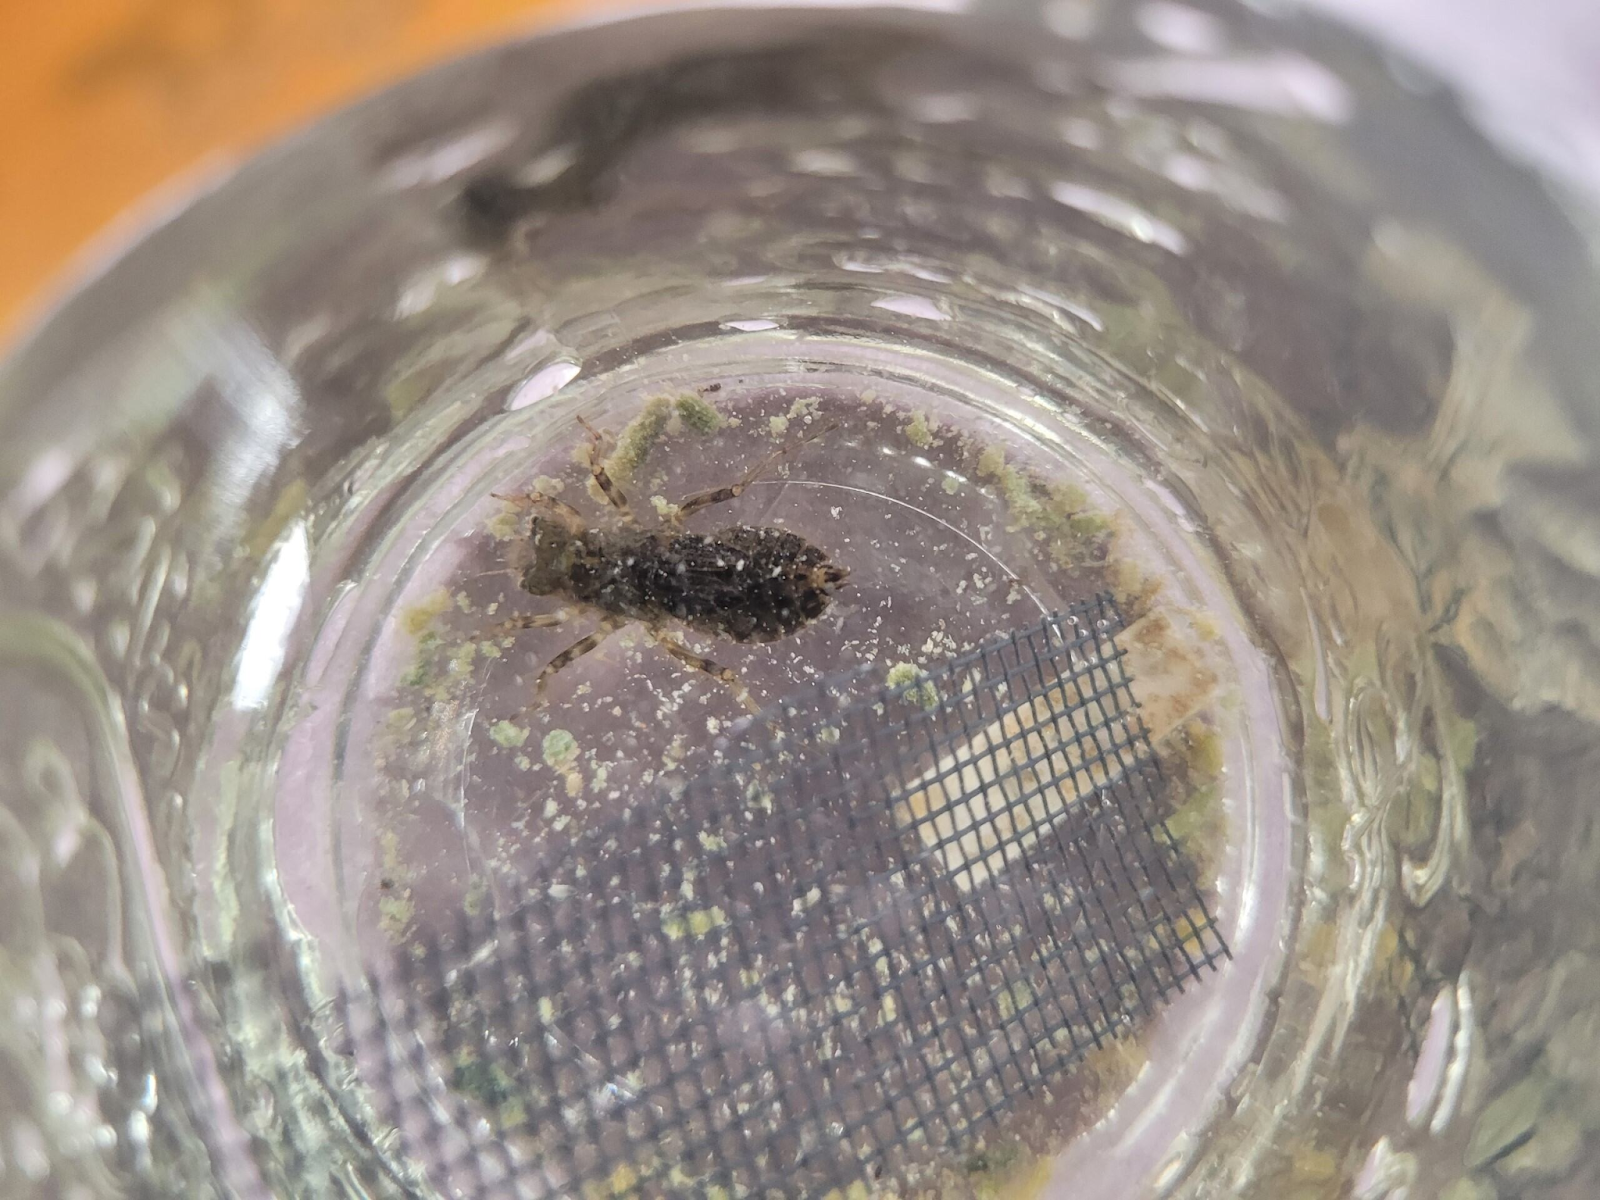
Postdoctoral researcher associate Rosemary Martin (Rosie) studies how cold temperatures affect the development of organisms, particularly dragonfly larvae. These larvae spend their early lives underwater before emerging as winged adults, and rather than hibernating in winter, they remain active. Understanding how temperatures shape their development is crucial, especially as climate change alters seasonal temperature patterns.
To investigate this, Rosie and her colleagues conduct lab experiments with six species of dragonflies. They expose them to different pre-winter temperatures before placing them in bio chambers at 4°C—mimicking the temperature of water beneath the ice. By measuring metabolic rates and analyzing fat and protein levels, they aim to uncover how different pre-winter conditions influence their health and survival. If larvae grow faster or slower due to higher pre-winter temperatures, it could impact the entire food web, from the predators that rely on dragonflies to the insects they eat.
“They actually stay active through the winter,” Rosie explains. “You can imagine how having built up resources—and still burning through them during the winter—affects their body condition in the spring. That’s what we’re trying to understand.”
Despite the cold temperatures, Rosie notes that “this is the part that I enjoy the most. […] Part of the reason I got into winter ecology is because I wanted an excuse to get outside into the field all year round.” Winter ecology does come with its unique challenges though. It is often understudied as it doesn’t line up with the usual academic schedule. “There’s also the danger of working on ice,” Rosie mentioned, “especially during the shoulder seasons when it’s less stable. And, of course, a lot of people just don’t think about winter as a biologically active season. […] But in these mid-latitude to high-latitude environments it is obviously a really impactful environmental filter.”
One surprising fact Rosie often shares is that many people don’t realize dragonflies have an aquatic stage at all. “First, I have to explain that, and then I get to the fact that they’re active through the winter—which surprises not just the general public but even some ecologists.”
A Data Nugget on Rosie’s research will be published shortly!
Getting Students Involved in Winter Science
For educators or students interested in exploring winter science, Rosie offers creative ideas. “If you have access to a refrigerator—and don’t mind keeping live insects in there—it can serve as a great proxy for an aquatic winter environment at 4°C,” she suggests. A mini bio chamber with LED lights and a timer can simulate winter conditions.
For those exploring the outdoors, Rosie recommends digging under the snow to examine leaf litter insects. “Try warming them up and see how long it takes for them to resume activity—that can give you insights into their overwintering strategies!” Other ideas include observing animal tracks, studying winter-active birds, and comparing how different types of trees handle the cold.

Bringing Winter Science to Your Classroom With Data Nuggets
Winter offers countless opportunities to engage students in real-world science. Data Nuggets provides resources to explore seasonal changes, including lessons on:
- How road salt affects freshwater ecosystems
- The importance of snow cover for insect survival
- How climate change is shifting winter conditions
- How animals adapt to survive freezing temperatures
These lessons use real data collected by scientists, allowing students to analyze patterns and draw their own conclusions. By bringing winter science into the classroom, you can help students see that research doesn’t stop when the temperature drops—it simply takes on a new form.
So, this winter, bundle up and explore the science happening all around you! Whether it’s tracking animal footprints in the snow, investigating how ice forms, or analyzing real-world data, there’s no shortage of discoveries waiting to be made.
External Links:
