Search Results for: lter

Microbes facing tough times

Jennifer sampling soil before the shelters were set up. Here you can see the control (left) and carbon addition (right) plots.

The activities are as follows:

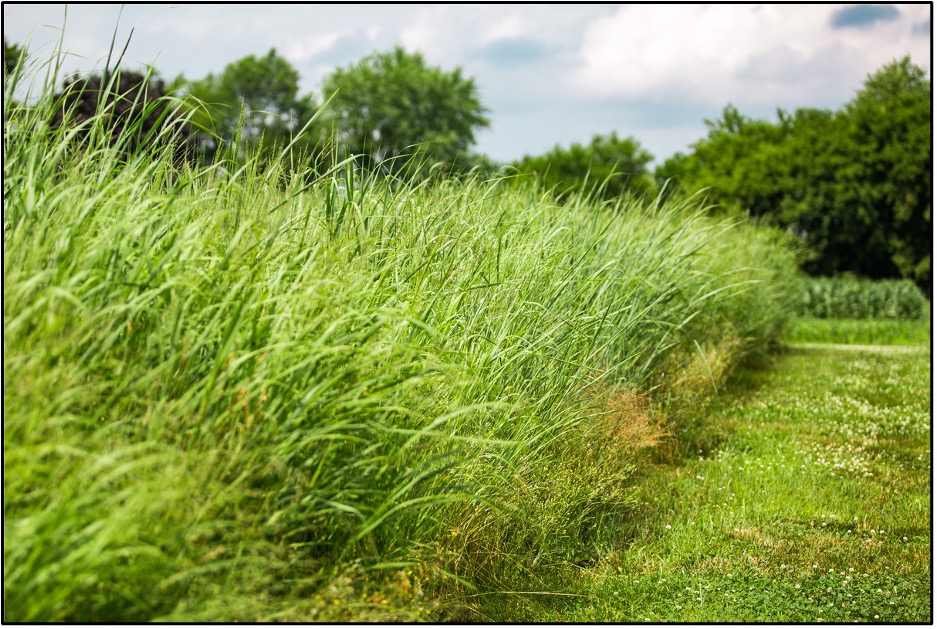
As the climate changes, Michigan is expected to experience more drought. Droughts are periods of low rainfall when water becomes limiting to organisms. This is a challenge for our agricultural food system. Farmers in Michigan will be planting crops into conditions that make it harder for corn, soybean, and wheat to grow and survive.

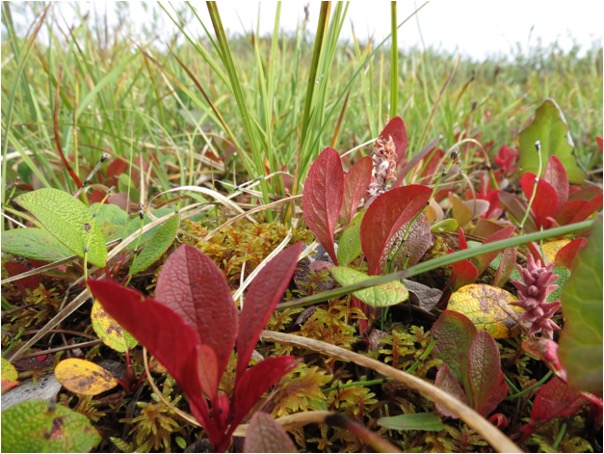
Scientists are looking into how crop interactions with other organisms may help. Microbes are microscopic organisms that live in soils everywhere. Some microbes can help crops get through time times. These beneficial microbes are called mutualists. They give plants nutrients and water in exchange for carbon from the plant. Microbes use the carbon they get from plants as food. If plants are stressed and don’t have any carbon to give, microbes get carbon from dead plant material in the soil.

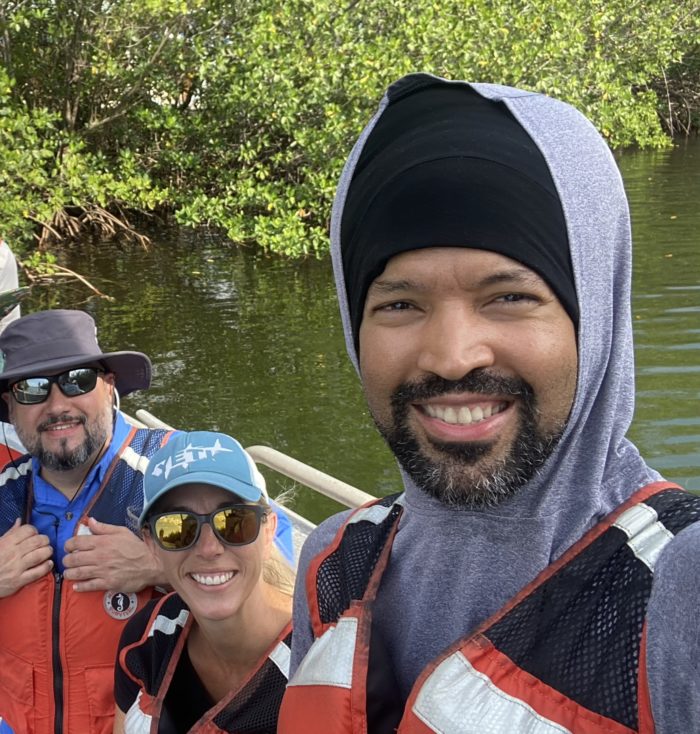
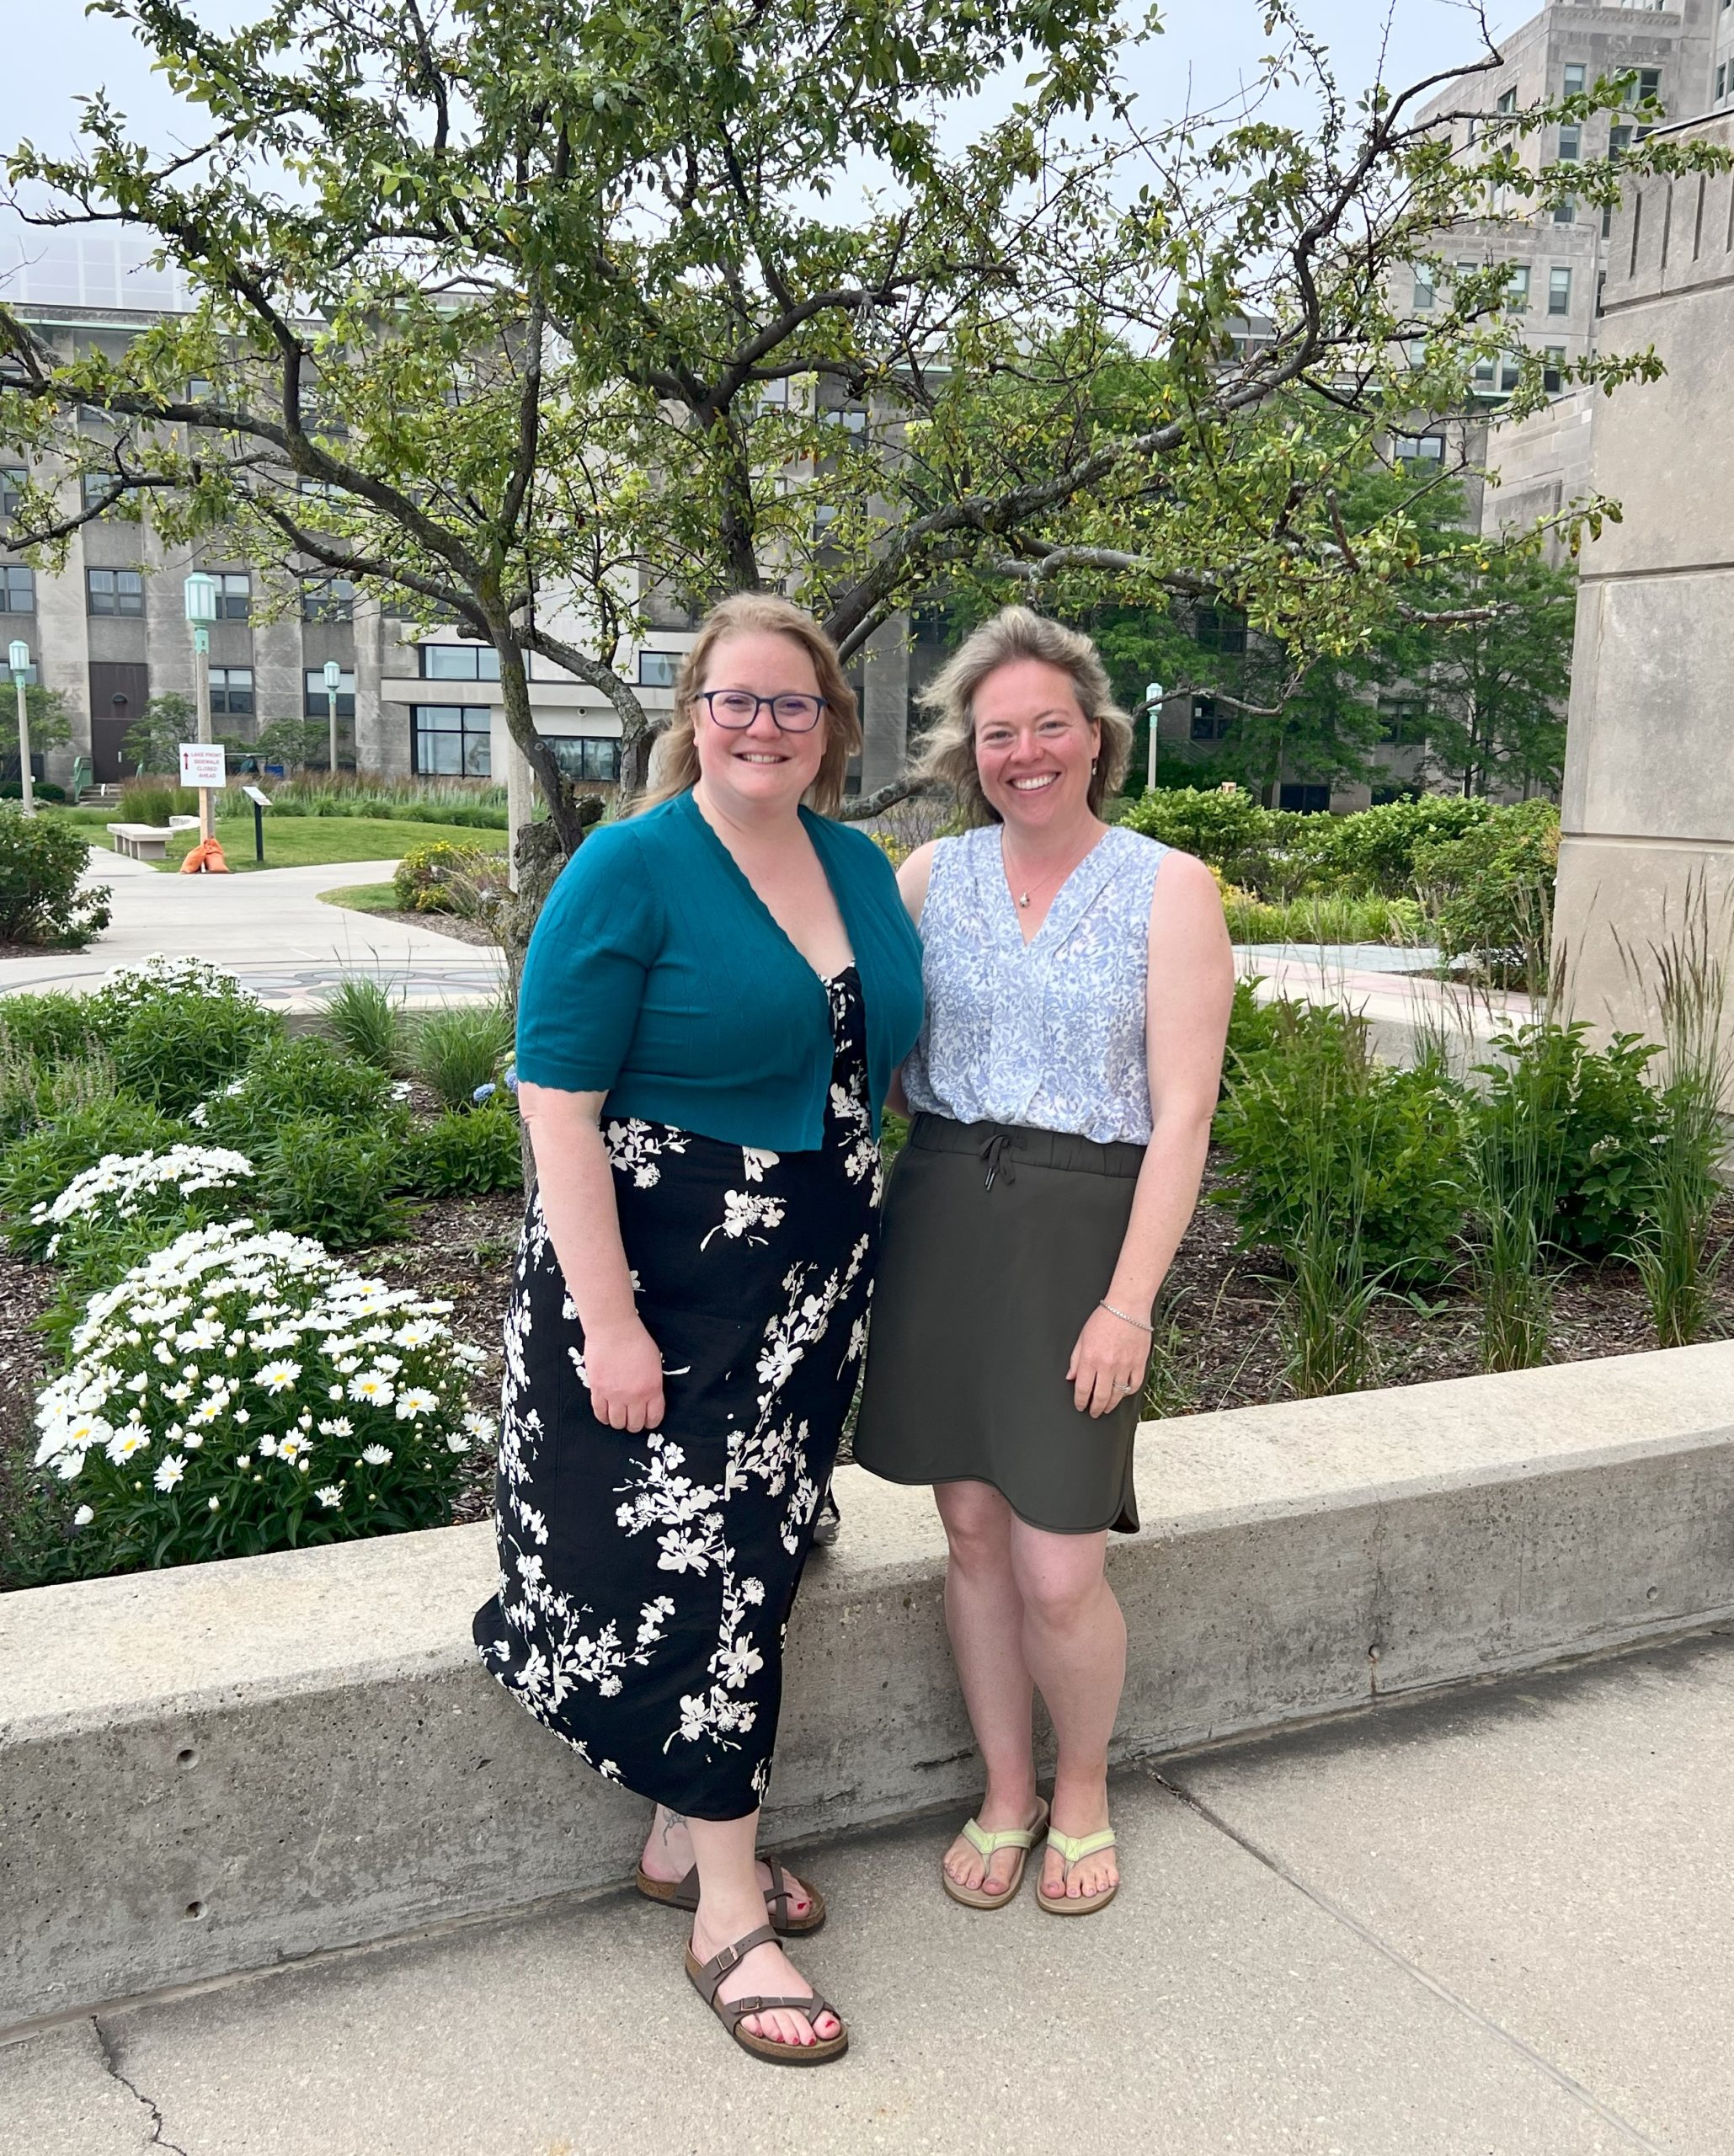
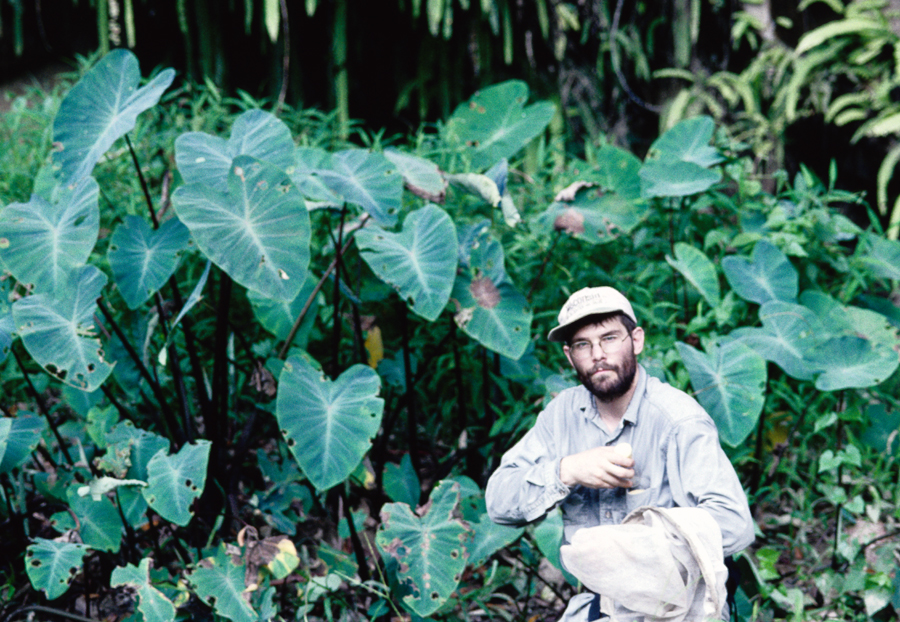
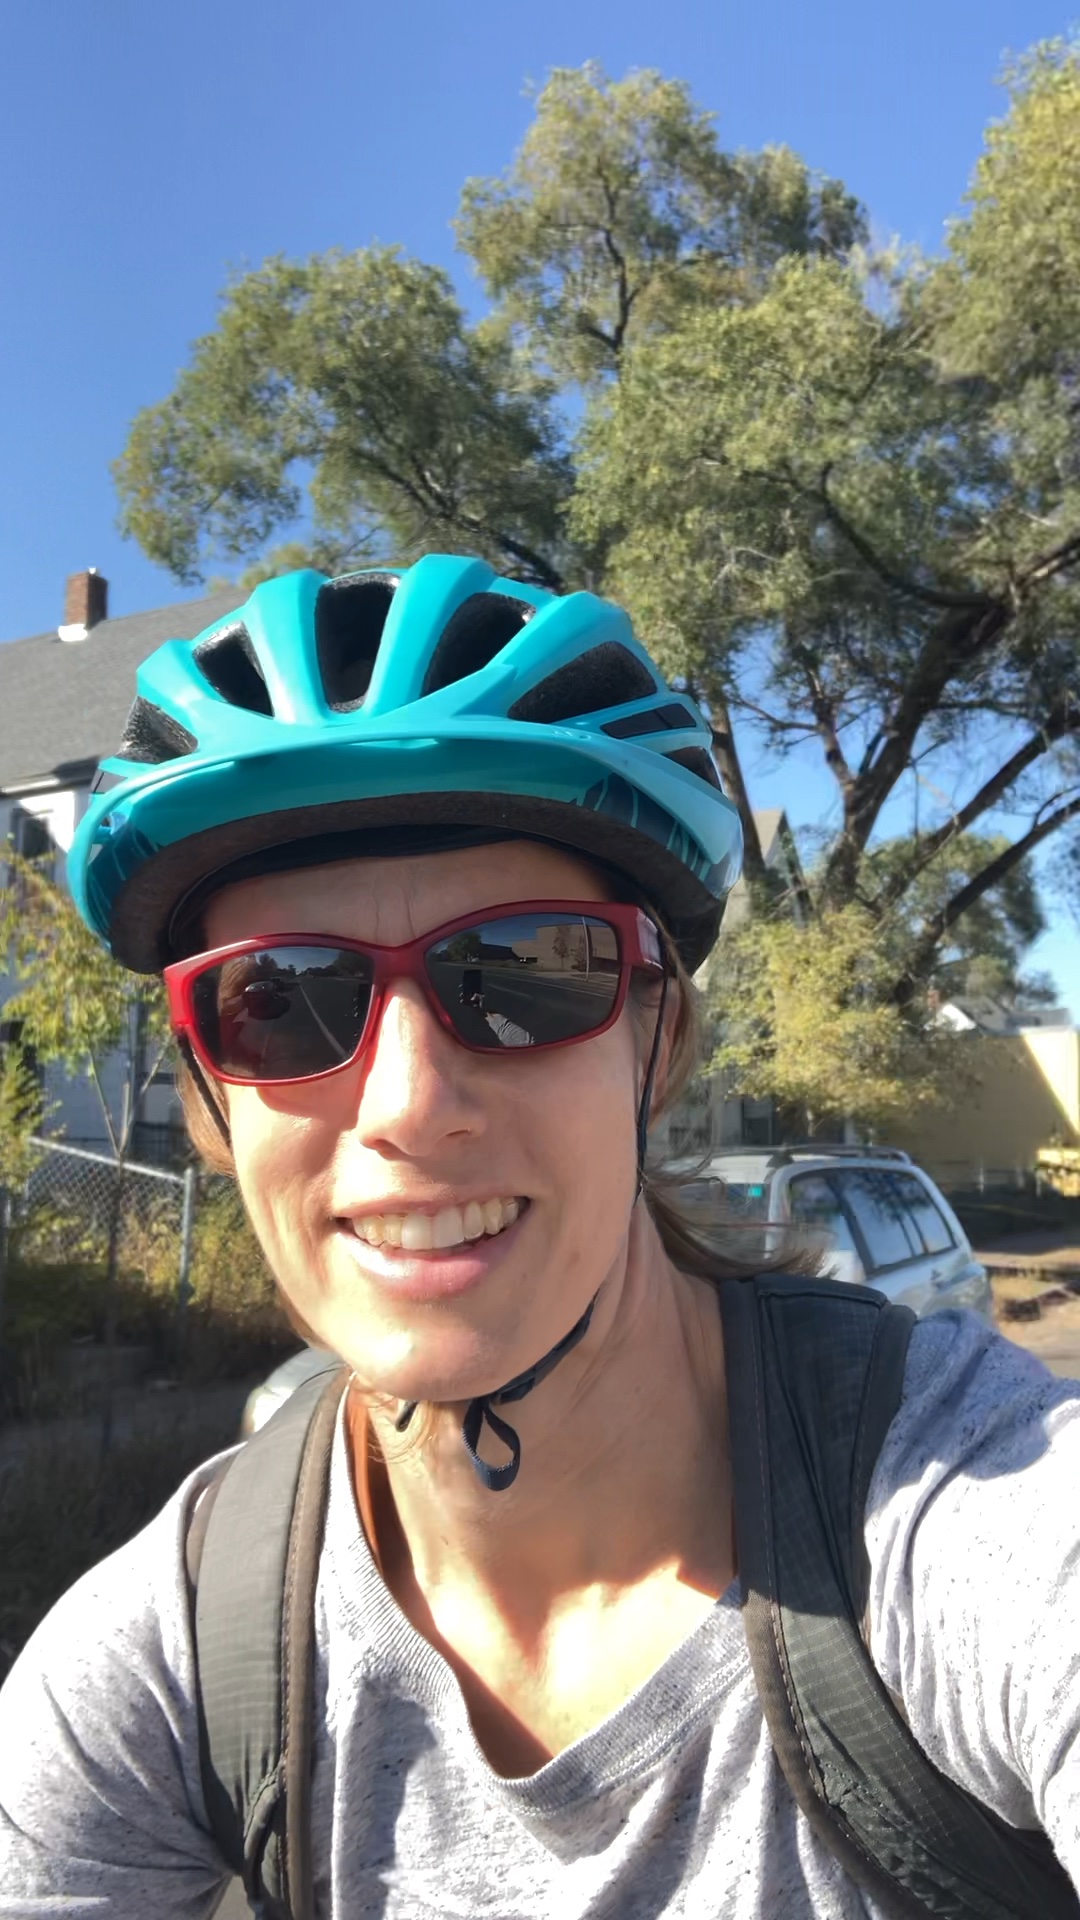
Jennifer is a biologist studying the role of microbes in agriculture. She has always been interested in a career that would help people. As a student, Jennifer thought she would have a career in politics. Along the way, she learned that a career in science is a great way to study questions that may lead to solutions for the challenges we are facing today. Jennifer was drawn to the Kellogg Biological Station, where she joined a team of scientists studying the impacts of climate change and drought on agriculture.

Jennifer and other scientists set out to test ways that we can give mutualists in the soil a boost. She thought, perhaps if we were to give microbes more food, they would be less stressed during a drought and would be able to help out crops growing in these stressful conditions.

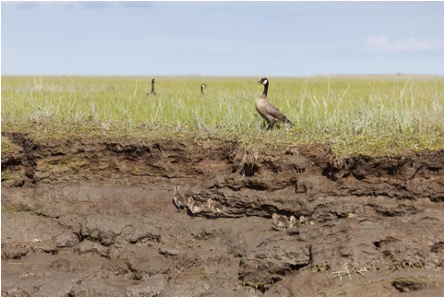
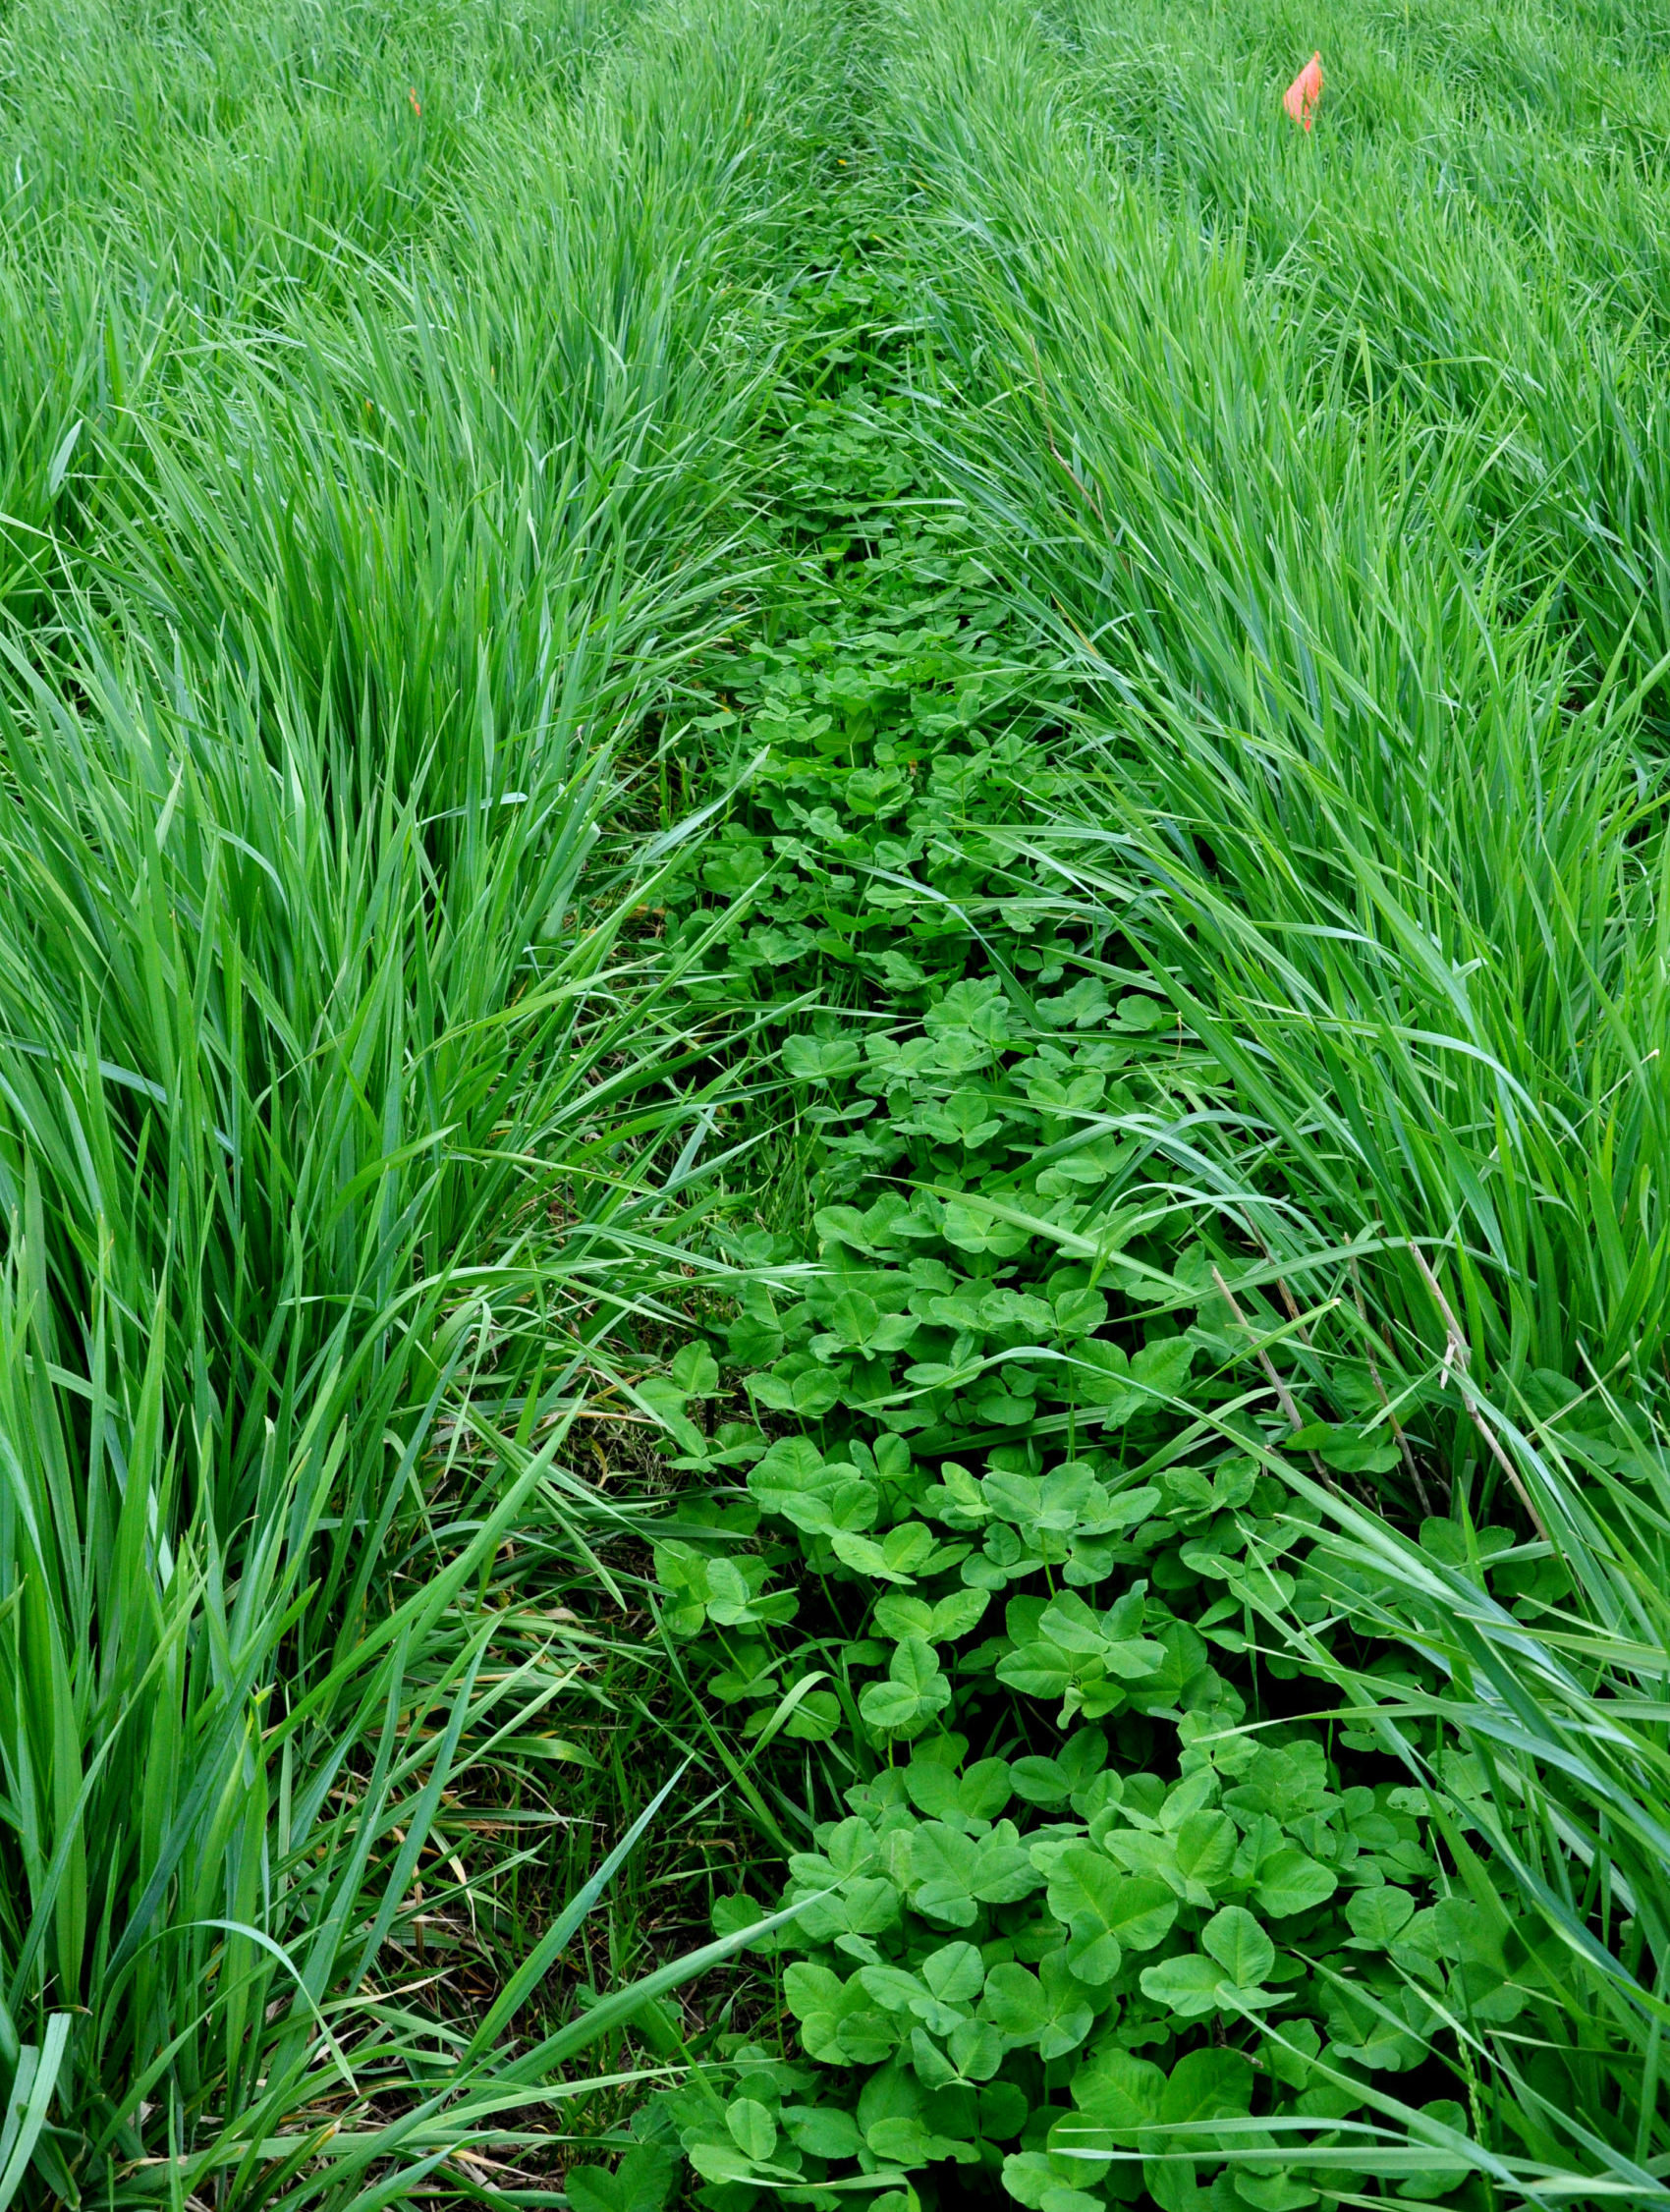
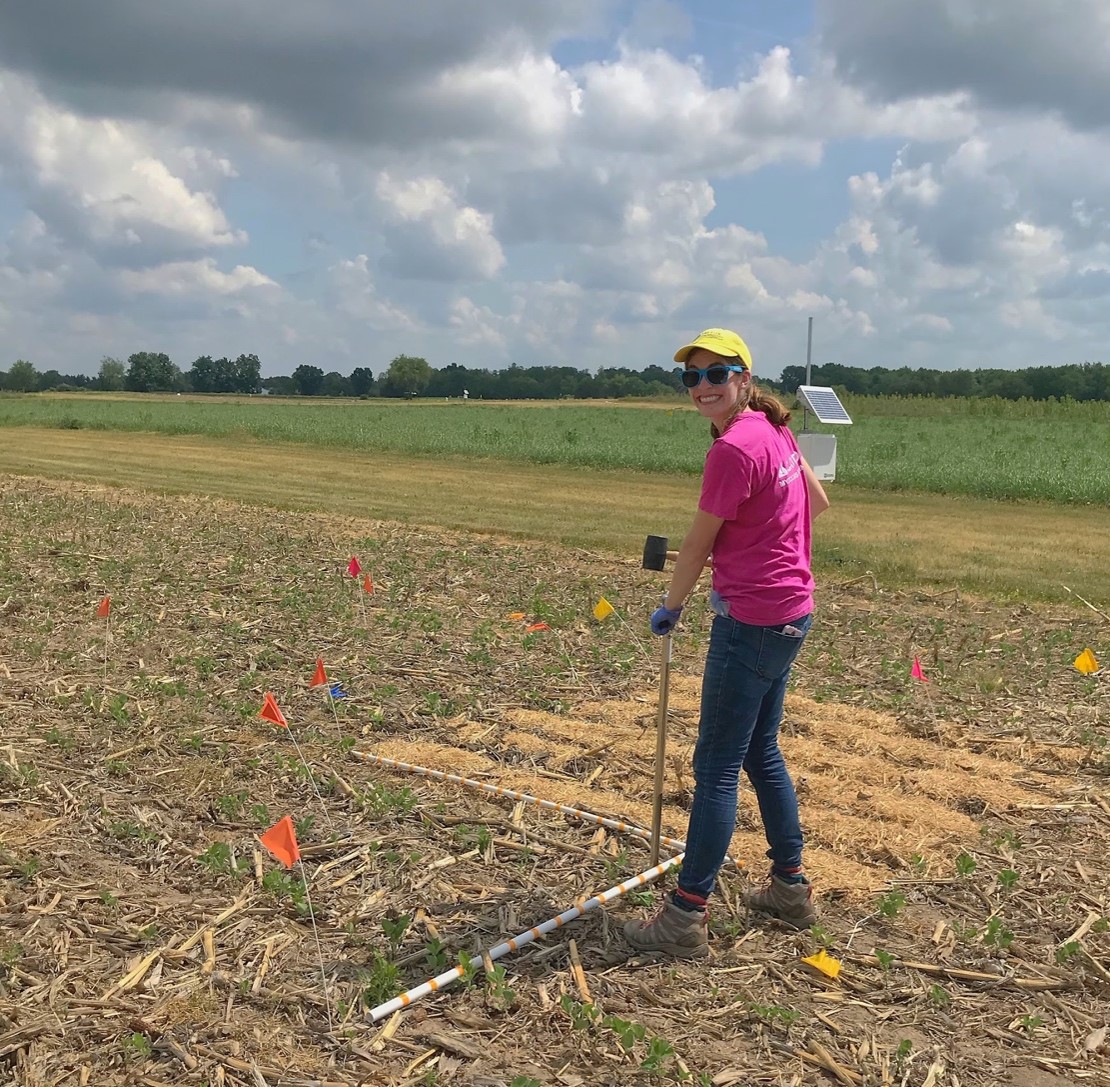
To test this idea, Jennifer needed to test how well microbes were doing under different carbon and drought conditions. First, she set up treatments in soybean fields to manipulate the amount of carbon in the soil. She set up control plots where she left the soil alone. She also set up carbon treatment plots where dead plant litter was added to the soil to increase the carbon available to microbes.

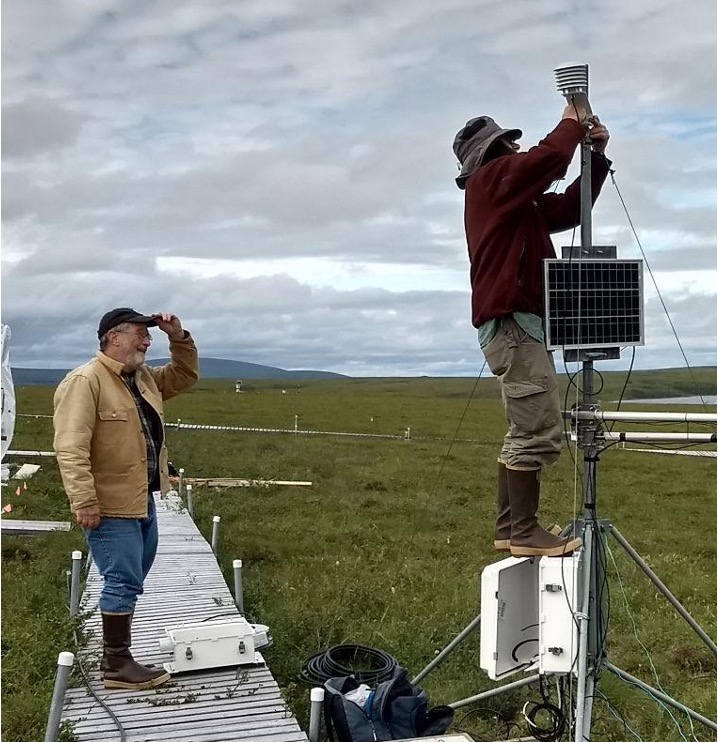
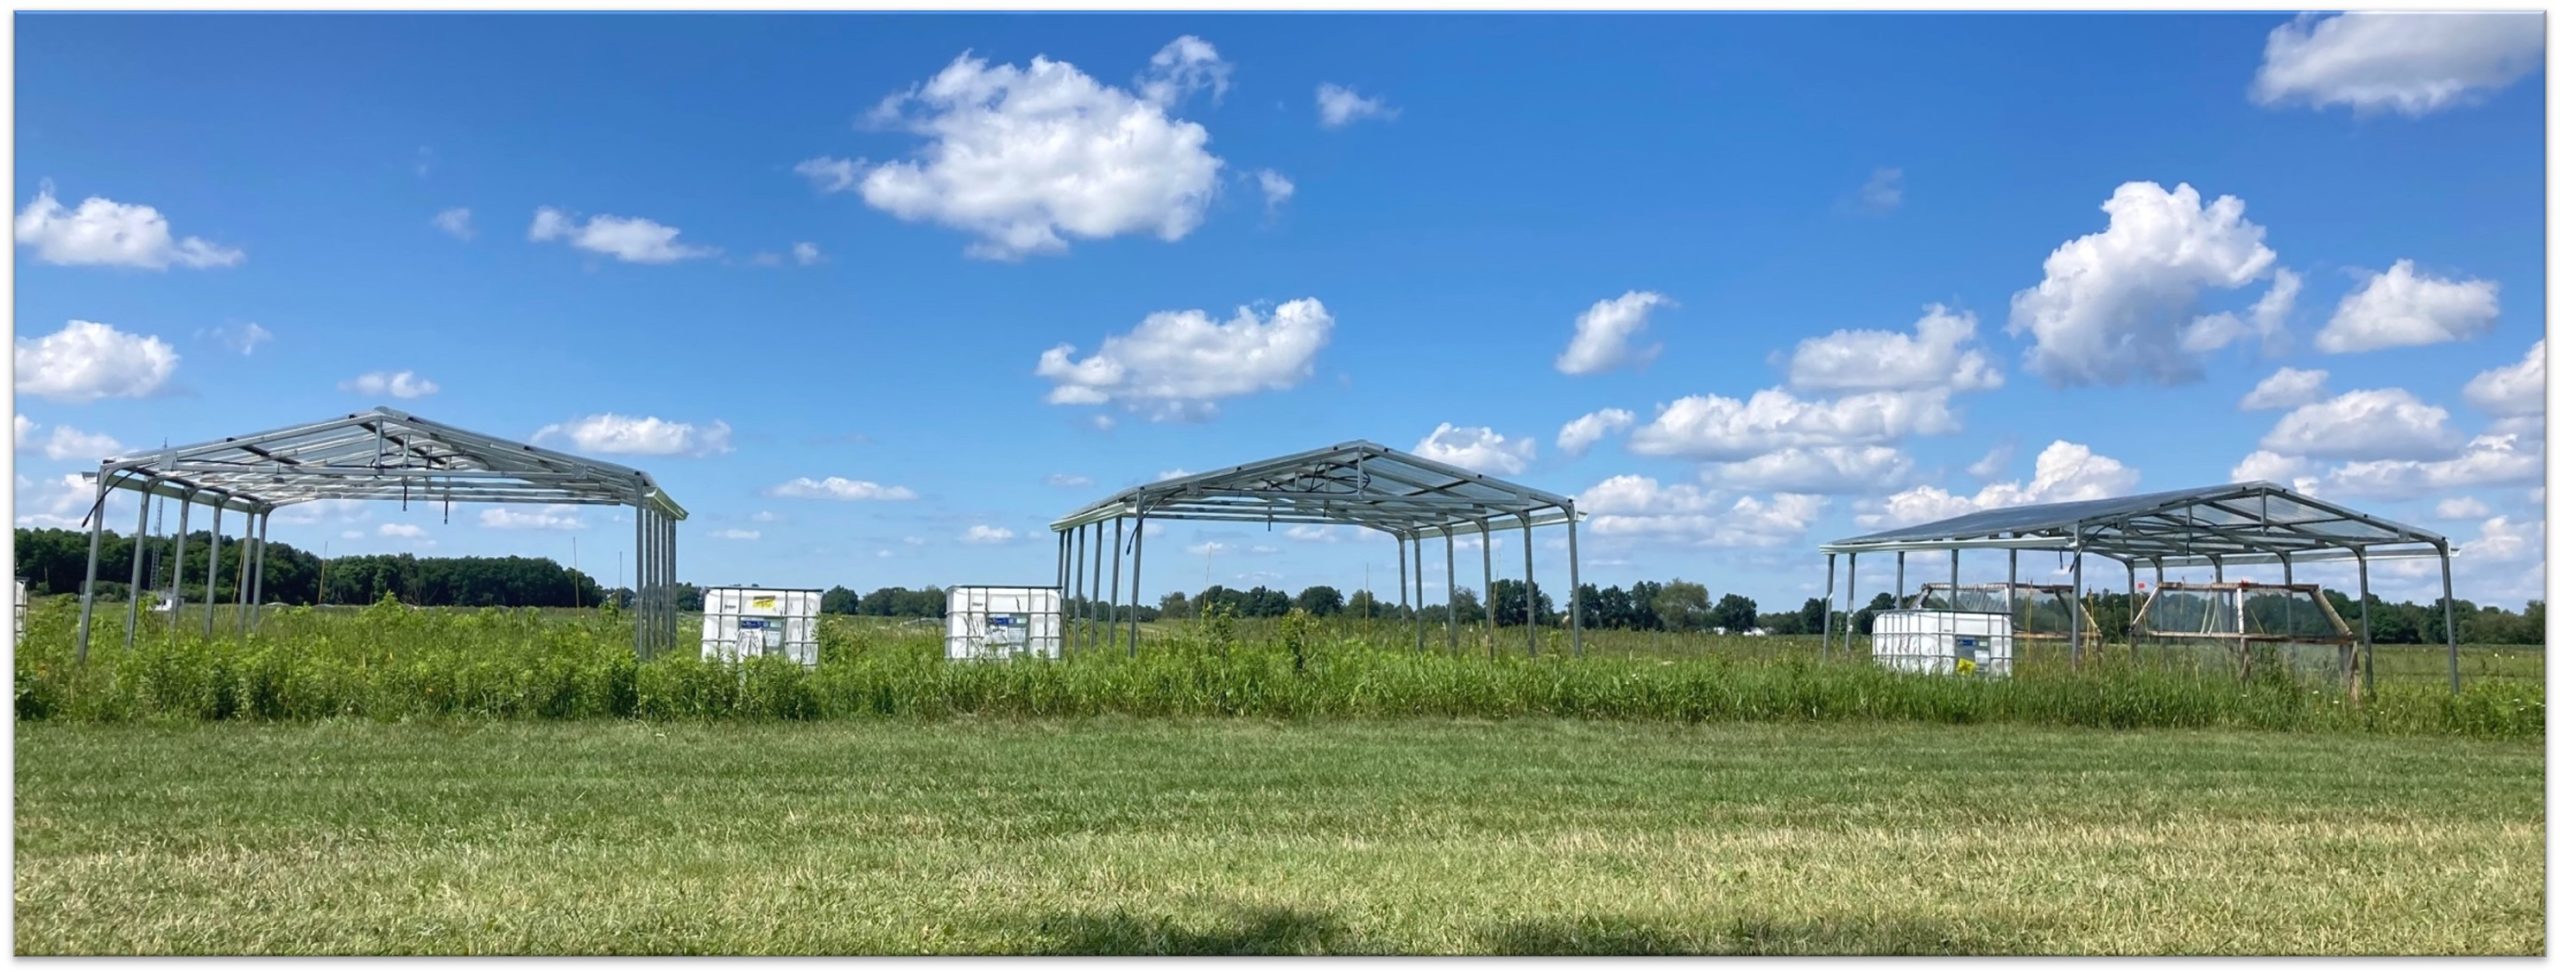
Next, Jennifer manipulated the availability of water in her plots to test the microbes under stress. To do this, she set up her plots under shelters that kept out rain. The shelters had sprinklers, which were automated to add specific amounts of water to the plots. This design allowed Jennifer to control the watering schedule for each plot. One shelter treatment was a control, where water was added to the plots every week. This is similar to the schedules of local farmers who add water through irrigation. The other shelter treatment was drought, where plots received no water for six weeks. This experiment was replicated 4 times, meaning there were 4 shelters on the control watering schedule and 4 shelters that were under drought conditions.

A view of one of the shelters used in Jennifer’s experiment.

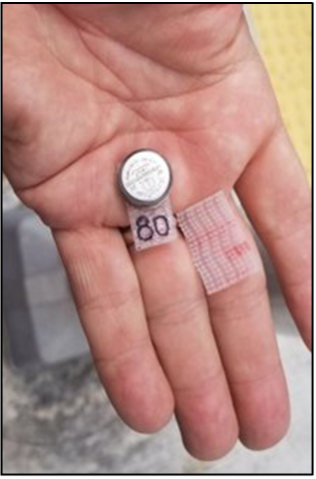
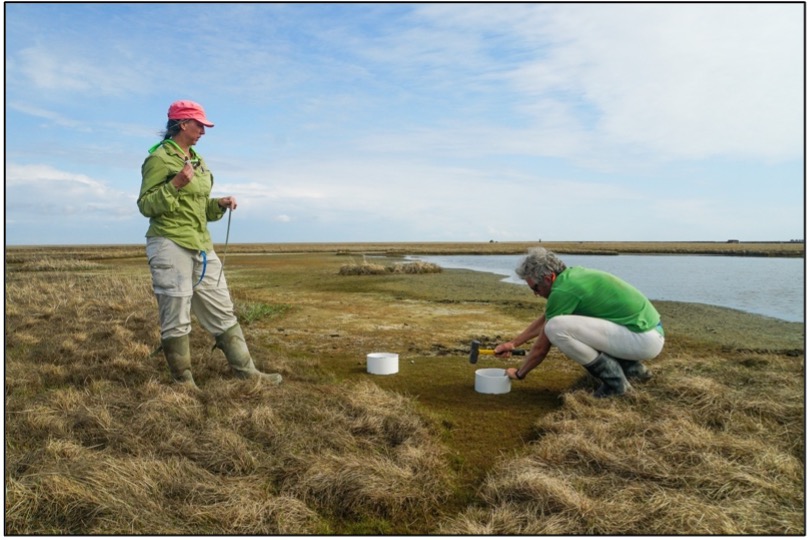
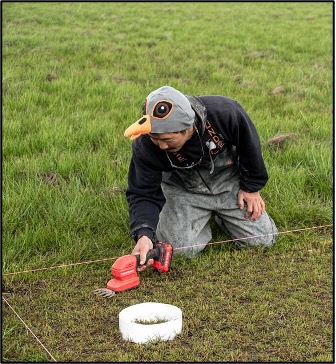
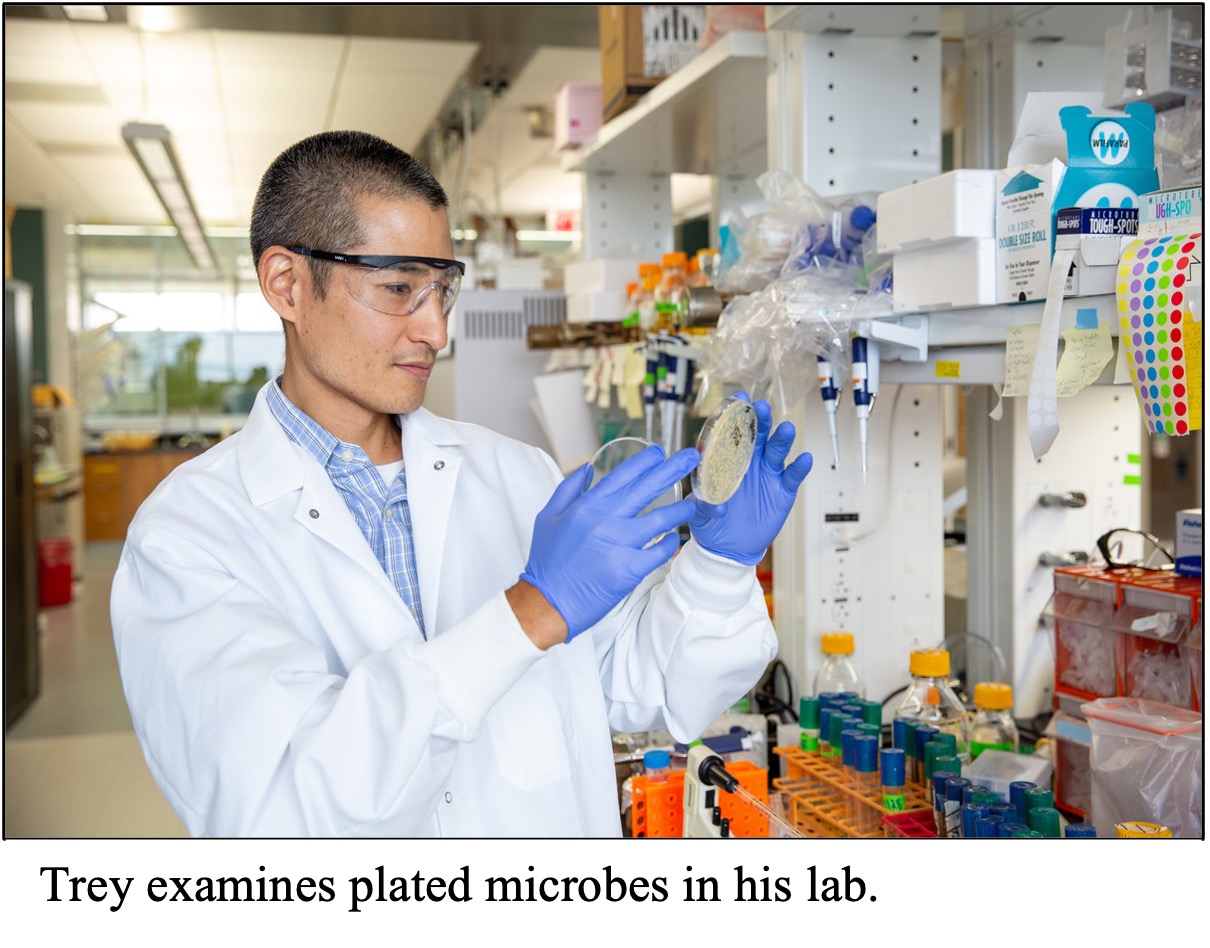
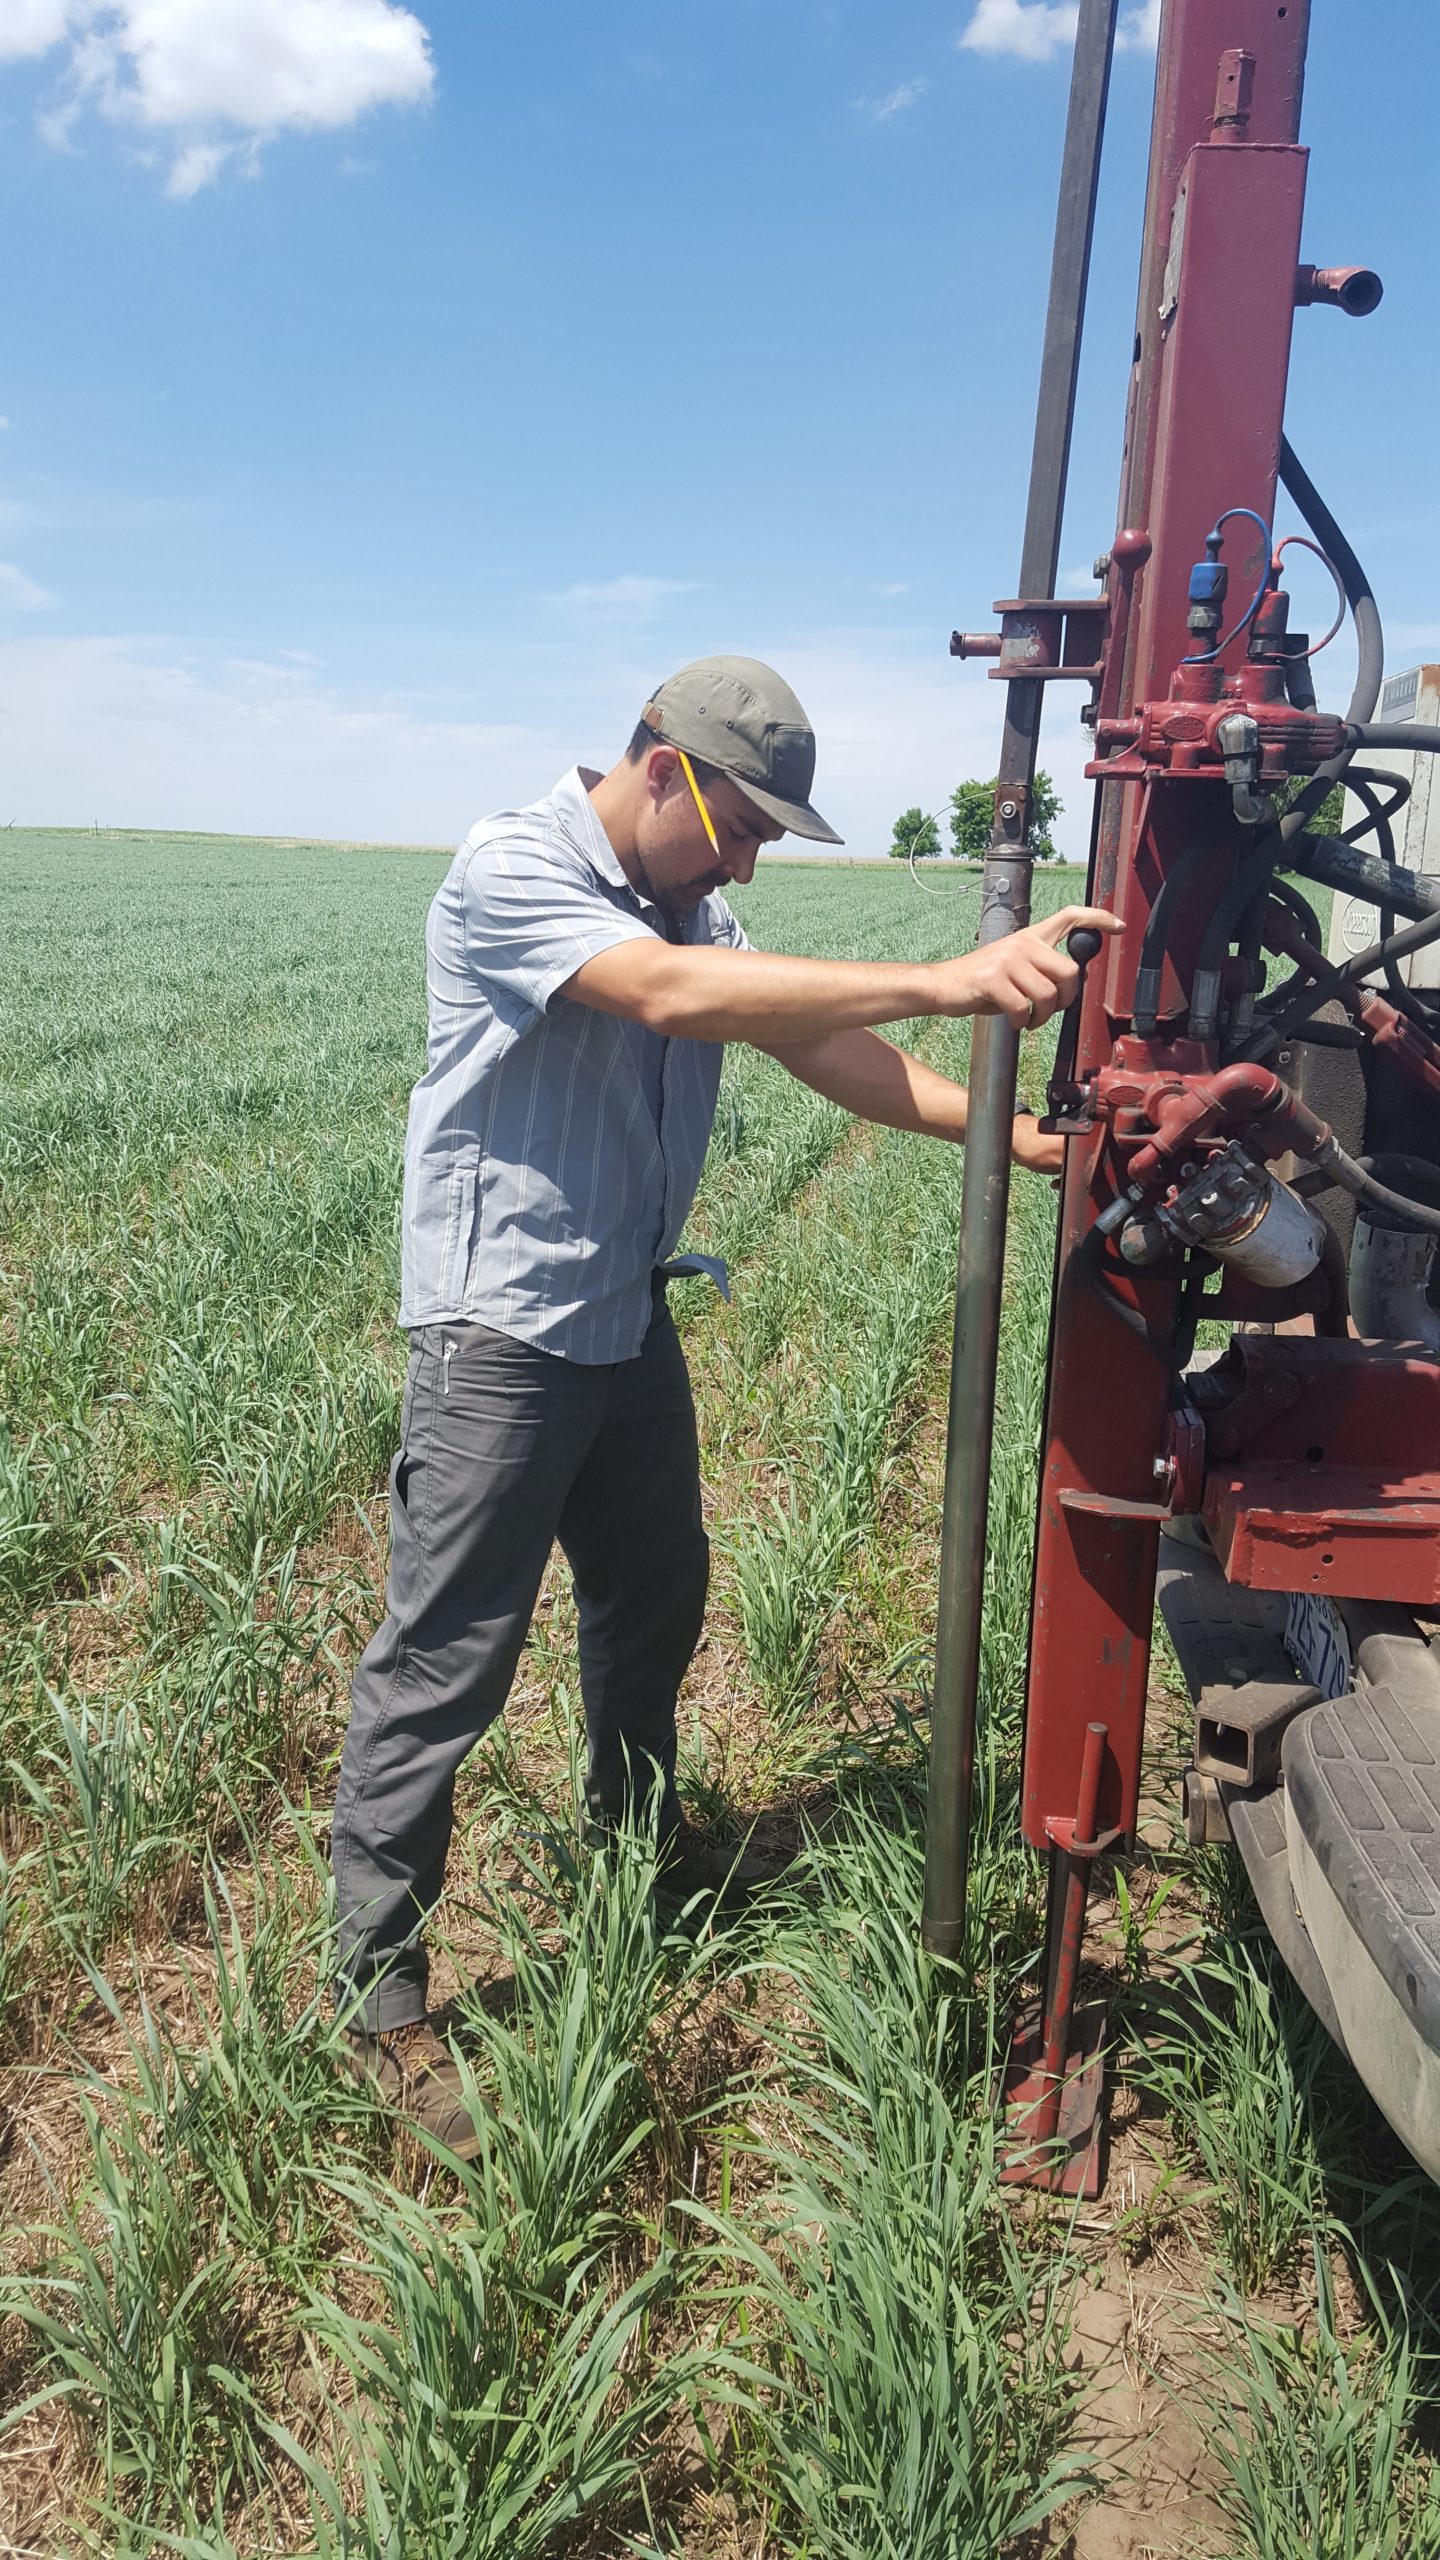
Finally, Jennifer had to measure how the microbes were doing in each treatment. She did this by measuring their enzyme activity. Enzyme activity is a measure of how active the microbes are. The higher the enzyme activity, the happier the microbes are. To measure this, Jennifer collected soil samples from each plot throughout the growing season and took them to the lab to measure enzyme levels in the soil samples. These enzymes are made by microbes when they are active. She then calculated the mean of all her samples for each treatment combination.

Jennifer predicted two things. First, if drought is harmful to microbes, then she would expect to see lower enzyme activity in the drought treatment compared to the irrigated treatment. Second, if adding carbon to the soil is a way to help microbes overcome the challenge of drought, she expected higher enzyme activity in the plots with plant litter added compared to the control treatment. Both of these taken together would indicate that drought is stressful for microbes, but we can help them out by adding resources like plant litter to soils.

Featured scientist: Jennifer Jones (she/her) from the Kellogg Biological Station Long Term Ecological Research Site. Written with Melissa Frost and Liz Schultheis.

Flesch–Kincaid Reading Grade Level = 8.2

Additional teacher resources related to this Data Nugget:

To introduce this Data Nuggets activity, students can watch a talk by Jennifer when she made a classroom visit to share her background and research interests. This video is a great way to introduce students to scientist role models and learn more about what a career in science looks like, as well as get an introduction to the themes in the research.

There is also a video of Jennifer and her scientist colleague, Grant Falvo, out in the field talking about their research under the rainout shelters.

For more information about the rainout shelter experiment, students can watch this short video featuring Jennifer Jones and another scientist on the team, Grant Falvo:

These data are part of the Kellogg Biological Station Long Term Ecological Research Program (KBS LTER). To learn more about the KBS LTER, visit their website.

Do you feel the urban heat?

Attaching a heat sensor to a street sign in Miami to monitor urban temperatures.

The activities are as follows:

Record-breaking temperatures climb higher every year, and Florida is no exception. In Florida, the impact of climate change is felt mostly during the hurricane season. Storms are becoming more violent and show up earlier in the season. These extreme temperatures and weather events affect living organisms of all types, including humans. Outdoor workers, the elderly, and all people who lack adequate housing are susceptible to temperature changes in the environment.

Heat sensor ready to be put out into the city.

Irvin teaches science at a high school in Miami, Florida. On his way to work, he listens to a local radio station to catch up on the news. One day the radio hosts were talking about an increase in homelessness in Miami and other cities. They also brought up the record heat that the U.S. was experiencing and how this may affect those without homes. This conversation on the radio made Irvin think. He reflected on the impact that such high heat could have on individuals who sleep without air conditioning.

This inspired Irvin to learn more about what could be done to mitigate the impact of climate change in his city. Irvin joined a program that invites teachers to work in scientists’ labs in the summer to gain research experience. Irvin was matched with Tiffany, a scientist interested in how urban heat can change based on structures like concrete buildings, urban dwellings, and unshaded places. Irvin took this opportunity to explore how high temperatures in Miami affect the daily lives of people living there. First, Irvin started looking into how temperatures are reported in Miami. He learned that there was just a single sensor stationed at the nearby airport. The heat and humidity readings from this one sensor are used by local officials to alert the entire city about dangerous heat levels. Alerts are issued when the heat index reaches 108 degrees Fahrenheit or higher. Heat index is a value that represents how the body feels temperature when humidity is factored in. With these alerts, people can take action by spending less time outside.

Teachers visiting the mangroves in Miami on a record heat day.

Irvin realized that no matter how reliable the sensor at the airport is, there is likely a larger range of temperatures within the city. He wanted to know whether the temperatures at the airport were similar to the heat felt at places where people spend time outside.

Tiffany’s research team had already started to collect temperature data in urban places where they hadn’t been recorded before. Since 2018, her lab placed hundreds of small heat sensors around the city. The sensors go out for 3 months and then the team collects them, records their data, and places them back out into new areas of the city.

Irvin wanted to compare areas that varied in coverage from the sun. He focused on sites where people gathered and spent long periods of time outside – bus stops. Some of the sites he chose had shade from trees, some had a roof providing partial sun cover, and other sites were totally exposed with no shade. Irvin took photos of each bus stop and used them to classify all sites as either full coverage, partial coverage, or no coverage. He used data from the airport as a control comparison to his bus stop sites.

Featured scientists: Irvin E. Arce (he/him) and Tiffany Troxler (she/her) from Florida International University

Flesch–Kincaid Reading Grade Level = 9.6

Little butterflies on the prairie

Butterfly on prairie flower.
A Tiger Swallowtail butterfly visiting a prairie flower to drink nectar.

The activities are as follows:

Butterflies are insects with colorful wings. You will often see them in a field, flying from flower to flower. Butterflies eat a sugary food made by flowers, called nectar. In return, the butterflies help the plants make seeds by moving pollen. As they travel from flower to flower, pollen is dropped off. This helps plants reproduce and make seeds. This is called pollination, and butterflies are pollinators. We need pollinators to grow many of the fruits and vegetables that we eat!

Prairies are habitats filled with many types of flowers. The Midwestern United States used to be covered in prairies. Today, most have been replaced by farm fields. Crops like corn and soybeans are commonly planted in the Midwest. Farm fields are important because we need land to grow our food. But this also means there is less food and habitat for butterflies.

Many farmers are concerned with growing our food while still protecting habitat for butterflies and other species. They want to know – how can we grow food for ourselves while still growing flowers for butterflies? A group of scientists in Michigan is working with farmers to think of solutions. The team is made of people from many different backgrounds and work experiences. The members of the team change over time, but typically 8 scientists are working together at a time. They all come together to brainstorm and do their research at the Kellogg Biological Station in Michigan.

Group of researchers ready to go out into field to butterfly survey.
Members of the Haddad Lab, ready to go out for a day of butterfly sampling in the prairie strips!

Prairie strips are a new idea that might help both farmers and the environment. These strips are small areas of prairie that can be added to farm fields. They look like rows of flowers and grasses within a field. They create habitat for many species, like butterflies, birds, ants, and even microscopic fungi and bacteria! Prairie strips may also help our food grow better by providing habitat for pollinators.

To figure out if prairie strips are able to draw in butterflies, the research team needed to collect data. They visited a large experiment that had many different kinds of farm fields. Some of the fields had prairie strips, while others did not. They thought prairie strips would help butterflies by adding habitat for them in farm fields that usually don’t have many flowers. They predicted they would see more butterflies in fields that have prairie strips and fewer in fields without these strips.

To count the butterflies in each type of field, the team went out on sunny spring and summer mornings when butterflies were flying around and eating nectar. They walked along the same paths in the same fields at the same time every week. Each time, they counted all the butterflies they saw within 5 meters. Each walk was 12 minutes long and followed a 150-meter path. They did these counts in 6 farm fields without prairie strips and 6 farm fields with prairie strips. The team counted butterflies like this 20 times over the summer. At the end of the summer, they added up all of the butterflies observed in each field. This number is called butterfly abundance.

Featured scientists: The Haddad Lab from Kellogg Biological Station Long Term Ecological Research Program – KBS LTER

Flesch–Kincaid Reading Grade Level = 7.3

Sink or source? How grazing geese impact the carbon cycle

Tricia (left) installing carbon dioxide plots in the field.

The activities are as follows:

“If it wasn’t for the geese, you and I would not be here today because our ancestors would not have made it. When long, hard winters emptied people’s food caches early, starvation loomed. Return of geese in April saved us.” – Chuck Hunt, born and raised on the Yukon-Kuskokwim Delta

Spring geese are an essential food source for subsistence communities like Chevak, Alaska. Elders in western Alaska Native communities have observed a decrease in geese returning to their villages over time. These changes affect the local communities and could also affect the local ecosystem.

One way geese change their environment is by eating grass. In the Yukon-Kuskokwim Delta in western Alaska, birds from every continent on Earth migrate to this sub-Arctic habitat to lay their eggs and raise their young. Once they arrive, geese eat a ton of grass. They graze only in specific areas, called grazing lawns, leaving the rest of the vegetation alone.

When geese graze on wetland plants, they remove plant matter, potentially decreasing the amount of carbon dioxide, or CO2, that is absorbed during photosynthesis. As plants photosynthesize, they take CO2 from the atmosphere and turn it into glucose (a sugar) and oxygen. Gross primary production is the total amount of energy that plants capture from sunlight to grow and live before they use up some of that energy for themselves. Plants can slow climate change by removing CO2 from the atmosphere and turning it into plant matter, like leaves and roots.

A scientist mimics geese grazing by clipping the grass.

Trisha is a scientist who became interested in ways that animals can affect the carbon cycle through their interactions with the environment. She wondered whether fewer geese returning to western Alaska could have global consequences that extend beyond remote communities. She thought that if geese ate enough grass, they may limit photosynthesis. This is important because it could change whether this ecosystem is a carbon sink or a carbon source. An ecosystem is called a carbon sink if it absorbs more CO2 through photosynthesis than it releases through respiration. Alternatively, an ecosystem can be a carbon source if more CO2 is released than absorbed. We want ecosystems to be carbon sinks because then they keep CO2 out of the atmosphere, where it contributes to global warming.

To test her idea, Trisha teamed up with fellow scientists Bonnie, Karen, and Jaron to take a closer look at how grazing grass influences whether the Y-K Delta ecosystem is releasing or absorbing CO2. To do their experiment they had to get creative. They considered getting a lot of geese, bringing them to an ungrazed area, and letting them chow down. However, it’s hard to capture geese and get them to graze exactly where you want. So instead, the research team simulated the effects of geese by cutting the grass to mimic nibbling and then gently vacuuming the pieces of grass to remove them.

The “Carbon and Geese” scientist team.

The team set up six different experimental areas. Inside each area were two plots: one that was left ungrazed, and the other which was artificially grazed. The research team then used a piece of equipment called a LI-COR to measure the quantity of CO2 in the air above each plot. They recorded the CO2 levels during the day and night. The comparison from day to night is one way to look at gross primary production and respiration in a system. At night, when there is no light, plants can’t photosynthesize, so the detected CO2 will be from respiration. The levels during the day represent a combination of CO2 absorption by plants and release from respiration.

To assess whether the ecosystem is a carbon sink or source, we need to determine the difference between respiration and gross primary production, or net ecosystem exchange (NEE). A negative NEE means the ecosystem absorbs more CO2 than it emits. A positive NEE means the ecosystem is releasing more CO2 than it is absorbing. In this way, scientists classify an ecosystem as either a carbon sink that is storing carbon or a carbon source that is releasing carbon into the atmosphere.

Featured scientists: Trisha Atwood, Karen Beard, and Jaron Adkins from Utah State University and Bonnie Waring from Imperial College. Written by Andrea Pokrzywinski.

Flesch–Kincaid Reading Grade Level: 8.9

Additional teacher resources related to this Data Nugget:

Check out this website created by teacher Andrea who participated in the research and wrote this Data Nugget. You will find additional lesson plans, videos, slides, and articles to use in the classroom!

Helping students hear the stories that data tell

Article Highlights

High school students work with a Data Nuggets module.
High school students work with a Data Nuggets module. Credit: Paul Strode
  • Michigan State University’s Data Nuggets program is starting its third round of funding from the National Science Foundation to improve data literacy in K-16 students.
  • The program, operated by the Kellogg Biological Station, also introduces real STEM professionals through storytelling, helping students better relate to their projects and engage more deeply with the program’s content.
  • In collaboration with Auburn University, the newest NSF grant will help Data Nuggets further that engagement and introduce students to a greater diversity of scientists.

A data literacy program that’s also changing students’ relationships with science and scientists is entering its third round of funding with a new $1.5 million grant from the National Science Foundation.

In collaboration with Auburn University, the Data Nuggets program at the W.K. Kellogg Biological Station, or KBS, will work to identify factors that improve equity and success in undergraduate STEM education.

Launched by Michigan State University in 2011, Data Nuggets is a curriculum development project designed to help students better understand and use data. The program shows how professionals in science, technology, engineering and math really work with data by sharing their stories, which also enables students to relate on a much more personal level.  

Data Nuggets challenges students from kindergarten through undergraduate levels to answer scientific questions using data to support their claims. The questions and data originate from real research provided by scientists whose studies range from physics to ecology to animal behavior. 

To add the personal element, Data Nuggets is collaborating with Project Biodiversify — another education program started at MSU — to add the scientists’ bios, which include information like hobbies and their lives outside of science. This helps students relate to the researchers and see them less as strangers in lab coats and more as scientific role models. 

“We’ve found that it’s the scientists that are engaging students in the activities,” said Elizabeth Schultheis, co-leader of the Data Nuggets program. “If they connect to the role model, then you can get students to do the data literacy activities because they know, ‘Oh, this is a real person. I relate to this person. And I’m working with authentic, real data. I’m not just doing busy work.’” 

Schultheis, who earned her doctorate in plant biology from MSU, is also the education and outreach coordinator for the Long-Term Ecological Research, or LTER, program at KBS, which supports Data Nuggets. Schultheis and co-leader, Melissa Kjelvik, developed and run the program, forming partnerships to research and fund the program.

“With our current research, we’re trying to figure out what is the special thing that’s really resonating with students in terms of the role models,” Kjelvik said.

“Our research will investigate how and why role models are critically important for students,” said Cissy Ballen. Ballen is an associate professor in the Department of Biological Sciences at Auburn, the lead institution on the NSF grant, which builds on the past success of Data Nuggets and will help ensure its future impact.

“The theory behind this is that students must be able to see a scientist’s success as attainable to relate to that scientist,” Ballen said. “My prediction is that students will find success most relatable when they see some scientists, like them, have struggled with science, but then were able to overcome that struggle.” 

Elizabeth Schultheis (right) and Melissa Kjelvik (left) lead the Data Nuggets program at Michigan State University’s W.K. Kellogg Biological Station.

Making data talk

Many students’ eyes gloss over when they hear terms like “data” or “science.” 

Even Schultheis admits she didn’t appreciate the significance of data until she was a grad student collecting her own. The problem, she said, is that kids are often taught how to make a graph, for example, but not why.

“I never really learned to care until I understood the reason I make a graph is because I want to answer a question,” Schultheis explained. “I need to see the data, what it looks like. And that’s why I make a graph.” 

Data Nuggets doesn’t change the skills that are taught in conventional curricula. Students still learn how to make and label axes, for example, and then how to plot data to create graphs. But they also get a more immersive introduction into why real people use these skills.

“Our purpose with these Data Nuggets modules is that everything is always given real context and always in service of a scientific question,” Schultheis said. “It’s always: Here’s a scientist. Here’s the question that they really care about and the reason they collected this data is because they want to answer this question. And you make the graph to visualize it so that you can see what the data is telling you.”

Data Nugget activities come in four levels, so instructors can use the ones best suited for their specific classes. Level 4 activities are designed for high schoolers and undergraduates, while level 1 activities are appropriate for elementary schools and higher grades looking for a refresher after a summer break, for example.

Teachers also have flexibility with how to present an activity based on their goals. For example, instructors can choose activities with completed graphs so students can focus on interpreting what they see to answer questions.

Or students can be given blank grids to give them experience in creating useful representations of data from scratch.

Connie High, a science teacher at Delton Kellogg High School about five miles from KBS, calls Data Nuggets “a game changer.”  

She said that her students, when they’re new to Data Nuggets, can usually make claims and find supporting evidence. The challenge is learning how to articulate the connection between the two.

“They really struggle with how to link claim, evidence and reasoning. They tend to just restate the evidence again,” High said. 

“With Data Nuggets, we definitely see an improvement from the beginning of the year to the end.” 

Humanizing data 

The Data Nuggets program started 13 years ago as a grassroots collaboration between KBS researchers — including Schultheis and Kjelvik, who were then grad students at KBS — and K-12 teachers, including High. 

More than 120 scientists have contributed more than 120 data literacy activities since then. Tens of thousands of people regularly use the Data Nuggets website. Links to various Data Nuggets stories can even be found in science textbooks. 

“Long-term relationship building is why we got such good insights from teachers about what their students needed, because they already had trust with us, and we went into their classrooms and learned from them,” Schultheis said. “And building relationships with scientists who trust us to tell their stories correctly, who are giving their own stories for students to read and learn about, continues to be critical to our success.”

But exactly how to best package and present the data stories falls to Schultheis and her colleagues. Previous research has supported the idea that focusing on the scientist and why they collected the data is essential. After all, data is just numbers. It’s human interaction that puts numbers in perspective, gives the scientific question context and engages students in the activity.

“Humanizing the data is at the crux of this work,” Ballen said. “Data Nuggets is such a successful resource because of the way they humanize the data component and contextualize it within the science itself and show that it’s being done by relatable scientists. They do that really well.”

With its third round of NSF funding, Data Nuggets is attempting to fine-tune how to best present the scientist role models and the stories to improve student engagement with science even more.

The goal is not only to increase the portrayal of under-represented groups among scientist contributors, but also for students to see that they share some things in common with the scientists they see. 

“We used to ask students to draw what a scientist looks like, and they all would draw someone who looks like Albert Einstein,” High said. “It’s incredibly important that they see there are scientists who look like them.”

“You can imagine if you were a student sitting in a classroom you might get an activity that features a scientist from a prestigious university with awards and that sort of thing, and that might not be very relatable,” Ballen said. “Success might not be perceived as attainable.”

Data Nuggets is working to combat that perception.

For example, there’s a Data Nugget called “Trees and the City”, featuring a photo of a smiling University of Minnesota ecologist named Adrienne Keller wearing a bike helmet and sunglasses. A video shows Keller riding her bike through neighborhoods in the Twin Cities as she describes her interest in tree patterns. She poses her dataset’s main question: “Are there differences in the total canopy cover or the number of tree species planted in a neighborhood based on residents’ income level or percentage of BIPOC — Black, Indigenous, and People of Color — residents?”

Another Data Nugget was written by a community scientist from Bayfield, Wisconsin, located on the south shore of Lake Superior. He’s pictured wearing shorts and gym shoes as he stands on ice. 

For his Nugget, he used historical data to answer his question if the winters were getting shorter and changing the dynamics of how people could travel in the area. 

He also happened to be a high school student.

“That’s the dream outcome,” Schultheis said, “that students realize how powerful data are, and they can be advocates for themselves and their communities because they can actually go to the source of information and ask and answer questions.” 


This story was written by Lynn Waldsmith, and was originally posted on the Michigan State University, College of Natural Science website here.

Which tundra plants will win the climate change race?

Some arctic Tundra plant species monitored in this experiment.
Arctic tundra plant species monitored in this experiment.

The activities are as follows:

The Arctic, the northernmost region of our planet, is home to a unique biome known as tundra. While you might think of the arctic tundra as a blanket of snow and polar bears, this vast landscape supports a diversity of unique plant and animal species. The tundra is an area without trees that supports many species of plants, mammals, birds, insects, and microbes. 

Arctic environments present many challenges to plants. Temperatures only creep above freezing for about three months each year. This short arctic summer means that the species that live there only have a brief period to grow and reproduce. From mid-May to the end of July the sun doesn’t set, so there’s plenty of light available. Plants need this light for photosynthesis to make sugars for food. 

Even when there is light, plants need to wait until the snow has melted and the soil has thawed enough for them to grow. Tundra plants have short roots since they can’t grow through frozen ground. These roots try to get nutrients the plant needs from the soil. But with the soil so cold, decomposition is very slow. This means that microbes cannot easily convert dead plant material into nutrients that plants need such as nitrogen and phosphorus. For this reason, the growth of tundra plants is usually limited by nutrients.

Climate change is altering the arctic environment. With warmer seasons and fewer days with snow covering the ground, soils are thawing more deeply and becoming more nutrient-rich. With more nutrients available, some plant species may be able to outcompete other species by growing taller and making more leaves than other plant species. This means that climate change may alter the whole ecosystem game in the tundra. Instead of nutrients limiting plant growth, it may shift to a game of competition between plants reaching for light.

Gus (left) and Jim (right) set up a weather station to monitor air temperature and humidity on the tundra.

To simulate the environmental conditions, we can look at long-term data from two scientists, Gus and Terry, who started working at the Toolik Field Station in northern Alaska in the 1970s. They conducted a series of experiments and learned that two nutrients, nitrogen and phosphorus, limited plant growth in the tundra. Then, in 1981, they set up a new experiment where they added both nutrients to experimental plots every year. Gus and Terry compared plant growth between these fertilized plots and control plots that were not fertilized. They wanted to figure out how each plant species would respond to more nutrients over the long term and what would happen to the plant community to see if some species would outcompete others in the fertilized conditions. This experiment is one way to mimic future conditions and test hypotheses about what we might expect to see.

The fertilizer was added every year in early June after the snow melted off the plots. Beginning in 1983, other scientists, such as Laura and Ruby, began to sample these plots. They dug out small 20-centimeter by 20-centimeter samples of tundra and brought them back to the nearby Toolik Field Station. In the lab, the tundra sample was separated into individual plant species and “plucked” to sort by different plant tissue types: leaves, stems, and roots. Then these plants were dried and weighed to determine the biomass (mass of living tissue) of each species in the sample. The fertilized and non-fertilized plots were sampled and plucked six times between 1983 and 2015. This means that many of the scientists who sampled the plots in 2015 had not yet been born when the experiment started in 1981!

Featured scientists: Gus Shaver (he/him), Jim Laundre (he/him), Laura Gough (she/her), and Ruby An (she/her) from Toolik Field Station, Arctic Long-term Ecological Research Site

Flesch–Kincaid Reading Grade Level = 8.6

Additional teacher resources related to this Data Nugget:

A difficult drought

A field of switchgrass studied by biofuels researchers.

The activities are as follows:

Most people use fossil fuels like natural gas, coal, and oil daily. We use them to generate much of the energy that gets us from place to place, power our homes, and more. Fossil fuels are very efficient at producing energy, but they also come with negative consequences. For example, when burned, they release greenhouse gases like carbon dioxide into our atmosphere. The right balance of greenhouse gasses is needed to keep our planet warm enough to live on. However, because we have burned so many fossil fuels, the earth has gotten too hot too fast, resulting in climate change. Scientists are looking for other ways to fuel our lives with less damage to our environment.

Substituting fossil fuels with biofuels is one of these options. Biofuels are fuels made from plants. Unlike fossil fuels, which take millions of years to form, biofuels are renewable. They are made from plants grown and harvested every few years. Using biofuels instead of fossil fuels can be better for our environment because they do not release ancient carbon like burning fossil fuels does. In addition, the plants made into biofuels take in carbon dioxide from the atmosphere as they grow.

To become biofuels, plants need to go through a series of chemical and physical processes. The sugar stored in plant cells must undergo fermentation. In this process, microorganisms, like yeast, transform the sugars into ethanol that can be used for fuels. Trey is a scientist at the Great Lakes Bioenergy Center. He is interested in seeing how yeast’s ability to transform sugar into fuel is affected by environmental conditions in fields, such as temperature and rainfall.

When there was a major drought in 2012, Trey used the opportunity to study the impacts of drought. The growing season had very high temperatures and very low rainfall. These conditions make it more difficult for plants to grow, including switchgrass, a prairie grass being studied as a potential biofuel source.

Trey knew that drought affects the amount and quality of switchgrass that can be harvested. He wanted to find out if drought also had effects on the ability of yeast to transform the plants’ sugars into ethanol. Stress from droughts is known to cause a build-up of compounds in plant cells that help them survive during drought. Trey thought that these extra compounds might harm the yeast or make it difficult for the yeast to break down the sugars during the fermentation process. Trey and his team predicted that if they fed yeast a sample of switchgrass grown during the 2012 drought, the yeast would struggle to ferment its sugars and produce fewer biofuels as a result.  

To test their idea, the team studied two different sets of switchgrass samples that were grown and collected in Wisconsin. One set of switchgrass was grown in 2010 under normal conditions. The other set was grown during the 2012 drought. The team introduced the two samples to yeast in a controlled setting and performed four fermentation tests for each set of switchgrass. They recorded the amount of ethanol produced during each test.

Featured scientists: Trey Sato from the University of Wisconsin-Madison. Written by Marina Kerekes.

Flesch–Kincaid Reading Grade Level = 8.2

Additional teacher resources related to this Data Nugget include:

There are other Data Nuggets that share biofuels research. Search this table for “GLBRC” to find more! Some of the popular activities include:

The Great Lakes Bioenergy Research Center (GLBRC) has many biofuel-related resources available to K16 educators on their webpage.

For activities related specifically to this Data Nugget, see:

Size matters – and so does how you carry it!

The activities are as follows:

Stalk-eyed fly copulation.

In the wild, animals compete for limited resources. Things like food, water, shelter, and even reproductive mates can be hard to come by. Animals with traits and behaviors that make them more likely to survive and reproduce are said to have higher evolutionary fitness. Some animals have evolved special traits that advertise their fitness to potential mates. Male deer, elk, and moose have large antlers that they use to compete with other males, which demonstrates their fitness to females. Another interesting example is the stalk-eyed flies, in which the males grow long eye stalks to attract a mate. In these cases, females are more likely to choose males with the biggest traits.

Scientists have long predicted that these traits come with both benefits and costs. Large antlers or eyestalks may help a mate notice you, but also come with some costs. Extra weight takes more energy to move around and could make it more difficult to escape from predators. And yet, many studies have failed to find any measurable costs to males having these seemingly impractical traits.

This scientific mystery puzzled Jerry and John, who study stalk-eyed flies. They had failed to identify and document any costs to having longer eyestalks, measured as the distance between the eyes, or eyespan. Common sense told them that having longer eye stalks should make flying more awkward for these flies. However, their data did not support this hypothesis. “When I started collecting data, I focused a lot on the performance costs and got kind of fixated on that,” John says of the team’s initial research. “It was frustrating when we couldn’t identify any actual decline in performance.”

John in the field when he first started his research – many decades ago!

The team began looking for an alternative explanation. They read about research supporting a new idea in a completely different kind of flying animal – barn swallows. Male barn swallows have long, ornate tails. These tails make male barn swallows less aerodynamic during flight. But males have also evolved to have larger wings relative to their body size. This could help them compensate for the extra burden associated with their long tails.

Jerry and John wondered if a similar thing might be at work in stalk-eyed fly wings. Perhaps the male stalk-eyed flies, like male barn swallows, had evolved to have larger wings relative to their body size to help them compensate for long eye stalks when flying. If this were the case, then they expected to see a positive correlation between wing size and eyespan. Could this be why they were unable to measure any disadvantage associated with having longer, more awkward eye stalks? In other words, male stalk-eyed flies with larger wings would be able to support longer eye stalks.

Eyespan (horizontal arrow) and body size (vertical arrow) of a stalk-eyed fly.

Jerry, John, and their team decided to test their new hypothesis by raising stalk-eyed flies in the lab to maturity, then collecting data about their body length, eyespan, and wing area.

To account for natural variation in body size among stalk-eyed flies, the team needed to use “relative” measurements based on body size. With these kinds of measurements, a value of zero (0) means that wing size or eyespan is exactly what you would predict for a fly of that body size. Negative values mean that wing size or eyespan are smaller than you would predict for that body size, while positive values mean that wing size or eyespan is greater than you would predict for that body size. For example, if a fly has a relative eyespan of -0.010, then the distance between the eyestalks was 0.010 millimeters shorter than expected based on its body size.

Featured scientists: Jerry Husak from the University of St. Thomas and John Swallow from the University of Colorado-Denver. Written by: Sam Holloway

Flesch–Kincaid Reading Grade Level = 8.8

Additional teacher resources related to this Data Nugget include:

You can find lessons to accompany many of John’s studies with insects on the Data Nuggets website! Check out the following Data Nugget activities!

A peer-reviewed journal article: Husak, J. F., Ribak, G., Wilkinson, G. S., & Swallow, J. G. 2011. Compensation for exaggerated eye stalks in stalk‐eyed flies (Diopsidae). Functional Ecology, 25(3), 608-616.

A video of a stalk-eyed fly in flight:

Trees and the city

A neighborhood with many tree species and a lot of tree cover.

The activities are as follows:

We often imagine nature as being a place outside of cities. But within our cities, we are surrounded by nature – in fact, most human interactions with nature happen within urban areas. Picturing a tree, we might imagine it in a remote forest, yet many trees are planted by residents and local governments within cities. Trees provide important benefits, such as beauty and shade. The number and types of tree species that are planted in a neighborhood can increase the benefits received from trees in urban areas.

When Adrienne first moved to the Twin Cities in Minnesota, she started exploring Minneapolis and St. Paul by bike. Biking is done at a slow enough pace that she can travel long distances but still make observations about neighborhoods in these cities. As an ecologist, she naturally found herself looking for patterns in trees. For example, she noticed some older neighborhoods in St. Paul have a lot of large trees that provide plenty of shade and tree cover. In other neighborhoods, Adrienne saw fewer types of trees and noticed that she spent less time shaded by branches and leaves.

Adrienne biking around Minneapolis-St. Paul.

Adrienne started conversations with her colleagues about their observations of differences in urban landscapes. They discussed the ways in which laws, policies, and practices (“the way things are done”) give advantages to certain groups of people over others. These advantages are woven into our cultural systems.

Adrienne and her fellow researchers expected that neighborhoods with wealthier and more white residents would have benefited from a long history of greater investment.

Therefore, these neighborhoods were expected to have greater tree cover from the large old trees that have been growing there for many years. They also expected these neighborhoods would have more types of trees. In contrast, the researchers expected that less wealthy neighborhoods and those with a greater percentage of Black, Indigenous, and other People of Color (BIPOC) would have less tree cover and fewer types of trees because of chronic lower investment in these neighborhoods.

To research these ideas, Adrienne and her colleagues combined three different sources of publicly available data:

  • U.S. Census data, used to estimate % BIPOC and average median household income per ‘Block Group’ (similar to a neighborhood).
  • Satellite images, which are often used to estimate % tree cover, measure the percent of land area covered by the tree canopy. Adrienne looked at tree cover in the Block Group areas used in the Census.
  • City data that include the location and species for each tree planted along public streets to calculate tree species richness in each Block Group. Tree species richness is the number of different tree species in an area and is a measure of tree biodiversity used by many ecologists.

Featured scientists: Adrienne Keller (she/her) from the University of Minnesota

The data in this activity are from the MSP Long-term Ecological Research Site. The focus of the research at this site is centered on ecological interactions in urban environments. You can learn more here.

Flesch–Kincaid Reading Grade Level = 9.4

Additional teacher resources related to this Data Nugget include:

  • You can have students read more about environmental justice research from the MSP LTER in this peer-reviewed article (email us at datanuggetsk16@gmail.com if you need a downloadable version):
    • Rebecca H. Walker, Hannah Ramer, Kate D. Derickson & Bonnie L. Keeler (2023) Making the City of Lakes: Whiteness, Nature, and Urban Development in Minneapolis. Annals of the American Association of Geographers, DOI: 10.1080/24694452.2022.2155606
  • This short video features Adrienne as she describes the motivation and process behind her research study.

Collaborative cropping: Can plants help each other grow?

The activities are as follows:

Alfalfa (middle) planted in a Kernza® field.

Most of the crops grown on farms in the United States are annual plants, like corn, soybeans, and wheat. Annual plants die every year after harvest and must be replanted the following year. Preparing farm fields for replanting every year can erode soils and hurt important bacteria and fungi living in the soil.

One way to change how we produce food is to grow more perennial crops. Perennial plants live for many years and don’t need to be replanted. Perennials stay in the ground all year and start growing right away in the spring before annual crops are even planted. This early growth also gives perennial crops a “head-start” in competing with annual weed species that emerge later in the season.

While there are potential benefits of perennial crops, they are not commonly planted because they tend to make lower profits for farmers than annual crops. Crop scientists are still examining potential options to make perennial crops work at a large scale for farmers. For twenty years, researchers at The Land Institute in Kansas and at the University of Minnesota have been looking at a new perennial grain, called Kernza®, that could be used as an alternative to wheat and rye annual crops. Kernza® comes from the seeds of a plant called intermediate wheatgrass. Because Kernza® is such a new crop, scientists still have a lot to learn about it. Before it can be widely used by farmers, they want to know what field conditions help the plants grow to ensure the crop makes money for farmers.

Dr. Jake Jungers taking a soil core in a Kernza® field.

One strategy to improve field conditions for perennial crops is to plant legumes in the field alongside them. Legumes can make nitrogen, a nutrient that plants need to grow, more available to the plants around them. Additionally, farmers can select legume species that typically don’t compete with the crop but may outcompete weeds.

Jake is an ecologist who uses his knowledge about plants to make agriculture more sustainable. Jake wanted to do some research into alfalfa, a type of perennial legume that might work well with Kernza®. Jake thought that growing alfalfa alongside Kernza® would lead to increased profit and yield for two reasons. One, because it would add nitrogen to the soil to boost crop growth. Two, because alfalfa would compete with agricultural weed species, making valuable resources available for the crop plants.

To test this idea, Jake set up an experiment with his team. Alfalfa was grown with Kernza® at three different locations in Minnesota in 2019. The study was replicated four times at each site, with the same amount of alfalfa and Kernza® planted into each field. At the end of the growing season, the fields were harvested, and the plants were sorted into three categories: Kernza®, alfalfa, and weed species. He further sorted Kernza® by grain, which can be used for food, and straw, which can be used for animal feed. Jake wanted to compare yield, or plant growth per unit area, across the plant categories. To do this, he weighed all the plants in each category to get the biomass and then divided by the area of the field.

Featured scientist: Jake Jungers (he/him) from the University of Minnesota

Written by Claire Wineman (she/her)

Flesch–Kincaid Reading Grade Level = 8.5