Bringing back the Trumpeter Swan

Joe with a Trumpeter Swan.

The activities are as follows:

The Kellogg Bird Sanctuary was created in 1927 to provide safe nesting areas for waterfowl such as ducks, geese, and swans. During that time many waterfowl species were in trouble due to overhunting and the loss of wetland habitats. One species whose populations had declined a lot was the Trumpeter Swan. Trumpeter swans are the biggest native waterfowl species in North America. At one time they were found across North America, but by 1935 there were only 69 known individuals in the continental U.S.! The swans were no longer found in Michigan.

The reintroduction, or release of a species into an area where they no longer occur, is an important tool in helping them recover. In the 1980s, many biologists came together to create a Trumpeter Swan reintroduction plan. Trumpeter Swans in North America can be broken up into three populations – Pacific Coast, Rocky Mountain, and Interior. The Interior is further broken down into Mississippi/Atlantic and High Plains subpopulations. Joe, the Kellogg Bird Sanctuary manager and chief biologist, wrote and carried out a reintroduction plan for Michigan. Michigan is part of the Mississippi/Atlantic subpopulation. Joe and a team of biologists flew to Alaska in 1989 to collect swan eggs to be reared at the sanctuary. After two years the swans were released throughout Michigan.

The North American Trumpeter Swan survey has been conducted approximately every 5 years since 1968 as a way to estimate the number of swans throughout their breeding range. The survey is conducted in late summer when young swans can’t yet fly but are large enough to count. Although the surveys are conducted across North America, the data provided focuses on just the Interior Population, which includes swans in the High Plains and Mississippi/Atlantic Flyways.

Featured scientist: Wilbur C. “Joe” Johnson from the W.K. Kellogg Bird SanctuaryWritten by: Lisa Vormwald and Susan Magnoli from Michigan State University.

Flesch–Kincaid Reading Grade Level = 11.5

Additional teacher resource related to this Data Nugget:

A video on Trumpeter Swan reintroduction efforts that could be shown before the Data Nugget to engage students with the topic, or after to expand the research beyond the one study:

SaveSave

SaveSave

SaveSave

SaveSave

SaveSave

The case of the collapsing soil

An area in the Florida Everglades where strange soil collapse has been observed.

The activities are as follows:

As winds blow through the large expanses of grass in the Florida Everglades, it looks like flowing water. This “river of grass” is home to a wide diversity of plants and animals, including both the American Alligator and the American Crocodile. The Everglades ecosystem is the largest sub-tropical wetland in North America. One third of Floridians rely on the Everglades for water. Unfortunately, this iconic wetland is threatened by rising sea levels caused by climate change. Sea level rise is caused by higher global temperatures leading to thermal expansion of water, land-ice melt, and changes in ocean currents.

With rising seas, one important feature of the Florida Everglades may change. There are currently large amounts of carbon stored in the wetland’s muddy soils. By holding carbon in the mud, coastal wetlands are able to help in the fight against climate change. However, under stressful conditions like being submersed in sea water, soil microbes increase respiration. During respiration, carbon stored in the soil is released as carbon dioxide (CO2), a greenhouse gas. As sea level rises, soil microbes are predicted to release stored carbon and contribute to the greenhouse effect, making climate change worse.

Shelby collecting soil samples from areas where the soil has collapsed in the Everglades.

Shelby and John are ecologists who work in southern Florida. John became fascinated with the Everglades during his first visit 10 years ago and has been studying this unique ecosystem ever since. Shelby is interested in learning how climate change will affect the environment, and the Everglades is a great place to start! They are both very concerned with protecting the Everglades and other wetlands. Recently when John, Shelby, and their fellow scientists were out working in the Everglades they noticed something very strange. It looked like areas of the wetland were collapsing! What could be the cause of this strange event?

John and Shelby thought it might have something to do loss of carbon due to sea level rise. They wanted to test whether the collapsing soils were the result of increased microbial respiration, leading to loss of carbon from the soil, due to stressful conditions from sea level rise. They set out to test two particular aspects of sea water that might be stressful to microbes – salt and phosphorus.

Phosphorus is found in sea water and is a nutrient essential for life. However, too much phosphorus can lead to over enriched soils and change the way that microbes use carbon. Sea water also contains salt, which can stress soil microbes and kill plants when there is too much. Previous research has shown that both salt and phosphorus exposure on their own increase respiration rates of soil microbes.

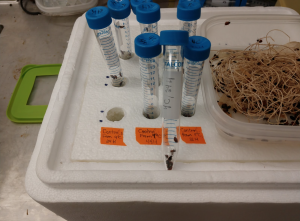
A photo of the experimental setup. Each container has a different level of salt and phosphorus concentration.

To test their hypotheses, a team of ecologists in John’s lab developed an experiment using soils from the Everglades. They collected soil from areas where the soil had collapsed and brought it into the lab. These soils had the microbes from the Everglades in them. Once in the lab, they put their soil and microbes into small vials and exposed them to 5 different concentrations of salt, and 5 different concentrations of phosphorus. The experiment crossed each level of the two treatments. This means they had soil in every possible combination of treatments – some with high salt and low phosphorus, some in low salt and high phosphorus, and so on. Their experiment ran for 5 weeks. At the end of the 5 weeks they measured the amount of COreleased from the soils.

Featured scientists: John Kominoski and Shelby Servais from Florida International University. Written by Shelby, John, and Teresa Casal.

Flesch–Kincaid Reading Grade Level = 9.2

SaveSave

SaveSave

SaveSave

SaveSave

SaveSave

SaveSave

SaveSave

SaveSave

SaveSave

SaveSave

What big teeth you have! Sexual selection in rhesus macaques

Cayo Santiago rhesus macaques. Photo by Raisa Hernández Pacheco.

The activities are as follows:

It is easy to identify a deer as male when you see his huge antlers, or a peacock as male by his stunning set of colorful tail feathers. But you may wonder, how do these traits come about, and why don’t both males and females have them? These extravagant traits are thought to be the result of sexual selection. This process happens when females mate with males that they think have the sexiest traits. These traits get passed on to future male offspring, leading to a change in the selected traits over time. Because females are only choosing these traits in males, sexual selection often leads to sexual dimorphism between males and females. This means that the sexes do not look the same. Often males will be larger and have more elaborate traits than females.

Craniums of an adult male (left) and an adult female (right) rhesus macaque. Photo by Raisa Hernández Pacheco and Damián A. Concepción Pérez.

One species that shows strong sexual dimorphism is rhesus macaques. In this species of monkey, males are much larger than females. Cayo Santiago is a small island off the shore of Puerto Rico. On this island lives one of the oldest free-ranging rhesus macaque colonies in the world. This population has no predators and food is plentiful. Scientists at Cayo Santiago have gathered data on these monkeys and their habitat for over 70 years. Every year when new monkeys are born they are captured, marked with a unique tattoo ID, and released. This program allows scientists to monitor individual monkeys over their entire lives and record the sex, date of birth, and date of death. Once a monkey dies and its body is recovered in the field, skeletal specimens are stored in a museum for further research.

Damián measuring canine length in a rhesus macaque skeletal specimen. Photo by Raisa Hernández Pacheco.

These skeletal specimens can be used by scientists today to ask new and exciting questions. Raisa and Damián are both interested in studying sexual dimorphism in rhesus macaques. They want to find out what causes the differences between the sexes. They chose to focus on the length of the very large canine teeth in male and female macaques. They expected that canine teeth may be under sexual selection in males for two reasons. First, rhesus macaques are mostly vegetarians, so they don’t need long canines for the same purpose as other meat-eating species that use them to catch prey. Second, male rhesus macaques often bare their teeth at other males when they are competing for mates. Females could see the long canines as a sign of good genes and may prefer to mate with that trait. Excited by these ideas, Raisa and Damián set out to investigate the museum’s skeletal specimens to check whether there is sexual dimorphism in canine length. This is the first step in collecting evidence to see whether male canines are under sexual selection by females.

They measured canine length of four male and four female rhesus skeletal specimens dating back to the 1970s. Measurements were only taken from individuals that died as adults to make sure canines were fully developed and that differences in length could not be attributed to age. Raisa and Damián predicted that males would have significantly longer canines compared to those of females. If so, this would be the first step to determine whether sexual selection was operating in the population.

Featured scientists: Raisa Hernández-Pacheco from University of Richmond and Damián A. Concepción Pérez from Wilder Middle School. Research conducted at the Laboratory of Primate Morphology at the University of Puerto Rico Medical Sciences Campus. Skeletal specimens came from the population of rhesus macaques on Cayo Santiago.

Flesch–Kincaid Reading Grade Level = 9.8

Damián and Raisa created a teaching module, called Unknown Bones. It is an inquiry-based educational activity for high school students in which they apply data analysis and statistics to understand sexual selection and illustrate sexual dimorphism in Cayo Santiago rhesus macaques.


About Raisa: I am interested in understanding the drivers shaping population dynamics, and have dedicated my studies to modeling the effects of biotic and abiotic factors on populations of invertebrates and vertebrates. In 2013, I obtained my PhD from the University of Puerto Rico after assessing the effects of mass bleaching on Caribbean coral populations. Right after, I joined the Caribbean Primate Research Center and the Max-Planck Odense Center to study the long-term dynamics of the Cayo Santiago rhesus macaque population. At the Grayson lab, I am studying the population of red-backed salamanders in Richmond; its density, spatial arrangement, and space use.


About Damián: I am a middle and high school Science and Math teacher. I have always been searching for innovative ways to get my students engaged in the science classroom and to connect their new knowledge with the real-world. In thinking of ways to help my students learn, I engaged my self with the scientific community collaborating in scientific projects and creating hands-on, interactive, and inspiring teaching lessons. It is my main interest to develop ideas that could positively contribute to any student’s STEM education.

SaveSave

SaveSave

SaveSave

SaveSave

SaveSave

SaveSave

SaveSave

SaveSave

Which would a woodlouse prefer?

Woodlice are small crustaceans that live on land. They look like bugs, but are actually more closely related to crabs and lobsters! Photo credit Liz Henwood.

The activities are as follows:

Woodlice are small crustaceans that live on land. They look like bugs, but are actually more closely related to crabs and lobsters. To escape predators they hide in dark places. They spend most of their time underground and have very poor eyesight.

One day, when digging around in the dark dirt of her compost pile, Nora noticed that there were many, many woodlice hiding together. This made her wonder how woodlice decide where to live. Because woodlice have very simple eyesight, Nora thought that maybe they use dark and light colors to decide where to go. They might choose to move towards darker colors and away from lighter colors to prevent ending up above ground where predators can easily find them.

Nora collecting woodlice from the compost pile.

Nora, along with classmates in her ecology class at Michigan State University, decided to run an experiment to study woodlice behavior. She collected 10 woodlice from her compost pile and placed them in a jar. She brought the jar into the lab. Then she chose a set of trays to work with from what she had in the lab – white, with tall sides. The sides of the tray were tall and smooth so the woodlice were not able to climb out. On one end of the tray Nora put some dark soil, and on the other side she put lighter leaves. If her hypothesis was correct, Nora predicted that woodlice would more often choose to move towards the dark soil habitat, compared to the lighter leaves habitat.

For each trial, Nora gently picked up a single woodlouse with forceps. She then placed it in the center of the tray. All the woodlice were positioned so they started facing the top of the tray, not at either habitat type. The woodlice then chose to move towards one end of the tray or the other. When they reached one of the piles the students recorded which habitat they chose. It was then picked up with forceps. Nora and her classmates recorded its length and placed it in a new jar so it could be released back into the compost pile once the experiment was done.

The tray where the preference trials were conducted. To the right of the tray is the soil pile, and to the left is the leaf pile. The center was purposefully left empty and wiped down before each run.

After running this experiment and looking at the data, Nora realized it did not work. The small sample size of only 10 individuals was not enough to see a pattern. Also, she realized that after one woodlouse went a certain way, all the others would follow it, maybe because they were following a scent trail. She decided she had to do the experiment again, this time with more woodlice and in a way that would prevent them following each other’s scent trails.

For her second try, Nora collected 51 woodlice from a different compost pile. Just like the first experiment, Nora placed lighter leaves on one end of a white tray and dark soil on the other. All the methods were the same, except for a few important changes. To get rid of scent trails, this time Nora wiped down the middle of the tray with a clean wet paper towel between trials. She also added equal amounts of water to both habitats to control for humidity. This ensured that if woodlice did show a preference for either habitat it would be due to habitat color, not humidity. This time Nora used a stopwatch and recorded how long it took for an individual to choose one of the two habitats.

Featured scientist: Nora Straquadine from Michigan State University

 Flesch–Kincaid Reading Grade Level = 7.7

Additional teacher resource related to this Data Nugget:

  • PowerPoint slideshow of images of woodlice and Nora’s experiment.
  • A great video to show before the Data Nugget to engage students with the activity – gives background on woodlice and describes the role that water plays for these crustaceans that live on land:

  • A video of woodlice on a fallen tree. This video has no audio, but can be useful for students to observe woodlice behavior:


About Nora: Nora is currently an undergraduate getting her B.S. in Zoology with a concentration in Zoo and Aquarium as well as a minor in Marine Ecosystem Management from Michigan State University. Although aquatic life is her main interest, she think it’s important to appreciate other animal groups and take a break to play and explore the nature around you. That curiosity was how she was able to volunteer in labs on campus from entomology to genetics, and how she came to spend a summer at the Kellogg Biological Station in Michigan.

SaveSave

SaveSave

SaveSave

SaveSave

SaveSave

SaveSave

SaveSave

Is it better to be bigger?

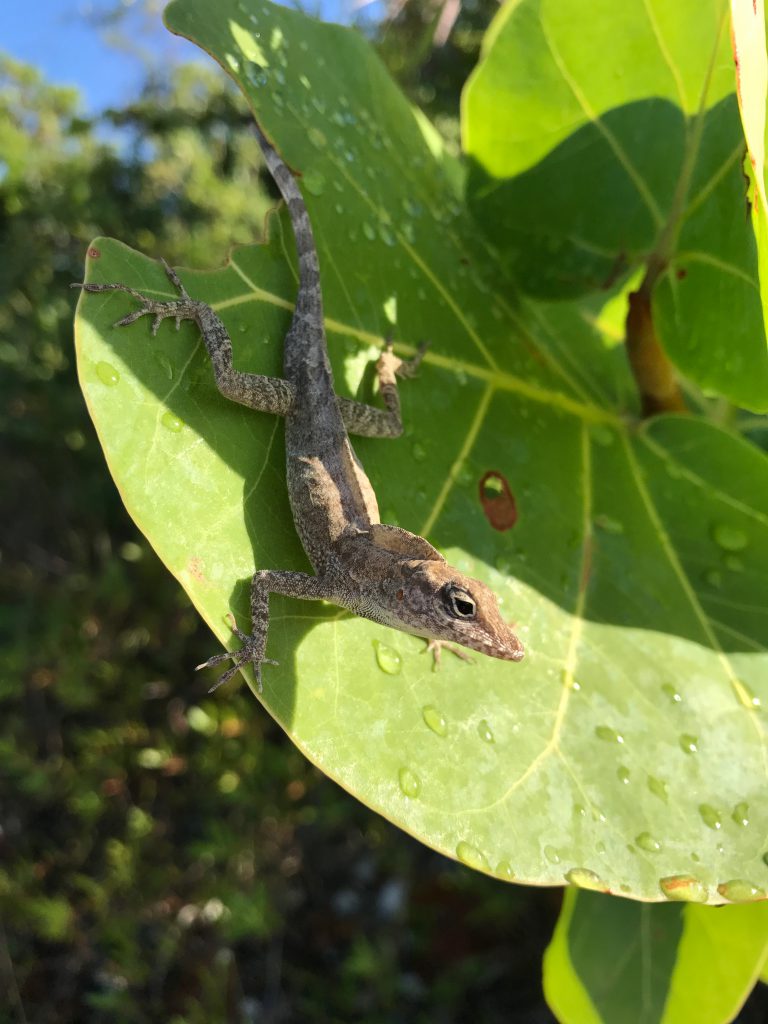
An anole lizard on the island, about to be captured by Aaron.

The activities are as follows:

When Charles Darwin talked about the “struggle for existence” he was making the observation that many individuals in the wild don’t survive long enough to reach adulthood. Many die before they have the chance to reproduce and pass on their genes to the next generation. Darwin also noted that in every species there is variation in physical traits such as size, color, and shape. Is it simply that those who survive to reproduce are lucky, or do these traits affect which individuals have a greater or lesser chance of surviving? Evolutionary biologists often work to see how differences in traits, such as body size, relate to differences in survival among individuals. When differences in traits are related to chances of survival, they are said to be under natural selection.

Brown anole lizards are useful for studies of natural selection because they are abundant in Florida and the Caribbean, easy to catch, and have a short life span. Brown anoles are very small when they hatch out of the egg. Because of their small size, these anole hatchlings are eaten by many different animals, including birds, crabs, other species of anole lizards, and even adult brown anoles! Predators could be a significant force of natural selection on brown anole hatchlings. Juvenile anoles that get eaten by predators will not survive to reproduce. Traits that help young brown anoles avoid predation and reproduce will get passed on to future generations.

Aaron with a baby anole lizard.

Aaron and Robert are scientists who study brown anoles on islands in Northeastern Florida. Along with their colleagues, they visit these islands every 6 to 10 weeks during the summer to survey the populations and measure natural selection in action. Aaron and Robert selected a small island that had a large brown anole population because they were able to find and measure all of the individuals on the island. Aaron observed that in the late summer there were thousands of hatchling lizards on the island, but by the middle of the summer the following year, only a few hundred of those lizards remained alive. He also observed that hatchlings varied greatly in body size and wondered if those differences in size affected the chances that an individual would survive to adulthood. He predicted that smaller hatchlings are more likely to die than larger ones because they are not as fast, and therefore not as likely to escape from predators and face a higher risk of being eaten.

To test this, Aaron and Robert captured hatchlings in July, assigned a unique identification number to each anole, measured their body length, and then released them back onto the island. In October of the same year, they returned to the island to capture and measure all surviving lizards. They calculated the average percent survival for each size category. Aaron predicted longer individuals would have higher survival. This would indicate that there was natural selection for larger body size in hatchlings.

Featured scientists: Aaron Reedy and Robert Cox from the University of Virginia. Co-written by undergraduate researcher Matt Kustra.

Flesch–Kincaid Reading Grade Level = 11.7

Additional teacher resource related to this Data Nugget:

  • For additional images of Robert and Aaron’s research with anoles in Florida, we have created PowerPoint slides that can be shown in class.
  • Aaron conducted this research as a graduate student in Robert Cox’s lab. To learn more about anole research, visit the lab’s website. To learn more about Aaron, visit his website.

Once your students have completed this Data Nugget, check out this video on anole size and natural selection from hurricanes!

SaveSave

SaveSave

SaveSave

SaveSave

SaveSave

SaveSave

Is it dangerous to be a showoff?

A male anole lizard showing his bright dewlap.

The activities are as follows:

Natural selection happens when differences in traits within a population give some individuals a better chance of surviving and reproducing than others. Traits that are beneficial are more likely to be passed on to future generations. However, sometimes a trait may be helpful in one context and harmful in another. For example, some animals communicate with other members of their species through visual displays. These signals can be used to defend territories and attract mates, which helps the animal reproduce. However, these same bright and colorful signals can draw the unwanted attention of predators.

Brown anoles are small lizards that are abundant in Florida and the Caribbean. They have an extendable red and yellow flap of skin on their throat, called a dewlap. To communicate with other brown anoles, they extend their dewlap and move their head and body. Males have particularly large dewlaps, which they often display in territorial defense against other males and during courtship with females. Females have much smaller dewlaps and use them less often.

Aaron with a baby anole lizard.

Aaron is a scientist interested in how natural selection might affect dewlap size in male and female brown anoles. He chose to work with anoles because they are ideal organisms for studies of natural selection; they are abundant, easy to catch, and have short life spans. Aaron wanted to know whether natural selection was acting in different ways for males and females to cause the differences in dewlap size. He thought that a male with a larger dewlap may be more effective at attracting females and passing on his genes to the next generation. However, males with larger, showy dewlaps may catch the eye of more predators and have higher chances of being eaten. Aaron was curious about this tradeoff and how it affected natural selection on dewlap size. For female brown anoles, Aaron thought that this tradeoff would be less important for survival because females have smaller dewlaps and use them less frequently as a signal. In other words, there may not be selection on dewlap size in females.

Using a population of brown anoles on a small island in Florida, Aaron set up a study to determine how dewlap size is related to survival and whether there is a difference between the sexes. He worked with his advisor, Robert, and other members of the lab. They designed a study to track every brown anole on the island and see who survived. In May 2015, they caught the adult lizards on the island and recorded their sex, body length, and dewlap size before releasing them with a unique identification number. Then, the lab returned to the island in October and collected all the adults once again to determine who survived and who didn’t. Aaron predicted that male anoles with larger than average dewlap size would be less likely to survive due to an increased risk of predation. He also predicted that dewlap size would not influence female survival.

Featured scientists: Aaron Reedy and Robert Cox from the University of Virginia. Co-written by undergraduate researcher Cara Giordano.

Flesch–Kincaid Reading Grade Level = 10.3

Additional teacher resource related to this Data Nugget:

  • For additional images of Robert and Aaron’s research with anoles in Florida, we have created PowerPoint slides that can be shown in class.
  • Aaron conducted this research as a graduate student in Robert Cox’s lab. To learn more about anole research, visit the lab’s website. To learn more about Aaron, visit his website.
  • To engage students before the Data Nugget and introduce them to brown anoles, check out this video that shows how brown anoles use dewlap signaling to attract mates and send rival males signals during confrontations:

SaveSave

SaveSave

SaveSave

SaveSave

SaveSave

SaveSave

SaveSave

When whale I sea you again?

Image of a humpback whale tail from the Palmer Station LTER. Photo credit Beth Simmons.

The activities are as follows:

People have hunted whales for over 5,000 years for their meat, oil, and blubber. In the 19th and 20th centuries, pressures on whales got even more intense as technology improved and the demand for whale products increased. This commercial whaling used to be very common in several countries, including the United States. Humpback whales were easy to hunt because they swim slowly, spend time in bays near the shore, and float when killed.  Before commercial whaling, humpback whales were one of the most visible animals in the ocean, but by the end of the 20th century whaling had killed more than 200,000 individuals.

Today, as populations are struggling to recover from whaling, humpback whales are faced with additional challenges due to climate change. Their main food source is krill, which are small crustaceans that live under sea ice. As sea ice disappears, the number of krill is getting lower and lower. Humpback whale population recovery may be limited because their main food source is threatened by ongoing ocean warming.

One geographic area that was over-exploited during times of high whaling was the South Shetland Islands along the Western Antarctic Peninsula (WAP). The WAP is in the southern hemisphere in Antarctica. Humpback whales migrate every year from the equator towards the south pole. In summer they travel 25,000 km (16,000 miles) south to WAP’s nutrient-rich polar waters to feed, before traveling back to the equator in the winter to breed or give birth. Today the WAP is experiencing one of the fastest rates of regional climate change with an increase in average temperatures of 6° C (10.8° F) since 1950. Loss of sea ice has been documented in recent years, along with reduced numbers of krill along the WAP.

Logan is a scientist who is studying how humpback whales are recovering after commercial whaling. Logan’s work helps keep track of the number of whales that visit the WAP in the summer. He also determines the sex ratio, or ratio of males to females, which is important for reproduction. The more females in a population compared to males, the greater the potential for having more baby whales born into the next generation. Logan predicts there may be a general trend of more females than males along the WAP as the season progresses from summer to fall. Logan thinks that female humpback whales stay longer in the WAP because they need to feed more than males in order to have extra nutrients and energy before they birth their babies later in the year. This extra energy will be needed for their milk supply to feed their babies.

The Palmer LTER station when Logan and others scientists live while they conduct research on whales.

Humpback whales only surface for air for a short period of time, making it difficult to determine their sex. In order to identify surfacing whales as female or male, scientists need to collect a biopsy, or a sample of living tissue, in order to examine the whale’s DNA. Logan worked with a team of scientists at Oregon State University and Duke University to engineer a modified crossbow that could be used to collect samples. Logan uses this crossbow to collect a biopsy sample each time they spot a whale. To collect a sample, Logan aims the crossbow at the whale’s back, taking care to avoid the dorsal fin, head, and fluke (tail). He mounts each arrow with a 40mm surgical stainless steel tip and a flotation device so the samples will bounce off the whale and float for collection. The samples are then frozen so they can be stored and brought back to the lab for analysis. Logan also takes pictures of each whale’s fluke because each has a pattern unique to that individual, just like the human fingerprint. Additionally, at the time of biopsy, Logan records the pod size (number of whales in the area) and GPS location.

Logan’s data are added to the long-term datasets collected at the WAP. To address his question he used data from 2010-2016 along the WAP and other feeding grounds. Logan’s data ranges from January to April because those are the months he is able to spend at the research station in the WAP before it gets too cold. Logan has added to the scientific knowledge we have about whales by building off of and using data collected by other scientists.

Featured scientist: Logan J. Pallin from Oregon State University. Written by: Alexis Custer

Flesch–Kincaid Reading Grade Level = 10.7

Additional teacher resources related to this Data Nugget:

  • To see more images of humpback whales, and the Palmer Research Station in the WAP where Logan works, check out this PowerPoint. This can be shared with students in class after they read the Research Background and before they move on to the data.
  • More data from this region can be found on the DataZoo, Palmer LTER’s online data portal. To access data on this portal, follow instructions found on this “cheat sheet”. For files that have been compiled for educators, check out this Google Drive folder.
  • For his research, Logan has traveled to United States Antarctic Programs’ Palmer Research Station on the WAP during the austral summer and fall and will be departing again for the WAP in January 2018. He is part of a team of scientists interested in Palmer Long Term Ecological Research, which is funded through the National Science Foundation, documenting changes on in the Antarctic ecosystem.
  • For more information on whale research at Palmer Station LTER and the WAP, check out this website.
  • For additional classroom activities dealing with Palmer Station LTER data, check out this website.
  • The International Whaling Commission (IWC) was created in
    1946 in Washington D.C. in hopes to provide conservation to whale stocks around the world. In 1982, the IWC placed a moratorium on commercial whaling. Fore more information on the IWC and humpback whales, check out their website.

About Logan: Logan is interested in determining how humpback whales are recovering after commercial whaling. Logan first got interested in working with marine mammals when he was an undergraduate student at Duke University and had the opportunity to work as a field technician on a project with some scientists at Duke. He quickly realized this was what he wanted to do and that studying humpbac whales was particularly interesting as they appear to have all rebounded quite heavily in the Southern Hemisphere. Assessing why this recovery was happening so fast and why now, was something Logan really wanted to look at. After graduating from college, he continued to work with marine mammologists as a graduate student to receive his Masters in Science from Oregon State University. In the fall of 2017, he started his work on a PhD from University of California, Santa Cruz continuing asking questions and learning more about whales around Antarctica.
SaveSave

SaveSave

SaveSave

SaveSave

SaveSave

SaveSave

SaveSave

SaveSave

SaveSave

SaveSave

SaveSave

SaveSave

City parks: wildlife islands in a sea of cement

Image of a red fox caught on one of the wildlife cameras.

The activities are as follows:

For most of our existence, humans have lived in rural, natural places. However, more and more people continue to move into cities and urban areas. The year 2008 marked the first time ever in human history that the majority of people on the planet lived in cities. The movement of humans from rural areas to cities has two important effects. First, the demand that people place on the environment is becoming very intense in certain spots. Second, for many people, the city is becoming the main place where they experience nature and interact with wildlife on a regular basis.

Remington and Grant are city-dwellers and have been their entire lives. Remington grew up in Tulsa, Oklahoma and Grant is from Cleveland, Ohio. In Tulsa, Remington fell in love with nature while running on the trails of city parks during cross country and track practices. Grant developed a love for nature while fishing and hiking in the Cleveland Metroparks in Ohio. These experiences led them to study wildlife found in urban environments because they believe that cities can be places where both humans and wildlife thrive. However, to make this belief a reality, scientists must understand how wildlife are using habitats within a city. This knowledge will provide land managers the information they need to create park systems that support all types of species. However, almost all research done on wildlife takes place in natural areas, like national parks, so there is currently very little known about wildlife habits in urban areas. To address this gap in knowledge, Remington, Grant, and their colleagues conduct ecological research on the urban wildlife populations in the Cleveland Metroparks.

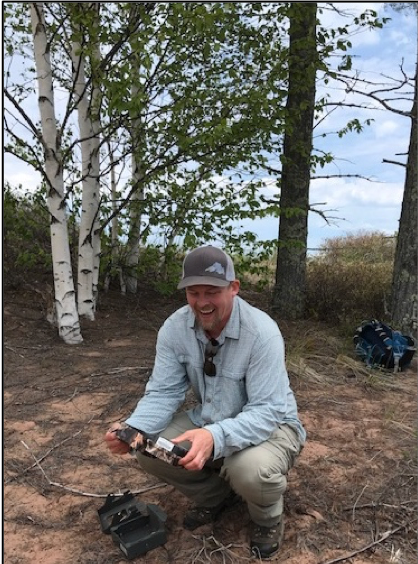
Remington prepares to attach the camera to a buckeye tree. He secures them with a heavy-duty lock to keep the cameras safe from theft by people using the parks.

The Cleveland Metroparks are a collection of wooded areas that range in size, usage, and maintenance. Some are highly used small parks with mowed grass, while others are large, rural parks with thousands of acres of forest and miles of winding trails. As they began studying the Metroparks, they noticed the parks were like little “islands” of wildlife habitat within a large “sea” of buildings, pavement, houses and people. This reminded Remington and Grant of a fundamental theory in ecology: the theory of island biogeography. This theory has two components: size and isolation of islands. The first predicts that larger islands will have higher biodiversity because there are more resources and space to support more wildlife than smaller areas. The second is that islands farther away from the mainland will have lower biodiversity because more isolated islands are harder for wildlife to reach. Remington and Grant wondered if they could address this first component in the wide variety of areas that are part of the Cleveland Metroparks. If the theory holds for the Metroparks, it could help them to figure out where most species live in the park system and help managers better maximize biodiversity. It would also provide an important link between ecological research conducted in natural areas and urban ecology.

To evaluate whether the theory of island biogeography holds true in urban areas, Remington and Grant set up 104 wildlife cameras throughout the parks. These cameras photograph animals when triggered by motion. They used these photographs to identify the locations of wildlife in the parks and to get a count of how many individuals there are, known as their abundance. With these data, they tested whether the size of the park would influence biodiversity as predicted by the theory of island biogeography.

One challenge with measuring “biodiversity” is that it means different things to different people. Remington and Grant looked at two common measurements of biodiversity. First, species richness, which is the number of different species observed in each park. Second, they calculated the Shannon Wiener Index of biodiversity for each park. This index incorporates both species richness and species evenness. Species evenness tells us whether the abundances of each species are similar, or if one type is most common and the others are rare. Evenness is important because it tells you whether a park has lots of animals from many different species or if most animals are from a single species. If a park has greater evenness of species, the Shannon-Wiener index will be higher.

Featured scientists: Remington Moll and Grant Woodard from Michigan State University

Flesch–Kincaid Reading Grade Level = 11.4

Additional teacher resource related to this Data Nugget:

  • Remington and Grant have made their data available for use in classrooms. If you would like to have your students work with raw data, it can be used to calculate the Shannon Wiener Index, or explore other aspects of species richness and evenness in the parks. This data is not yet published, so keep in mind this data is intended only for classroom use. Download the Excel file here!
  • PowerPoint slideshow of images from the wildlife cameras in the Cleveland Metroparks.
  • Citizen science Zooniverse site where students can view data and identify species from Remington and Grant’s cameras.
  • For more background on the importance of biodiversity, students can eat this article in The Guardian – What is biodiversity and why does it matter to us?

Remington, and other members of his lab, have written blog posts about this research. These readings would be appropriate for a middle or high school reading level and would give students more context for the researchSaveSave

SaveSave

SaveSave

SaveSave

SaveSave

SaveSave

SaveSave

SaveSave

SaveSave

SaveSave

SaveSave


About Remington: Remington is a Ph.D. student and NSF Graduate Research Fellow at Michigan State University in Dr. Bob Montgomery’s lab. Prior to Michigan State, Remington received B.S. and M.S. degrees from the University of Missouri, where he worked with Dr. Josh Millspaugh. Following his M.S., he spent time in Amman, Jordan doing work with the Royal Society for the Conservation of Nature and spent three years teaching high school biology, chemistry, and theology at the Beirut Baptist School in Lebanon.

He uses cutting-edge technologies such as GPS collars and camera-traps to study predator-prey interactions between large carnivores and their prey. He is particularly excited about evaluating how ecological theory developed in “natural” areas like national parks applies to urban contexts. Remington grew up in the city and fell in love with nature and ecology in city parks. Although it carries substantial challenges, Remington believes that humans and large predators can peaceably coexist, even in and around cities. It is his goal to use the lessons learned in his research to help make that belief a reality.

SaveSave

SaveSave

Why are butterfly wings colorful?

The red postman butterfly, Heliconius erato.

The activities are as follows:

Éste Data Nugget también está disponible en Español:

You’ve probably noticed a bright orange butterfly in your garden. It’s hovering over a plant, and then pausing to lay an egg. It’s landing on a flower, and then sipping the tasty syrup. Big wings allow butterflies to fly everywhere with ease. But you may wonder, why are their wings so brightly colored? One reason why butterflies might have brightly colored wings is that these colors warn birds and other predators that they would not make a tasty meal. Another potential reason for butterflies to have bright colors and dramatic patterns is to attract mates. However, there is little research that shows whether color alone or color pattern together deter predators or attract mates.

Susan holding a different species of butterfly in the field.

The red postman butterfly lives in rainforests in Mexico, Central America, and South America. The color pattern on its wing is usually a mix of red, yellow, and black. These patterns vary a lot depending on their location; for instance one variant has a red bar on the forewings and a yellow bar on its hind wings while another variant has red rays on the hindwings and a yellow bar on the forewings. Scientists Susan, Adriana, and Robert have been studying this species for many years. While hiking in the rainforest, they noticed that not all butterfly species are brightly colored. They started to wonder why the red postman butterfly has bright colors, but other species do not. They thought maybe the red and yellow colors and patterns signaled toxicity to predators, like birds; or these wing features may be used to help find and attract mates. Susan, Adriana and Robert predicted that brightly colored butterflies would be avoided by birds and approached more often by other butterflies of the same species. They also predicted that the local color pattern would get the strongest response from predators and mates, because it would be most recognized in that area.

To test their ideas, the team of butterfly scientists created three kinds of artificial red postman butterfly models using paper and a printer. Each model had a plastic body and paper wings. Model A had the same pattern as the local butterflies at the study site in the La Selva Tropical Biological Station in Sarapiquí, Costa Rica, with brightly colored red and yellow wings. Model B also had the same pattern as the local butterflies, but only had black and white tones. Model C had a different pattern than the locals with bright red and yellow colors.

One of the 400 black and white models in the rainforest during the experiment.

To test for differences in predation attempts based on wing color and patterns, they placed 4 of each model at 100 different sites in the rainforest. This made a total of 1,200 model butterflies with 400 of each type! Models were placed far enough apart that they were not within human visible range from one another (on average separated by 5-10 m), and were positioned approximately 1.5 m above the ground, which is consistent with natural roosting heights. The models were left out in the forest for a total of 96 hours. Each day they were inspected and counted for bird beak marks on their wings and plastic bodies. Only new marks were scored each day, so attacks on individual models were only counted once. To test whether red postman butterflies were more attracted to bright colors, or the local wing pattern, Susan and her student field assistants also caught 51 wild red postman butterflies from the rainforest and brought them to a greenhouse. They then presented the live butterflies with the three models and counted how many times they approached each model type.

Featured scientists: Susan Finkbeiner, Adriana Briscoe, and Robert Reed from University of California, Irvine

Flesch–Kincaid Reading Grade Level = 9.9

Watch two videos of experimental trials from the greenhouse experiment:

The first shows a male butterfly approaching a butterfly paper model with color. The second shows a butterfly as it chooses between a butterfly paper model that is black-and-white and one that has color.

poster
Video Trial 1
00:00
--
/
--
poster
Video Trial 2
00:00
--
/
--

There are two publications related to this Data Nugget:

You can follow all three scientists on Twitter where they tweet about the latest scientific discoveries involving butterflies, animals, vision and behavior! Adriana @AdrianaBriscoe, Susan @Fink_about_it, and Robert @FascinatingPupa.

SaveSave

SaveSave

SaveSaveSaveSave

SaveSave

SaveSave

SaveSave

SaveSave

SaveSave

SaveSave

SaveSave

SaveSave

SaveSave

SaveSave

SaveSave

SaveSave

To bee or not to bee aggressive

A honey bee (Apis mellifera) collecting nectar to bring back to the hive. Photo by Andreas Trepte.

The activities are as follows:

Honey bees are highly social creatures that live in large colonies of about 40,000 individuals and one queen. Every member of the hive works together to benefit the colony. Some of the tasks adult bees perform include making honey, nursing young, foraging for food, building honey comb structures, and defending the colony.

From spring through fall, the main task is turning nectar from plants to honey. The honey is stored and eaten over the winter, so it is vital for the colony’s survival. Because honey is an energy-rich food source, hives are targets for break-ins from animals, like bears, skunks, and humans that want to steal the honey. Bees even have to fight off bees from other colonies that try to steal honey. Research shows that colonies adjust their defenses to match threats found in their environment. Hives in high risk areas respond by becoming more aggressive, and hives that do not face a lot of threats are able to lower their aggression. This flexibility makes sure they do not waste energy on unnecessary behaviors.

Clare is a scientist studying the behavior of social animals. There is an interesting pattern seen in other social animals, including humans, that Clare wanted to test in honey bees. In these species, the social environment experienced when an individual is young can have lasting effects on their behavior later in life. This may be because this is the time that the brain is developing. She thought this would likely be the case with honey bees for two reasons. First, bees can use social information to help coordinate group defense. Second, young bees rely completely on adult bees to bring them food and incubate them, so there are a lot of social interactions when they are young. After reading the literature and speaking with other honey bee experts, Clare found out that no one had ever tested this before!

Honey bee larva (top) and an emerging adult (bottom).

Clare chose to look at aggression level as a behavioral trait of individual bees within a colony. She predicted that young honey bees raised in an aggressive colony would be more aggressive as adults, compared to honey bees raised in a less aggressive colony. To test her predictions, Clare used 500 honey bee eggs from 18 different queens. To get these 500 eggs she collected three times in the summer, for two years. Each time she collected, she went to two different locations. Collecting from so many different queens helped Clare make sure her study included eggs with a large genetic diversity.

To test her questions, she used these eggs to set up an experiment. Eggs from each of the 18 queens were split into two groups. Each group was put into one of two types of foster colonies – high aggression and low aggression. Clare determined whether each foster colony was considered high or low aggression using a test. Because half of each queen’s eggs went into a low aggression foster colony, and the other half in a high aggression foster colony, this represents the experimental treatment.

Clare left the foster colonies alone and waited for the bees to develop in the hives. Eggs hatch and turn into larvae. These larvae mature into pupae and then into adults. Just before the young bees emerged from their pupal stage to adulthood, Clare removed them from the foster colonies and brought them into the lab. This way the bees would spend their whole adult life in the lab together, sharing a common environment.

After a week in the lab, Clare tested the aggressiveness of each individual bee. Her test measured aggressive behaviors used by a bee to defend against a rival bee from another colony. Clare observed and counted a range of behaviors including attempts to sting the rival and bites to the rival’s wings and legs. She used these values to calculate an offspring aggression score for each bee.

To select high and low aggression foster colonies to be used in her experiment, Clare first had to identify which colonies were aggressive and which were not. To do this, she put a small amount of a chemical that makes bees aggressive on a piece of paper at the front of the colony entrance. The top two photos show two colony entrances before the chemical. The bottom two photos show the same two colonies 60 seconds after the chemical. The more bees that come out, the more aggressive the colony. You can see from these images that the colony on the right is much more aggressive than the colony on the left. Clare counted the number of bees and used this value to calculate the colony’s aggression score.

Featured scientist: Clare C. Rittschof from the University of Kentucky

Flesch–Kincaid Reading Grade Level = 9.2

SaveSave

SaveSave

SaveSave