City parks: wildlife islands in a sea of cement

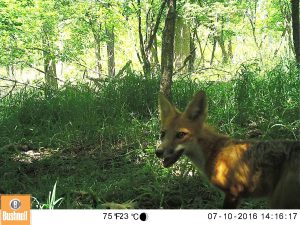
Image of a red fox caught on one of the wildlife cameras.

The activities are as follows:

For most of our existence, humans have lived in rural, natural places. However, more and more people continue to move into cities and urban areas. The year 2008 marked the first time ever in human history that the majority of people on the planet lived in cities. The movement of humans from rural areas to cities has two important effects. First, the demand that people place on the environment is becoming very intense in certain spots. Second, for many people, the city is becoming the main place where they experience nature and interact with wildlife on a regular basis.

Remington and Grant are city-dwellers and have been their entire lives. Remington grew up in Tulsa, Oklahoma and Grant is from Cleveland, Ohio. In Tulsa, Remington fell in love with nature while running on the trails of city parks during cross country and track practices. Grant developed a love for nature while fishing and hiking in the Cleveland Metroparks in Ohio. These experiences led them to study wildlife found in urban environments because they believe that cities can be places where both humans and wildlife thrive. However, to make this belief a reality, scientists must understand how wildlife are using habitats within a city. This knowledge will provide land managers the information they need to create park systems that support all types of species. However, almost all research done on wildlife takes place in natural areas, like national parks, so there is currently very little known about wildlife habits in urban areas. To address this gap in knowledge, Remington, Grant, and their colleagues conduct ecological research on the urban wildlife populations in the Cleveland Metroparks.

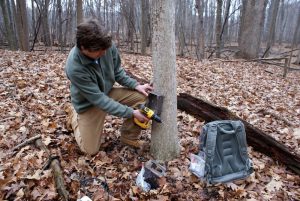
Remington prepares to attach the camera to a buckeye tree. He secures them with a heavy-duty lock to keep the cameras safe from theft by people using the parks.

The Cleveland Metroparks are a collection of wooded areas that range in size, usage, and maintenance. Some are highly used small parks with mowed grass, while others are large, rural parks with thousands of acres of forest and miles of winding trails. As they began studying the Metroparks, they noticed the parks were like little “islands” of wildlife habitat within a large “sea” of buildings, pavement, houses and people. This reminded Remington and Grant of a fundamental theory in ecology: the theory of island biogeography. This theory has two components: size and isolation of islands. The first predicts that larger islands will have higher biodiversity because there are more resources and space to support more wildlife than smaller areas. The second is that islands farther away from the mainland will have lower biodiversity because more isolated islands are harder for wildlife to reach. Remington and Grant wondered if they could address this first component in the wide variety of areas that are part of the Cleveland Metroparks. If the theory holds for the Metroparks, it could help them to figure out where most species live in the park system and help managers better maximize biodiversity. It would also provide an important link between ecological research conducted in natural areas and urban ecology.

To evaluate whether the theory of island biogeography holds true in urban areas, Remington and Grant set up 104 wildlife cameras throughout the parks. These cameras photograph animals when triggered by motion. They used these photographs to identify the locations of wildlife in the parks and to get a count of how many individuals there are, known as their abundance. With these data, they tested whether the size of the park would influence biodiversity as predicted by the theory of island biogeography.

One challenge with measuring “biodiversity” is that it means different things to different people. Remington and Grant looked at two common measurements of biodiversity. First, species richness, which is the number of different species observed in each park. Second, they calculated the Shannon Wiener Index of biodiversity for each park. This index incorporates both species richness and species evenness. Species evenness tells us whether the abundances of each species are similar, or if one type is most common and the others are rare. Evenness is important because it tells you whether a park has lots of animals from many different species or if most animals are from a single species. If a park has greater evenness of species, the Shannon-Wiener index will be higher.

Featured scientists: Remington Moll and Grant Woodard from Michigan State University

Flesch–Kincaid Reading Grade Level = 11.4

Additional teacher resource related to this Data Nugget:

  • Remington and Grant have made their data available for use in classrooms. If you would like to have your students work with raw data, it can be used to calculate the Shannon Wiener Index, or explore other aspects of species richness and evenness in the parks. This data is not yet published, so keep in mind this data is intended only for classroom use. Download the Excel file here!
  • PowerPoint slideshow of images from the wildlife cameras in the Cleveland Metroparks.
  • Citizen science Zooniverse site where students can view data and identify species from Remington and Grant’s cameras.
  • For more background on the importance of biodiversity, students can eat this article in The Guardian – What is biodiversity and why does it matter to us?

Remington, and other members of his lab, have written blog posts about this research. These readings would be appropriate for a middle or high school reading level and would give students more context for the researchSaveSave

SaveSave

SaveSave

SaveSave

SaveSave

SaveSave

SaveSave

SaveSave

SaveSave

SaveSave

SaveSave


About Remington: Remington is a Ph.D. student and NSF Graduate Research Fellow at Michigan State University in Dr. Bob Montgomery’s lab. Prior to Michigan State, Remington received B.S. and M.S. degrees from the University of Missouri, where he worked with Dr. Josh Millspaugh. Following his M.S., he spent time in Amman, Jordan doing work with the Royal Society for the Conservation of Nature and spent three years teaching high school biology, chemistry, and theology at the Beirut Baptist School in Lebanon.

He uses cutting-edge technologies such as GPS collars and camera-traps to study predator-prey interactions between large carnivores and their prey. He is particularly excited about evaluating how ecological theory developed in “natural” areas like national parks applies to urban contexts. Remington grew up in the city and fell in love with nature and ecology in city parks. Although it carries substantial challenges, Remington believes that humans and large predators can peaceably coexist, even in and around cities. It is his goal to use the lessons learned in his research to help make that belief a reality.

SaveSave

SaveSave

Why are butterfly wings colorful?

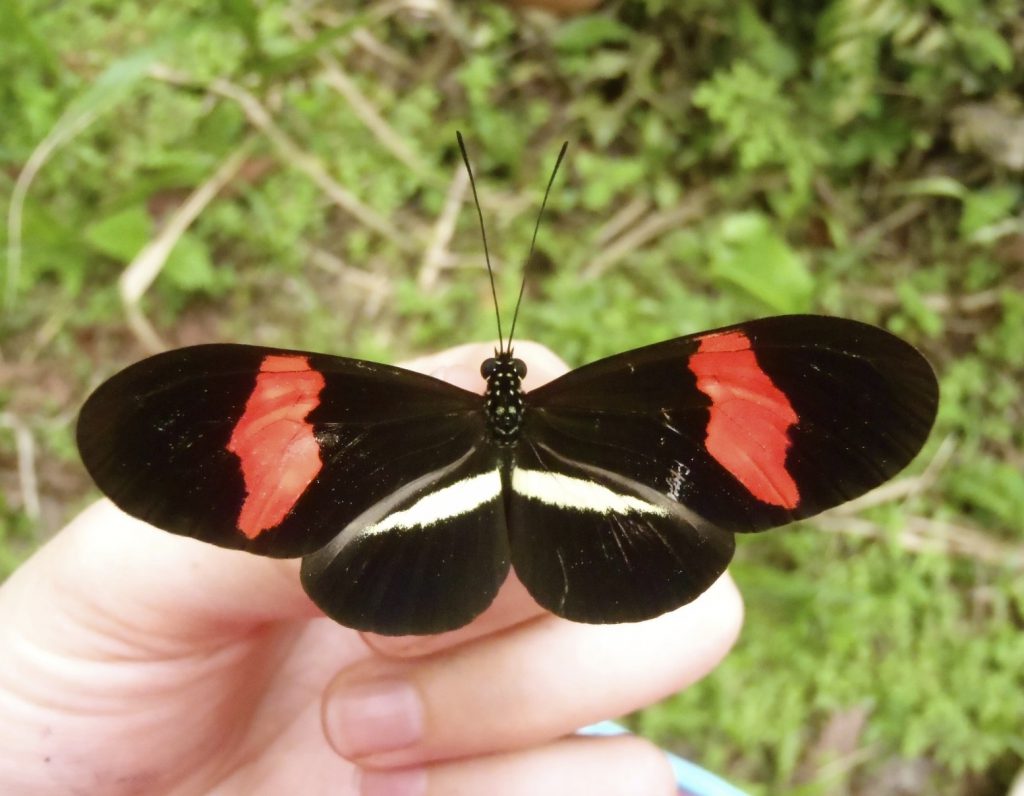
The red postman butterfly, Heliconius erato.

The activities are as follows:

Éste Data Nugget también está disponible en Español:

You’ve probably noticed a bright orange butterfly in your garden. It’s hovering over a plant, and then pausing to lay an egg. It’s landing on a flower, and then sipping the tasty syrup. Big wings allow butterflies to fly everywhere with ease. But you may wonder, why are their wings so brightly colored? One reason why butterflies might have brightly colored wings is that these colors warn birds and other predators that they would not make a tasty meal. Another potential reason for butterflies to have bright colors and dramatic patterns is to attract mates. However, there is little research that shows whether color alone or color pattern together deter predators or attract mates.

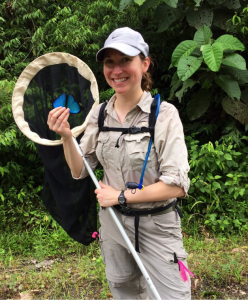
Susan holding a different species of butterfly in the field.

The red postman butterfly lives in rainforests in Mexico, Central America, and South America. The color pattern on its wing is usually a mix of red, yellow, and black. These patterns vary a lot depending on their location; for instance one variant has a red bar on the forewings and a yellow bar on its hind wings while another variant has red rays on the hindwings and a yellow bar on the forewings. Scientists Susan, Adriana, and Robert have been studying this species for many years. While hiking in the rainforest, they noticed that not all butterfly species are brightly colored. They started to wonder why the red postman butterfly has bright colors, but other species do not. They thought maybe the red and yellow colors and patterns signaled toxicity to predators, like birds; or these wing features may be used to help find and attract mates. Susan, Adriana and Robert predicted that brightly colored butterflies would be avoided by birds and approached more often by other butterflies of the same species. They also predicted that the local color pattern would get the strongest response from predators and mates, because it would be most recognized in that area.

To test their ideas, the team of butterfly scientists created three kinds of artificial red postman butterfly models using paper and a printer. Each model had a plastic body and paper wings. Model A had the same pattern as the local butterflies at the study site in the La Selva Tropical Biological Station in Sarapiquí, Costa Rica, with brightly colored red and yellow wings. Model B also had the same pattern as the local butterflies, but only had black and white tones. Model C had a different pattern than the locals with bright red and yellow colors.

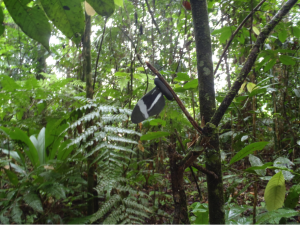
One of the 400 black and white models in the rainforest during the experiment.

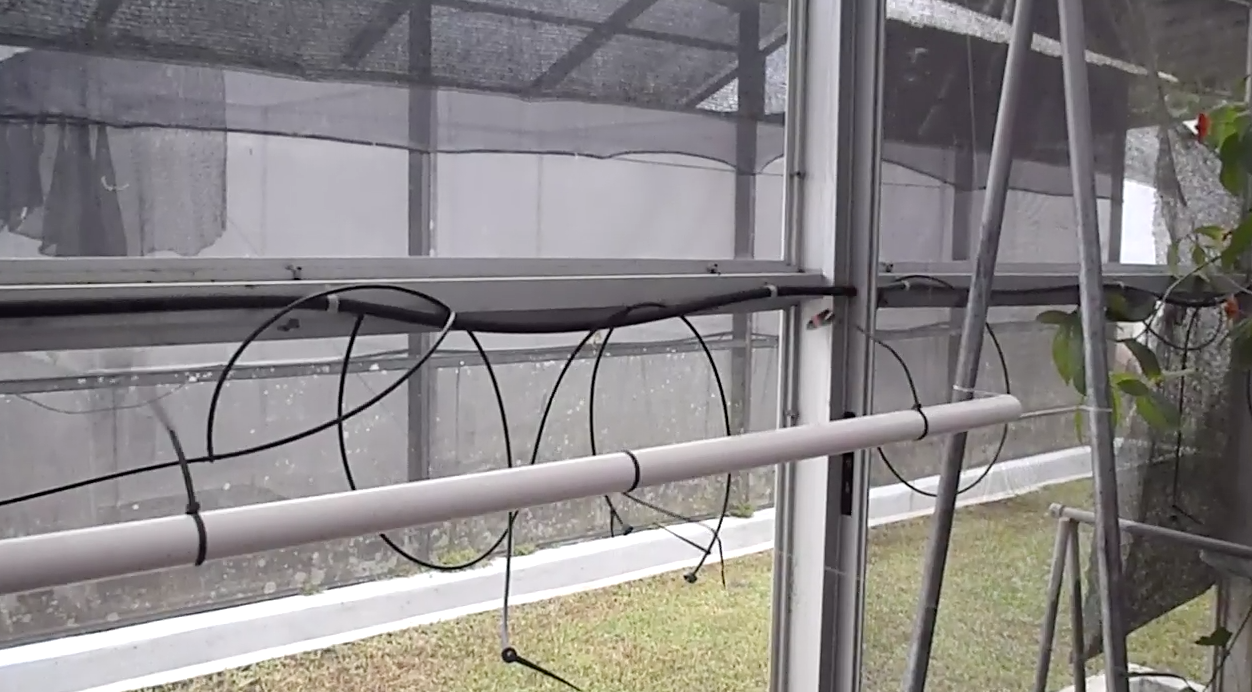
To test for differences in predation attempts based on wing color and patterns, they placed 4 of each model at 100 different sites in the rainforest. This made a total of 1,200 model butterflies with 400 of each type! Models were placed far enough apart that they were not within human visible range from one another (on average separated by 5-10 m), and were positioned approximately 1.5 m above the ground, which is consistent with natural roosting heights. The models were left out in the forest for a total of 96 hours. Each day they were inspected and counted for bird beak marks on their wings and plastic bodies. Only new marks were scored each day, so attacks on individual models were only counted once. To test whether red postman butterflies were more attracted to bright colors, or the local wing pattern, Susan and her student field assistants also caught 51 wild red postman butterflies from the rainforest and brought them to a greenhouse. They then presented the live butterflies with the three models and counted how many times they approached each model type.

Featured scientists: Susan Finkbeiner, Adriana Briscoe, and Robert Reed from University of California, Irvine

Flesch–Kincaid Reading Grade Level = 9.9

Watch two videos of experimental trials from the greenhouse experiment:

The first shows a male butterfly approaching a butterfly paper model with color. The second shows a butterfly as it chooses between a butterfly paper model that is black-and-white and one that has color.

poster
Video Trial 1
00:00
--
/
--
poster
Video Trial 2
00:00
--
/
--

There are two publications related to this Data Nugget:

You can follow all three scientists on Twitter where they tweet about the latest scientific discoveries involving butterflies, animals, vision and behavior! Adriana @AdrianaBriscoe, Susan @Fink_about_it, and Robert @FascinatingPupa.

SaveSave

SaveSave

SaveSaveSaveSave

SaveSave

SaveSave

SaveSave

SaveSave

SaveSave

SaveSave

SaveSave

SaveSave

SaveSave

SaveSave

SaveSave

SaveSave

To bee or not to bee aggressive

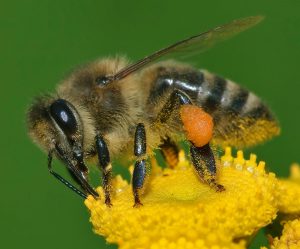
A honey bee (Apis mellifera) collecting nectar to bring back to the hive. Photo by Andreas Trepte.

The activities are as follows:

Honey bees are highly social creatures that live in large colonies of about 40,000 individuals and one queen. Every member of the hive works together to benefit the colony. Some of the tasks adult bees perform include making honey, nursing young, foraging for food, building honey comb structures, and defending the colony.

From spring through fall, the main task is turning nectar from plants to honey. The honey is stored and eaten over the winter, so it is vital for the colony’s survival. Because honey is an energy-rich food source, hives are targets for break-ins from animals, like bears, skunks, and humans that want to steal the honey. Bees even have to fight off bees from other colonies that try to steal honey. Research shows that colonies adjust their defenses to match threats found in their environment. Hives in high risk areas respond by becoming more aggressive, and hives that do not face a lot of threats are able to lower their aggression. This flexibility makes sure they do not waste energy on unnecessary behaviors.

Clare is a scientist studying the behavior of social animals. There is an interesting pattern seen in other social animals, including humans, that Clare wanted to test in honey bees. In these species, the social environment experienced when an individual is young can have lasting effects on their behavior later in life. This may be because this is the time that the brain is developing. She thought this would likely be the case with honey bees for two reasons. First, bees can use social information to help coordinate group defense. Second, young bees rely completely on adult bees to bring them food and incubate them, so there are a lot of social interactions when they are young. After reading the literature and speaking with other honey bee experts, Clare found out that no one had ever tested this before!

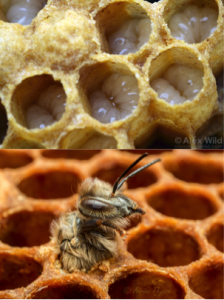
Honey bee larva (top) and an emerging adult (bottom).

Clare chose to look at aggression level as a behavioral trait of individual bees within a colony. She predicted that young honey bees raised in an aggressive colony would be more aggressive as adults, compared to honey bees raised in a less aggressive colony. To test her predictions, Clare used 500 honey bee eggs from 18 different queens. To get these 500 eggs she collected three times in the summer, for two years. Each time she collected, she went to two different locations. Collecting from so many different queens helped Clare make sure her study included eggs with a large genetic diversity.

To test her questions, she used these eggs to set up an experiment. Eggs from each of the 18 queens were split into two groups. Each group was put into one of two types of foster colonies – high aggression and low aggression. Clare determined whether each foster colony was considered high or low aggression using a test. Because half of each queen’s eggs went into a low aggression foster colony, and the other half in a high aggression foster colony, this represents the experimental treatment.

Clare left the foster colonies alone and waited for the bees to develop in the hives. Eggs hatch and turn into larvae. These larvae mature into pupae and then into adults. Just before the young bees emerged from their pupal stage to adulthood, Clare removed them from the foster colonies and brought them into the lab. This way the bees would spend their whole adult life in the lab together, sharing a common environment.

After a week in the lab, Clare tested the aggressiveness of each individual bee. Her test measured aggressive behaviors used by a bee to defend against a rival bee from another colony. Clare observed and counted a range of behaviors including attempts to sting the rival and bites to the rival’s wings and legs. She used these values to calculate an offspring aggression score for each bee.

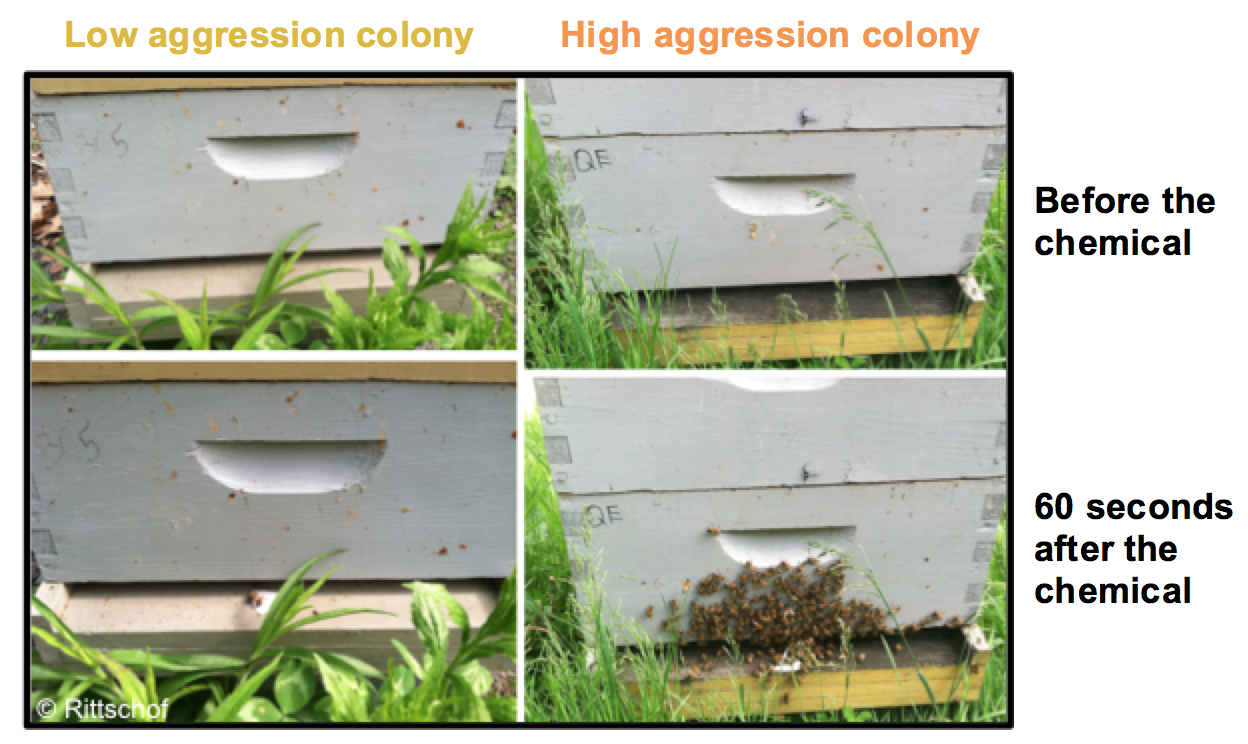
To select high and low aggression foster colonies to be used in her experiment, Clare first had to identify which colonies were aggressive and which were not. To do this, she put a small amount of a chemical that makes bees aggressive on a piece of paper at the front of the colony entrance. The top two photos show two colony entrances before the chemical. The bottom two photos show the same two colonies 60 seconds after the chemical. The more bees that come out, the more aggressive the colony. You can see from these images that the colony on the right is much more aggressive than the colony on the left. Clare counted the number of bees and used this value to calculate the colony’s aggression score.

Featured scientist: Clare C. Rittschof from the University of Kentucky

Flesch–Kincaid Reading Grade Level = 9.2

SaveSave

SaveSave

SaveSave

Deadly windows

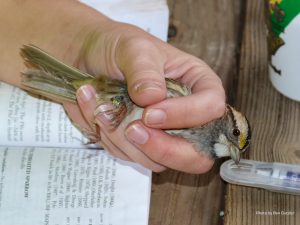
A white-throated sparrow caught during the experiment. You can see the band on it’s leg, used to make sure they did not record the same bird more than once.

The activities are as follows:

Glass makes for a great windowpane because you can see right through it. However, the fact that windows are see-through makes them very dangerous for birds. Have you ever accidentally run into a glass door or been confused by a tall mirror in a restaurant? Just like people, birds can mistake a see-through window or a mirrored pane for an opening to fly through or a place to get food and will accidentally fly into them. These window collisions can hurt the bird or even kill it. Window collisions kill nearly one billion birds every year!

Urban areas, with a lot of houses and stores, have a lot of windows. Resident birds that live in the area may get to know these buildings well and may learn to avoid the windows. However, not all the birds in an area live there year-round. There are also migrant birds that fly through urban areas during their seasonal migrations. In the fall, for example, migrant birds use gardens and parks in urban areas to rest along their journeys to their winter southern homes. During the fall migration, people have noticed that it seems like more birds fly into windows. This may be because migrant birds, especially the ones born that summer, are not familiar with the local buildings. While looking for food and places to sleep, migrant birds might have more trouble identifying windows and fly into them more often. However, it could also be that there are simply more window collisions in the fall because there are more birds in the area when migrant and resident birds co-occur in urban areas.

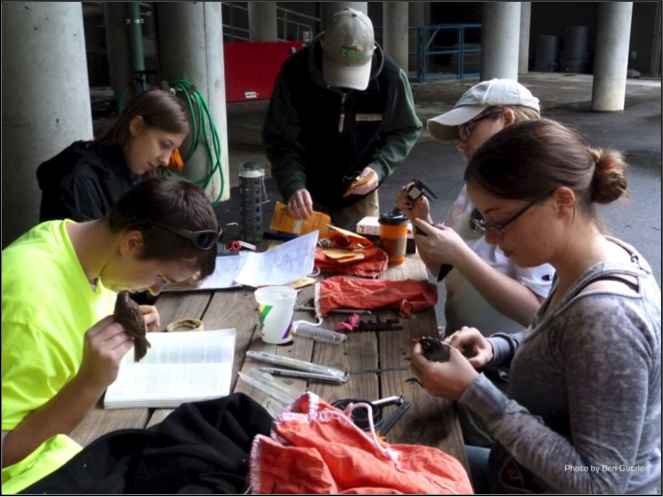
Researchers identify the species of each bird caught in one of the nets used in the study. They then place a metal bracelet on one leg so they will know if they catch the same bird again.

Natasha was visiting a friend who worked at a zoo when he told her about a problem they were having. For a few weeks in the fall, they would find dead birds under the windows, more than they would during the rest of the year. He wanted to figure out a way to prevent birds from hitting the exhibit windows. Natasha became interested in learning whether migrant birds were more likely to fly into windows than resident birds or if the number of window collisions only increase in the fall because there are a lot of birds around. To do this she would have to count the total number of birds in the area and also the total number of birds that were killed in window collisions, as well as identify the types of birds. To count the total number of birds in the area, Natasha hung nets that were about the same height as windows. When the birds got caught in the nets, Natasha could count and identify them. These data could then be used to calculate the proportion of migrants and residents flying at window-height. She put 10 nets up once a week for four hours, over the course of three months, and checked them every 15 minutes for any birds that got caught.

Researcher identifying a yellow-rumped warbler, one of the birds captured in the net as part of the study.

Then, she also checked under the windows in the same area to see what birds were killed from window collisions. She checked the windows every morning and evening for the three months of the study. Different species of birds are migratory or resident in the area where Natasha did her study. Each bird caught in nets was examined to identify its to species using its feathers, which would tell her whether the bird was a migrant or a resident. The same was done for birds found dead below windows.

If window collisions are really more dangerous for migrants, she predicted that a higher proportion of migrants would fly into windows than were caught in the nets. But, if window collisions were in the same proportion as the birds caught in the nets, she would have evidence that windows were just as dangerous for resident birds as for migrants.

Featured scientist: Natasha Hagemeyer from Old Dominion University

Flesch–Kincaid Reading Grade Level = 8.7

There is one scientific paper associated with the data in this Data Nugget. The citation and PDF of the paper is below:

To engage students with the lesson before they begin, or after the lesson to help them develop their own independent questions for the system, you can share the following videos:

SaveSave

SaveSave

SaveSave

SaveSave

SaveSave

SaveSave

SaveSave

SaveSave

SaveSave

SaveSave

SaveSave

Sticky situations: big and small animals with sticky feet

Travis in the lab measuring the stickiness of a gecko’s toe.

Travis in the lab measuring the stickiness of a gecko’s toe.

The activities are as follows:

Species are able to do so many amazing things, from birds soaring in the air, lizards hanging upside-down from ceilings, and trees growing hundreds of feet tall. The study of biomechanics looks at living things from an engineering point of view to study these amazing abilities and discover why species come in such a huge variety of shapes and sizes. Biomechanics can improve our understanding of how plants and animals have adapted to their environments. We can also take what we learn from biology and apply it to our own inventions in a process called biomimicry. Using this approach, scientists have built robotic jellyfish to survey the oceans, walking robots to help transport goods, and fabrics that repel stains like water rolling off a lotus leaf.

Travis studies biomechanics and is interested in the ability of some species to climb and stick to walls. Sticky, or adhesive, toe pads have evolved in many different kinds of animals, including insects, arachnids, reptiles, amphibians, and mammals. Some animals, like frogs, bats, and bugs use suction cups to hold up their weight. Others, like geckos, beetles, and spiders have toe pads covered in tiny, branched hairs. These hairs actually adhere to the wall! Electrons in the molecules that make up the hairs interact with electrons in the molecules of the surface they’re climbing on, creating a weak and temporary attraction between the hairs and the surface. These weak attractions are called van der Waals forces.

Travis catching lizards in the Dominican Republic.

Travis catching lizards in the Dominican Republic.

The heavier the animal, the more adhesion they will need to stick and support their mass. With a larger toe surface area, more hairs can come in contact with the climbing surface, or the bigger the suction cup can be. For tiny species like mites and flies, tiny toes can do the job. Each fly toe only has to be able to support a small amount of weight. But when looking at larger animals like geckos, their increased weight means they need much larger toe pads to support them.

When comparing large and small objects, the mass of large objects grows much faster then their surface area does. As a result, larger species have to support more mass per amount of toe area and likely need to have non-proportionally larger toes than those needed by lighter species. This results in geckos having some crazy looking feet! This relationship between mass and surface area led Travis to hypothesize that larger species have evolved non-proportionally larger toe pads, which would allow them to support their weight and stick to surfaces.

To investigate this idea, Travis looked at the data published in a paper by David Labonte and fellow scientists. In their paper they measured toe pad surface area and mass of individual animals from 17 orders (225 species) including insects, arachnids, reptiles, amphibians, and mammals. From their data, Travis calculated the average toe pad area and mass for each order.

Travis then plotted each order’s mass and toe pad area on logarithmic axes so it is easier to compare very small and very large values. Unlike a standard axis where the amount represented between tick marks is always the same, on logarithmic axes each tick mark increases by 10 times the previous value. For example, if the first tick represents 1.0, the second tick will be 10, and the next 100. As an example, look at the graphs below.

gecko-graph

The left plot shows hypothetical gecko species of different sizes, but with proportional toes. Their mass per toe pad area ratio (g/mm2) varies, with larger species having larger g/mm2 ratios. In this case, larger species have to support more mass per toe pad area. In the right plot, larger gecko species have disproportionally larger toes. These differences change each species’ mass per toe pad area ratios, so that all species, regardless of their size, have the same mass per toe pad area ratio.

Featured scientists: David Labonte, Christofer J. Clemente, Alex Dittrich, Chi-Yun Kuo, Alfred J. Crosby, Duncan J. Irschick, and Walter Federle. Written by: Travis Hagey

Data Nugget Flesch–Kincaid Reading Grade Level = 10.3

Scaling Up – Math Activity Flesch–Kincaid Reading Grade Level = 9.5

There is a scientific paper associated with the data in this Data Nugget. The data was used with permission from D. Labonte.

Labonte, D., Clemente, C.J., Dittrich, A., Kuo, C.Y., Crosby, A.J., Irschick, D.J. and Federle, W., 2016. Extreme positive allometry of animal adhesive pads and the size limits of adhesion-based climbing. Proceedings of the National Academy of Sciences, p.201519459.

To learn more about Travis and his research on geckos, read this blog post, “An evolving sticky situation” and check out the video below!

poster
Sticky situations video
00:00
--
/
--

For a video and article on using “gecko power” to scale a building, check out this article – Climbing a Glass Building? Try a Gecko’s Sticky Pads


dr-fowleriAbout Travis: Ever since Travis was a kid, he was interested in animals and wanted to be a paleontologist. He even had many dinosaur names memorized to back it up! In college he discovered evolutionary biology, which drove him to apply for graduate school and become a scientist. There, he fell in love with comparative biomechanics, which combines evolutionary biology and mechanical engineering. Today Travis studies geckos and their sticky toes that allow them to scale surfaces like glass windows and tree branches.

SaveSave

SaveSave

SaveSave

SaveSave

SaveSave

SaveSave

Are you my species?

Michael holding a male darter. The bright color patterns differ for each of the over 200 species. Photo by Tamra Mendelson.

Michael holding a male darter. The bright color patterns differ for each of the over 200 species. Photo by Tamra Mendelson.

The activities are as follows:

What is a species? The biological species concept says species are groups of organisms that can mate with each other but do not reproduce with members of other similar groups. How then do animals know who to choose as a mate and who is a member of their own species? Communication plays an important role. Animals collect information about each other and the rest of the world using multiple senses, including sight, sound, sonar, and smell. These signals may be used to figure out who would make a good mate and who is a member of the same species.

Michael snorkeling, looking for darters.

Michael snorkeling, looking for darters.

Michael is a scientist interested in studying how individuals communicate within and across the boundaries of species. He studies darters, a group of over 200 small fish species that live on the bottom of streams, rivers, and lakes. Michael first chose to study darters because he was fascinated by the bright color patterns the males have on their bellies during the breeding season. Female darters get to select which males to mate with and the males fight with each other for access to the females during the mating season. Species identification is very important during this time. Females want to make sure they choose a member of their own species to mate with. Males want to make sure they only spend energy fighting off males of their own species who are competing for the same females. What information do females and males use to guide their behavior and how do they know which individuals are from their own species?

Across all darter species, there is a huge diversity of color patterns. Because only males are brightly colored and there is such a diversity of colors and patterns, Michael wondered if males use the color patterns to communicate species identity during mating. Some darter species have color patterns that are very similar to those of other darter species. Perhaps, Michael thought, the boundaries of species are not as clear as described by the biological species concept. Some darter species may be able to hybridize, or mate with members of a different species if their color patterns are very close. Thus, before collecting any data, Michael predicted that the more similar the color patterns between two males, the more likely they would be to hybridize and act aggressively towards each other. If this is the case, it would serve as evidence that color pattern may indeed serve as a signal to communicate darter species identity.

Michael (right) in the field, collecting darters. Photo by Tamra Mendelson.

Michael (right) in the field, collecting darters. Photo by Tamra Mendelson.

Michael collected eight pairs of darter species (16 species in all) from Alabama, Mississippi, Tennessee, Kentucky, South Carolina, and North Carolina and brought them all back to the lab. In some species pairs the color patterns were very similar, and in some they were very different. For each species pair, he put five males of both species and five females of both species in the same fish tank and observed their behavior for five hours. He did this eight times, once for each species pair (for a total of 1,280 fish!). During the five-hour observation period, he recorded (1) how many times females mated with males of their own species or of a different species and (2) how many times males were aggressive towards males of their own species or of a different species. He used these data to calculate an index of bias for each behavior, to show whether individuals had stronger reactions towards members of their own species.

Featured scientist: Michael Martin from the University of Maryland, Baltimore County

Flesch–Kincaid Reading Grade Level = 10.9

Videos showing darter behavior:

Darter species used in the experiment:

darters

SaveSave

SaveSave

SaveSave

SaveSave

SaveSave

SaveSave

When a species can’t stand the heat

An adult male tuatara. Photo by Scott Jarvie.

An adult male tuatara. Photo by Scott Jarvie.

The activities are as follows:

Tuatara are a unique species of reptile found only in New Zealand. Tuatara look like lizards but they are actually in their own reptile group. Tuatara are the only species remaining on the planet from this lineage, one that dates to the time of the dinosaurs! Tuatara are similar to tortoises in that they are extremely long-lived and can sometimes live over 100 years. Tuatara start reproducing when they are about 15–20 years old and they breed infrequently.

North Brother Island, one of the small New Zealand islands where tuatara are still found today.

North Brother Island, one of the small New Zealand islands where tuatara are still found today. Photo by Jo Monks.

The sex of tuatara is not determined by sex chromosomes (X or Y) as in humans. Instead, the temperature of the nest during egg development is the only factor that determines the sex of tuatara embryos. If the egg develops with a low temperature in the nest it will be female, but if it develops with a high temperature it will be male. This process happens in many other species, too, including some turtles, crocodiles, lizards, and fish. However, most species are the opposite of tuatara and produce females at the warmest temperatures.

Today, tuatara face many challenges. Humans introduced new predators to the large North and South Islands of New Zealand. Tuatara used to live on these main islands, but predators drove the island populations to extinction. Today, the tuatara survive only on smaller offshore islands where they can escape predation. Because many of these islands are small, tuatara can have low population numbers that are very vulnerable to a variety of risk factors. One of the current challenges faced by these populations is climate change. Similar to the rest of the world, New Zealand is experiencing higher and higher temperatures as a result of climate change, and the warm temperatures may impact tuatara reproduction.

Kristine collecting data on a tuatara in the field.

Kristine collecting data on a tuatara in the field. Photo by Sue Keall.

North Brother Island has a small population of tuatara (350–500 individuals) that has been studied for decades. Every single tuatara has been marked with a microchip (like the ones used on pet dogs and cats), which allows scientists to identify and measure the same individuals repeatedly across several years. In the 1990s, a group of scientists studying the tuatara on this island noticed that there were more males than females (60% males). The scientists started collecting data on the number of males and females so they could track whether the sex ratio, or the ratio of males and females in the population, became more balanced or became even more male-biased over time. The sex ratio is important because when there are fewer females in a population, there are fewer individuals that lay eggs and produce future offspring. Generally, a population that is highly male-biased will have lower reproduction rates than a population that is more balanced or is female-biased.

The fact that tuatara are long-lived and breed infrequently meant that the scientists needed to follow the sex ratio for many years to be sure they were capturing a true shift in the sexes over time, not just a short-term variation. In 2012, Kristine and her colleagues decided to use these long-term data to see if the increasing temperatures from climate change were associated with the changing sex ratio. They predicted that there would be a greater proportion of males in the population over time. This would be reflected in an unbalanced sex ratio that is moving further and further away from 50% males and 50% females and toward a male-biased population.

Featured scientists: Kristine Grayson from University of Richmond, Nicola Mitchell from University of Western Australia, and Nicola Nelson from Victoria University of Wellington

Flesch–Kincaid Reading Grade Level = 11.9

Additional teacher resources related to this Data Nugget:


kgAbout Kristine: Kristine L. Grayson is an Associate Professor in the Biology Department at University of Richmond, where she teaches Intro Ecology/Evolution, Field Ecology, Ecophysiology, and Data Visualization. She is an HHMI BioInteractive Ambassador and facilitator with the Quantitative Undergraduate Biology Education and Synthesis (QUBES) project, where you can find additional teaching resources she has authored. Kristine runs an undergraduate research lab studying invasive insects, salamanders, and aquatic macroinvertebrates. Her work on tuatara was conducted during a postdoc at Victoria University of Wellington funded by an NSF International Research Fellowship. One of her claims to fame is capturing the state record holding snapping turtle for North Carolina – 52 pounds! To read more about Kristine and her interest in science from a young age, check out this article.

SaveSave

SaveSave

SaveSave

SaveSave

SaveSave

SaveSave

SaveSave

SaveSave

SaveSave

Finding Mr. Right

Mountain chickadee, photo by Vladimir Pravosudov

Mountain chickadee, photo by Vladimir Pravosudov

The activities are as follows:

Depending on where they live, animals can face a variety of challenges from the environment. For example, animal species that live in cold environments may have adaptive traits that help them survive and reproduce under those conditions, such as thick fur or a layer of blubber. Animals may also have adaptive behaviors that help them deal with the environment, such as storing food for periods when it is scarce or hibernating during times of the year when living conditions are most unfavorable. These adaptations are usually consistently seen in all individuals within a species. However, sometimes populations of the same species may be exposed to different conditions depending on where they live. The idea that populations of the same species have evolved as a result of certain aspects of their environment is called local adaptation.

Mountain chickadees are small birds that live in the mountains of western North America. These birds do not migrate to warmer locations like many other bird species; they remain in the same location all year long. To deal with living in a harsh environment during the winter, mountain chickadees store large amounts of food throughout the forest during the summer and fall. They eat this food in the winter when very little fresh food is available. There are some populations of the species that live near the tops of mountains, and some that live at lower elevations. Birds at higher elevations experience harsher winter conditions (lower temperature, more snow) compared to birds living at lower elevations. This means that birds higher in the mountains depend more on their stored food to survive winter.

Carrie conducting field research in winter, photo by Vladimir Pravosudov

Carrie conducting field research in winter, photo by Vladimir Pravosudov

Carrie studies mountain chickadees in California. Based on previous research that was done in the lab she works in, she learned these birds have excellent spatial memory, or the ability to recall locations or navigate back to a particular place. This type of memory makes it easier for the mountain chickadees to find the food they stored. Carrie’s lab colleagues previously found that populations of birds from high elevations have much better spatial memory compared to low-elevation birds. Mountain chickadees also display aggressive behaviors and fight to defend resources including territories, food, or mates. Previous work that Carrie and her lab mate conducted found that male birds from low elevations are socially dominant over male birds from high elevations, meaning they are more likely to win in a fight over resources. Taken together, these studies suggest that birds from high elevations would likely do poorly at low elevations due to their lower dominance status, but low-elevation birds would likely do poorly at high elevations with harsher winter conditions due to their inferior memory for finding stored food items. These populations of birds are likely locally adapted – individuals from either population would likely be more successful in their own environments compared to the other.

In this species, females choose which males they will mate with. Males from the same elevation as the females may be best adapted to the location where the female lives. This means that when the female lays her eggs, her offspring will likely inherit traits that are well suited for that environment. If she mates with males that match her environment, she is setting up her offspring to be more successful and have higher survival where they will live. Carrie wondered if female mountain chickadees prefer to mate with males that are from the same elevation and therefor contribute to local adaptation by passing the adaptive behaviors on to the offspring. This process could contribute to the populations becoming more and more distinct. Offspring born in the high mountains will continue to inherit genes for good spatial memory, and those born at low elevations will inherit genes that allow them to be socially dominant.

Mountain chickadee, photo by Vladimir Pravosudov

Mountain chickadee, photo by Vladimir Pravosudov

To test whether female mountain chickadees contribute to local adaptation by choosing and mating with males from their own elevation, Carrie brought high- and low-elevation males and females into the lab. Carrie made sure that the conditions in the lab were similar to the light conditions in the spring when the birds mate (14 hours of light, 10 hours of dark). Once a female was ready, she was given time to spend with both males in a cage that is called a two-choice testing chamber. On one side of the testing chamber was a male from a low-elevation population, and on the other side was a male from a high-elevation population. Each female could fly between the two sides of the testing chamber, allowing her to “choose” which male she preferred to spend time close to (measured in seconds [s]). There was a cardboard divider in the middle of the cage with a small hole cut into it. This allowed the female to sit on the middle of the cardboard, which was not counted as preference for either male. Females from both high- and low-elevation populations were tested in the same way. The female bird’s preference was determined by comparing the amount of time the female spent on either side of the cage. The more time a female spent on the side of the cage near one male, the stronger her preference for that male.

Watch a video of one of the experimental trials:

Featured scientist: Carrie Branch from University of Nevada Reno

Flesch–Kincaid Reading Grade Level = 11.5

Additional teacher resources related to this Data Nugget include:


carrie-branchAbout Carrie: I have been interested in animal behavior and behavioral ecology since my second year in college at the University of Tennessee. I am primarily interested in how variation in ecology and environment affect communication and signaling in birds. I have also studied various types of memory and am interested in how animals learn and use information depending on how their environment varies over space and time. I am currently working on my PhD in Ecology, Evolution, and Conservation Biology at the University of Nevada Reno and once I finish I hope to become a professor at a university so that I can continue to conduct research and teach students about animal behavior. In my spare time I love hiking with my friends and dogs, and watching comedies!

SaveSave

SaveSave

SaveSave

SaveSaveSaveSave

Why so blue? The determinants of color pattern in killifish, Part II

In Part 1, you examined the effects of genetics and environment on anal fin color in male bluefin killifish. The data from Becky’s experiment showed that both genetics and environment work together to determine whether male offspring had blue, yellow, or red anal fins. You will now examine how the father’s genetics, specifically their fin color pattern, affects anal fin color in their sons. When we factor in the genetics of the father, and not just the population he came from, does this influence our interpretation of the data?

The color polymorphism in bluefin killifish – males display anal fins in blue, red, or yellow.

The activities are as follows:

For her experiment, Becky collected male and female fish from both a swamp (26 Mile Bend) and a spring (Wakulla) population. Most of the males in the swamp have blue anal fins, but some have red or yellow. Most of the males from the spring have red or yellow anal fins, but some have blue. Becky decided to add data about the father’s fin color pattern into her existing analysis from Part 1 to see how it affected her interpretation of the results.

In Part 1, Becky was looking at the genetics from the population level. Looking at the data this way, we saw parents from the 26 Mile Bend swamp population were more likely to have sons with blue anal fins than parents from the Wakulla spring. Parents from the 26 Mile Bend were also much more likely to have sons with higher levels of plasticity, meaning they responded more to the environment they were raised in. This means there was a big difference between the proportion sons with blue anal fins in the clear and brown water treatments.

Bringing in the color pattern of the fathers now allows Becky to look at the genetics from both the population and the individual level. From both the swamp and spring population, Becky collected males of all colors. Becky measured the color pattern of the fathers and recorded the color of their anal fins and the rear part of their dorsal fins. She used males that were red on the rear portion of the dorsal fin with a blue anal fin (rb), males that were red on both fins (rr), males that were yellow on both fins (yy), and males that were yellow on the rear portion of the dorsal fin with blue a blue anal fin (yb).

colormorph

She randomly assigned each father’s sons into one of the water treatments, either clear or brown water. Once the sons developed their fin colors, she recorded the anal fin color. This experimental design allowed her to test whether sons responded differently to the treatment depending on the genetics of their father. She thought that the anal fin color of the sons would be inherited genetically from the father, but would also respond plastically to the environment they were raised in. She predicted fathers with blue anal fins would be more likely to have sons with blue anal fins, especially if they were raised in the brown water treatment. She also predicted that fathers with red and yellow anal fins could have sons with blue anal fins if they were raised in the brown water treatment, but not as many as the blue fathers.

Featured scientist: Becky Fuller from The University of Illinois

Flesch–Kincaid Reading Grade Level = 10.9


About Becky: I consider myself to be an evolutionary biologist who studies fishes. I grew up in a small town riding horses in 4-H and working in a veterinary clinic. As an undergraduate at the University of Nebraska at Lincoln, I was interested in biology and considering either medical or veterinary school. Two things led to me research in ecology and evolution. In the summer of 1991, I was taking courses at Cedar Point Biological Field Station which was run by the University of Nebraska. I met Dr. Anthony Joern (Tony) who was studying grasshopper community ecology. Tony hired me onto his field crew that summer after the courses were finished. I went on to do an undergraduate thesis under Tony’s mentorship where I studied predation on grasshoppers. I caught the “science bug” and never looked back. Following my undergraduate work, I went to Uppsala University in Sweden on a Fulbright Scholarship. Here, I developed my love for fish and aquatics. I worked with Dr. Anders Berglund on pipefish in a fjord on the west coast of Sweden. Since then, I have had many wonderful advisers, instructors, mentors, and collaborators who have helped me develop skills along the numerous fronts required for a successful career in science. I consider myself very fortunate to have a job where I can do science and teach young, enthusiastic undergraduates.

Why so blue? The determinants of color pattern in killifish, Part I

The color polymorphism in bluefin killifish – males display anal fins in blue, red, or yellow.

The activities are as follows:

In nature, animals can be found in a dazzling display of different colors and patterns. Color patterns serve as signals to members of the animal’s own species, or to other species. They can be used to attract mates, camouflage with the environment, or warn predators to stay away. When looking at the diversity of colors found in nature, you may wonder, why do animals have the color patterns they do? One way to study this question is to look at a single species that has individuals of different colors. This variation can be used to uncover the mechanisms that determine color.

The bluefin killifish is a freshwater species that is found mostly in Florida. They are found in two main habitats, springs and swamps. An intriguing aspect of this species is that male bluefin killifish are brightly colored with many different color patterns. The brightest part of the fish is the anal fin, which is found on the bottom of the fish by the tail. Some males have red anal fins, some have yellow anal fins, and others have blue anal fins. This variation in color is called a polymorphism, meaning that in a species there are multiple forms of a single trait. In a single spring or swamp you may see all three colors!

Becky in the field, with her colleague Katy, collecting fish in 26 Mile Bend Swamp.

Becky in the field, with her colleague Katy, collecting fish in 26 Mile Bend Swamp.

Becky is a biologist studying bluefin killifish. One day, while out snorkeling for her research, she noticed an interesting pattern. She observed that there were differences in the polymorphism depending on whether she was in a spring or swamp. Springs have crystal clear water that can appear blue-tinted. Becky noticed that most of the males in springs had either red or yellow anal fins. Swamps have brown water, the color of iced tea, due to the dissolved plant materials in the water. Becky noticed that most of the males in swamps had blue anal fins. After noticing this pattern she wanted to find out why this variation in color existed. Becky came up with two possible explanations. She thought males in swamps might be more likely to be blue (1) because of the genes they inherit from their parents, or (2) because individual color is responding to environmental conditions. This second case, where the expression of a trait is directly influenced by the environment that an individual experiences, is known as phenotypic plasticity.

Becky had to design an experiment that could tease apart whether genes, plasticity, or both were responsible for male anal fin color. She did this by collecting male and female fish from the two habitat types, breeding them, and raising their offspring in clear or brown water. If a father’s genes are responsible for anal fin color in their sons, then fathers from swamps would be more likely to leave behind blue sons. If environmental conditions determine the color of sons, then sons raised in brown water will be blue, regardless of the population origin of their father.

Becky’s family helping her out in the field!

Becky’s family helping her out in the field!

Becky and her colleagues collected fish from two populations in the wild – Wakulla Spring, and 26 Mile Bend Swamp – and brought them into the lab. These two populations represent the genetic stocks for the experiment. Fish from Wakulla are more closely related to each other than they are to fish from 26 Mile Bend. In the lab, they mated female fish with male fish from the same population: females from Wakulla mated with males from Wakulla, and females from 26 MB mated with males from 26 MB. The female fish then laid eggs, and after the offspring hatched from their eggs, half were put into tanks with clear water (which mimics spring conditions) and half in tanks with brown water (which mimics swamp conditions). For the brown water treatment, Becky colored the water using ‘Instant, De-caffeinated, No-Sugar, No-Lemon’ tea. They raised the fish to adulthood (3-6 months) so they could determine their sex and the color of the son’s anal fins. Becky then counted the total number of male offspring, and the number of male offspring that had blue anal fins. She used these numbers to calculate the proportion of sons that had blue anal fins in each treatment.

Featured scientist: Becky Fuller from The University of Illinois

Flesch–Kincaid Reading Grade Level = 9.4

To introduce students to bluefin killifish, there is a video showing the blue and red color morphs. Video can be shown on mute (background music is a little corny)!


About Becky: I consider myself to be an evolutionary biologist who studies fishes. I grew up in a small town riding horses in 4-H and working in a veterinary clinic. As an undergraduate at the University of Nebraska at Lincoln, I was interested in biology and considering either medical or veterinary school. Two things led to me research in ecology and evolution. In the summer of 1991, I was taking courses at Cedar Point Biological Field Station which was run by the University of Nebraska. I met Dr. Anthony Joern (Tony) who was studying grasshopper community ecology. Tony hired me onto his field crew that summer after the courses were finished. I went on to do an undergraduate thesis under Tony’s mentorship where I studied predation on grasshoppers. I caught the “science bug” and never looked back. Following my undergraduate work, I went to Uppsala University in Sweden on a Fulbright Scholarship. Here, I developed my love for fish and aquatics. I worked with Dr. Anders Berglund on pipefish in a fjord on the west coast of Sweden. Since then, I have had many wonderful advisers, instructors, mentors, and collaborators who have helped me develop skills along the numerous fronts required for a successful career in science. I consider myself very fortunate to have a job where I can do science and teach young, enthusiastic undergraduates.

SaveSave

SaveSave