The activities are as follows:
- Teacher Guide
- Student activity, Graph Type A, Level 2
- Student activity, Graph Type B, Level 2
- Student activity, Graph Type C, Level 2
- Grading Rubric
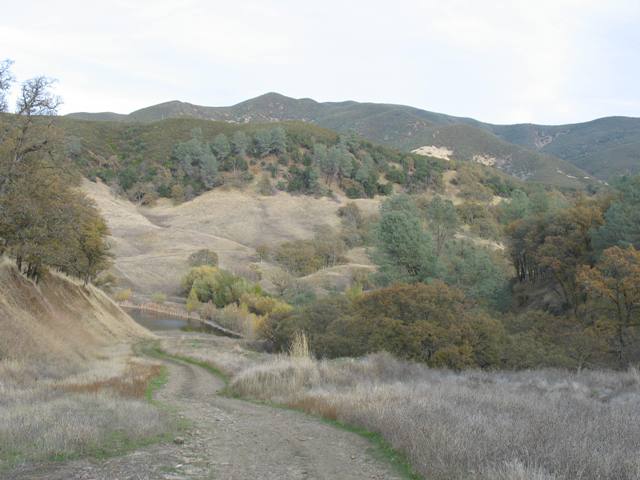
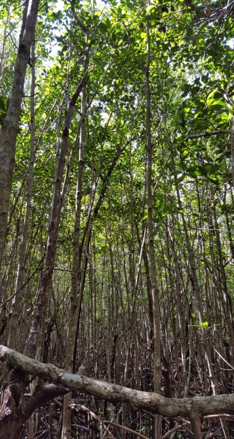
In the tropics and subtropics, mangroves dominate the coast. There are many different species of mangroves, but they are all share a unique characteristic compared to other trees – they can tolerate having their roots submerged in salt water.
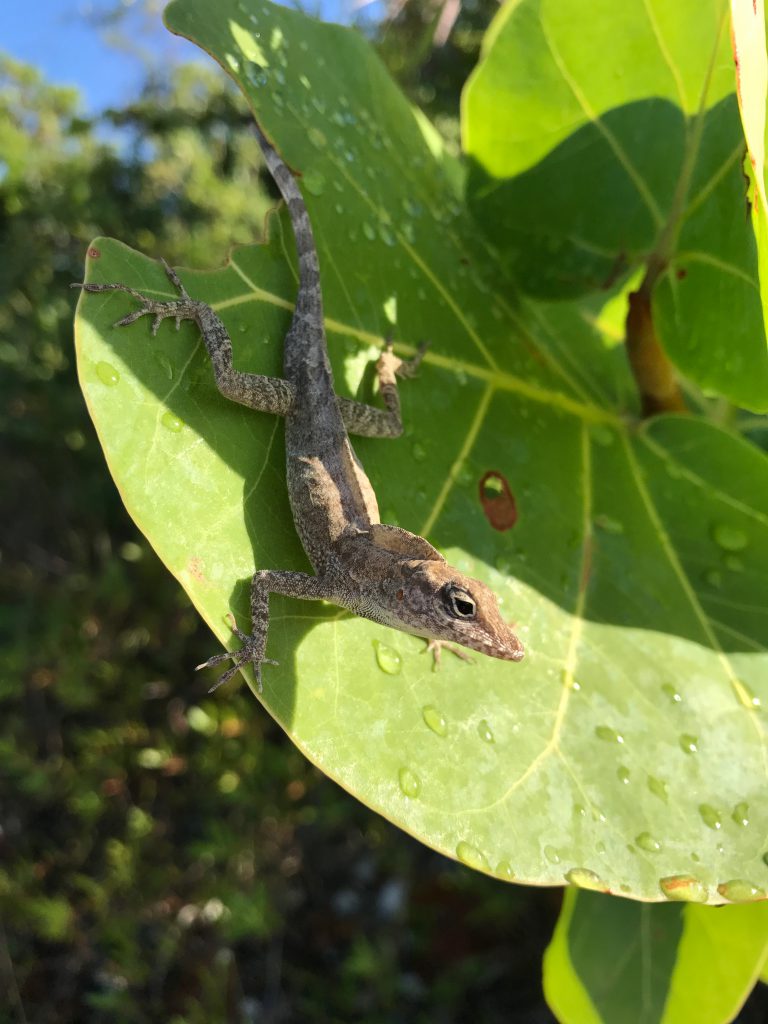
Mangroves are globally important for many reasons. They form dense forested wetlands that protect the coast from erosion and provide critical habitat for many animals. Mangrove forests also help in the fight against climate change. Carbon dioxide is a greenhouse gas that is a main driver of climate change. During photosynthesis, carbon dioxide is absorbed from the atmosphere by the plants in a mangrove forest. When plants die in mangrove forests, decomposition is very slow. The soils are saturated with saltwater and have very little oxygen, which decomposers need to break down plants. Because of this, carbon is stored in the soils for a long time, keeping it out of the atmosphere.
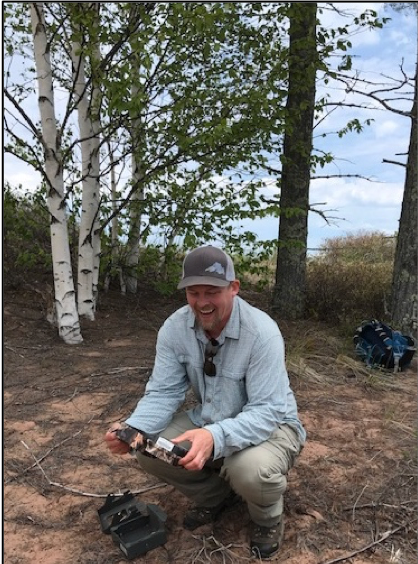
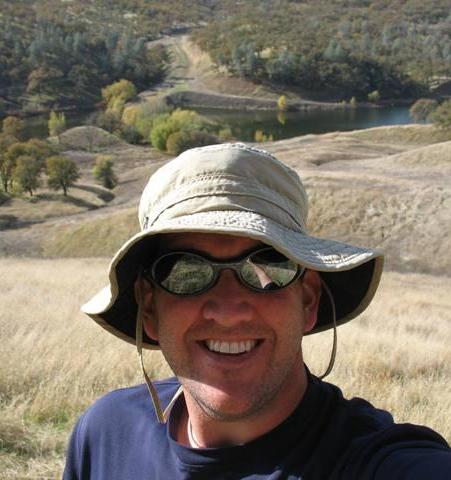
Sean is a scientist studying coastal mangroves in the Florida Everglades. Doing research in the Everglades was a dream opportunity for Sean. He had long been fascinated by the unique plant and animal life in the largest subtropical wetland ecosystem in North America. Mangroves are especially exciting to Sean because they combine marine biology and trees, two of his favorite things! Sean had previously studied freshwater forested wetlands in Virginia, but had always wanted to spend time studying the salty mangrove forests that exist in the Everglades.
Sean arrived in the Everglades with the goal to learn more about the factors important for mangrove forests’ ability to hold carbon in their soils. Upon his arrival, he noticed a very interesting pattern – the trees were much taller along the coast compared to inland. This is because mangroves that grow close to the coast have access to important nutrients found in ocean waters, like phosphorus. These nutrients allow the trees to grow large and fast. However, living closer to the coast also puts trees at a higher risk of damage from storms, and can lead to soils and dead plants being swept out to sea.
Sean thought that the combination of these two conditions would influence how much carbon is stored in mangrove soils along the coast and inland. Larger trees are generally more productive than smaller ones, meaning they might contribute more plant material to soils. This led Sean to two possible predictions. The first was that there might be more carbon in soils along the coast because taller mangroves would add more carbon to the soil compared to shorter inland mangroves. However, Sean thought he might also find the opposite pattern because the mangroves along the coast have more disturbance from storms that could release carbon from the soils.
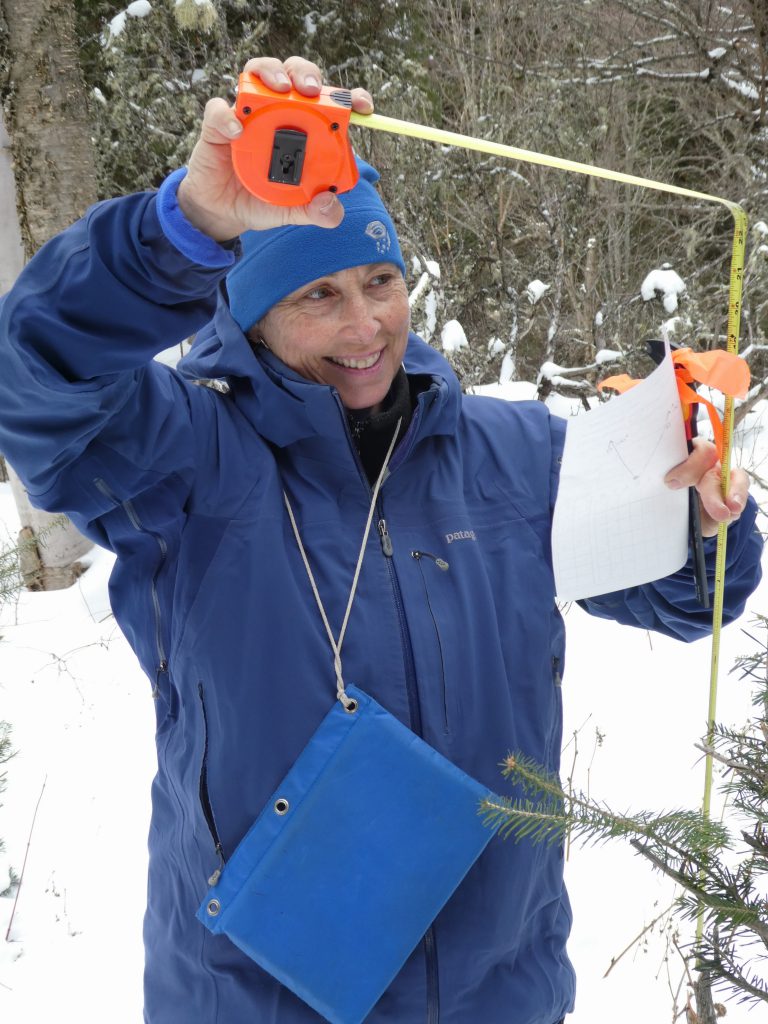
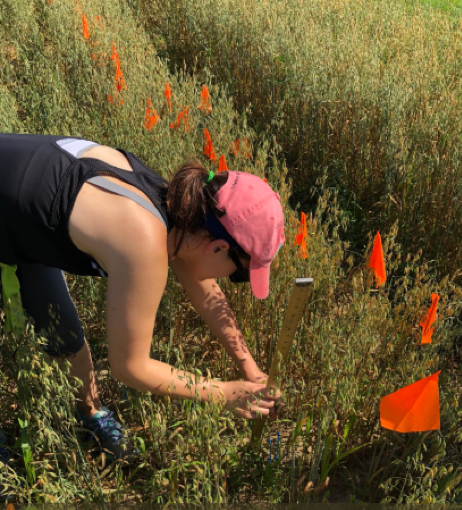
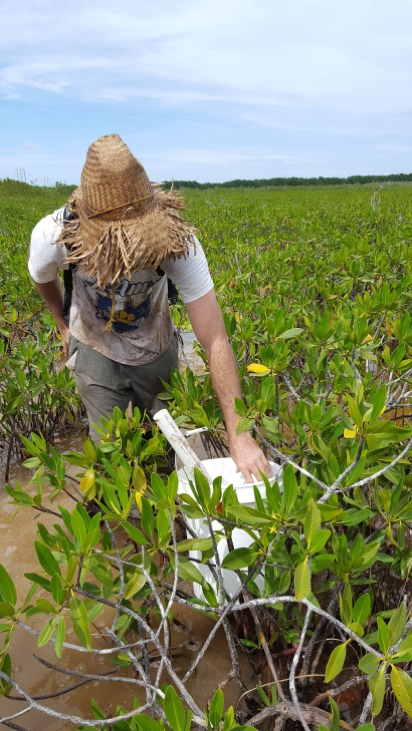
To test these competing hypothesis, the team of scientists set out into the Everglades in the Biscayne National Park in Homestead, Florida. Their mission was to collect surface soils and measure mangrove tree height. To collect soils, they used soil cores, which are modified cylinders that can be hammered into the soil and then removed with the soil stuck in the tube. Tree height was measured using a clinometer, which is a tool that uses geometry to estimate tree height. They took these measurements along three transects. The first transect was along the coast where trees had an average height of 20 meters. The second transect between the coast and inland wetlands where trees were 10 meters tall, on average. The final transect was inland, with average tree height of only 1 meter tall. With this experimental design Sean could compare transects at three distances from the coast to look for trends.
Once Sean was back in the lab, he quantified how much carbon was in the soil samples from each transect by heating the soil in a furnace at 500 degrees Celsius. Heating soils to this temperature causes all organic matter, which has carbon, to combust. Sean measured the weight of the samples before and after the combustion. The difference in weight can be used to calculate how much organic material combusted during the process, which can be used as an estimate of the carbon that was stored in the soil.
Featured scientist: Sean Charles from Florida International University
Flesch–Kincaid Reading Grade Level = 9.6
Additional teacher resources related to this Data Nugget:
- Florida International University News: Hurricanes fertilize mangrove forests, shape coastal landscape of the Florida Everglades