The activities are as follows:
- Teacher Guide
- Student activity, Graph Type A, Level 2
- Student activity, Graph Type B, Level 2
- Student activity, Graph Type C, Level 2
- PowerPoint of Images
- Grading Rubric
- Digital Data Nugget on DataClassroom
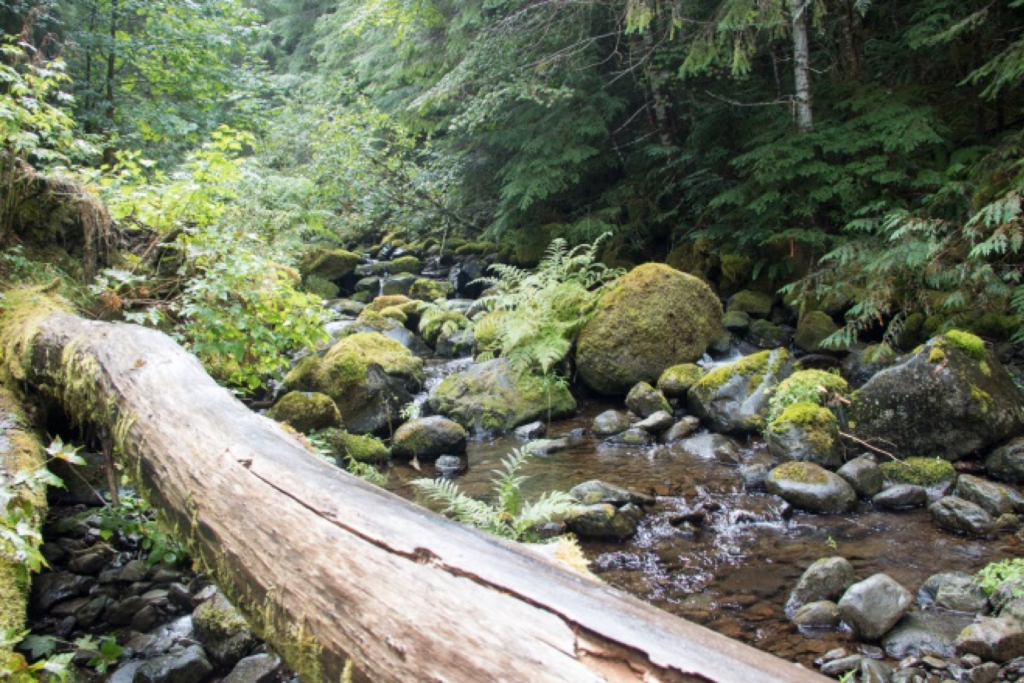
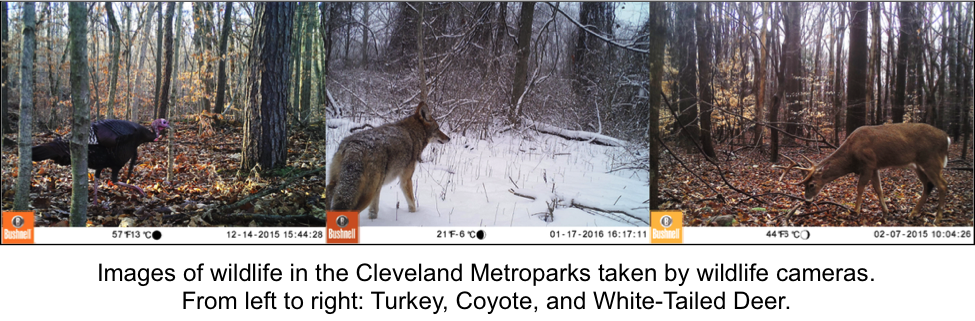
Streams are tough places to live. Fish living in streams have to survive droughts, floods, debris flows, falling trees, and cold and warm temperatures. In Oregon, cutthroat trout make streams their home. Cutthroat trout are sensitive to disturbances in the stream, such as pollution and sediment. This means that when trout are present it is a good sign that the stream is healthy.
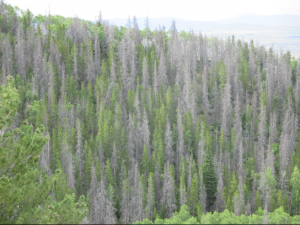
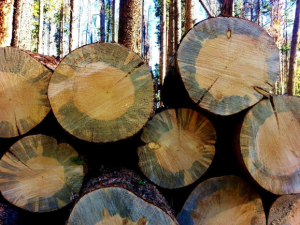
Floods are very common disturbances in streams. During floods, water in the stream flows very fast. This extra movement picks up sediment from the bottom of the stream and suspends it in the water. When sediment is floating in the water it makes it harder for fish to see and breathe, limiting how much food they can find. Floods may also affect fish reproduction. If floods happen right after fish breed and eggs hatch, young fish that cannot swim strongly may not survive. Although floods can be dangerous for fish, they are also very important for creating new habitat. Floods expand the stream, making it wider and adding more space. Moving water also adds large boulders, small rocks, and logs into the stream. These items add to the different types of habitat available.
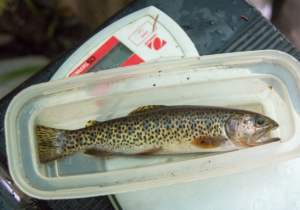
Ivan and Stan are two scientists who are interested in whether floods have a large impact on the survival of young cutthroat trout. They were worried because cutthroat trout reproduce during the spring, towards the end of the winter flood season. During this time juvenile trout,less than one year old, are not good swimmers. The fast water from floods makes it harder for them to survive. After a year, juvenile trout become mature adults.These two age groups live in different habitats. Adult trout live in pools near the center of streams. Juvenile trout prefer habitats at the edges of streams that have things like rocks and logs where they can hide from predators. Also, water at the edges moves more slowly, making it easier to swim. In addition, by staying near the stream edge they can avoid getting eaten by the adults in stream pools.
Ivan and Stan work at the H.J. Andrews Long Term Ecological Research site. They wanted to know what happens to cutthroat trout after winter floods. Major floods occur every 35-50 years, meaning that Ivan and Stan would need a lot of data. Fortunately for their research they were able to find what they needed since scientists have been collecting data at the site since 1987!
To study how floods affect trout populations, Ivan and Stan used data from Mack Creek, one of the streams within their site. They decided to look at the population size of both juvenile and adult trout since they occupy such different parts of the stream. For each year of data they had, Ivan and Stan compared the juvenile and adult trout population data, measured as the number of trout, with stream discharge, or a measure of how fast water is flowing in the stream. Stream discharge is higher after flooding events. Stream discharge data for Mack Creek is collected during the winter when floods are most likely to occur. Fish population size is measured during the following summer each year. Since flooding can make life difficult for trout, they expected trout populations to decrease after major flooding events.
Featured scientists: Ivan Arismendi and Stan Gregory from Oregon State University. Written by: Leilagh Boyle.
Flesch–Kincaid Reading Grade Level = 7.5
Additional teacher resource related to this Data Nugget:
- A slideshow of the images is available for this activity.
- To access more data, and learn more about the H.J. Andrews Long Term Ecological Research site, check out their website.
 About Nora: Nora is currently an undergraduate getting her B.S. in Zoology with a concentration in Zoo and Aquarium as well as a minor in Marine Ecosystem Management from Michigan State University. Although aquatic life is her main interest, she think it’s important to appreciate other animal groups and take a break to play and explore the nature around you. That curiosity was how she was able to volunteer in labs on campus from entomology to genetics, and how she came to spend a summer at the Kellogg Biological Station in Michigan.

 About Kristine: Kristine L. Grayson is an Associate Professor in the Biology Department at University of Richmond, where she teaches Intro Ecology/Evolution, Field Ecology, Ecophysiology, and
