Search Results for: lter

Are forests helping in the fight against climate change?

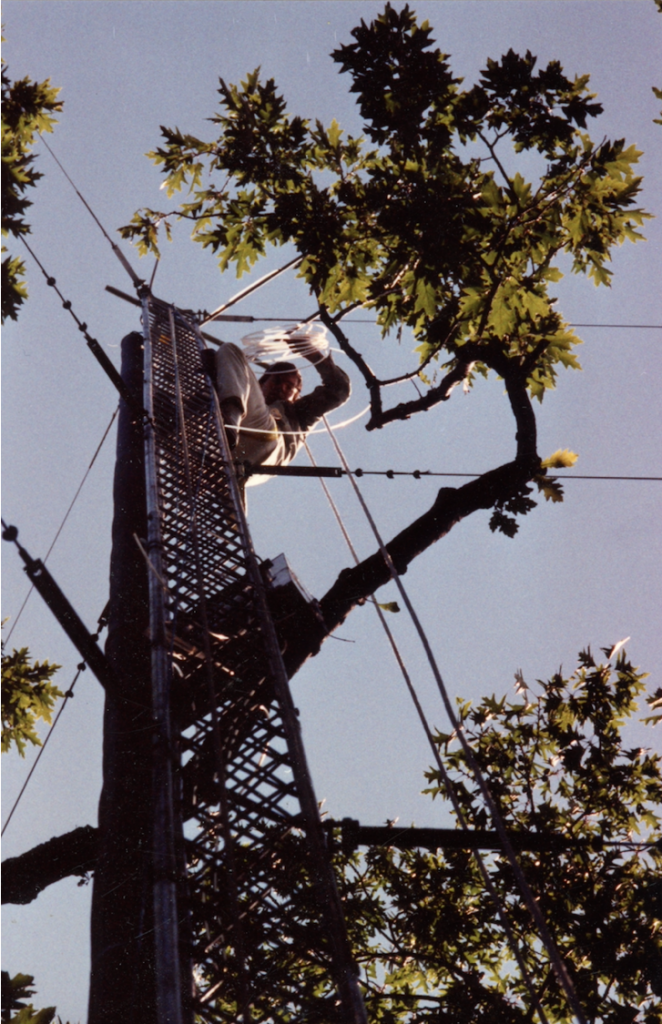
Bill setting up a large metal tower in Harvard Forest in 1989, used to measure long-term CO2 exchange.

The activities are as follows:

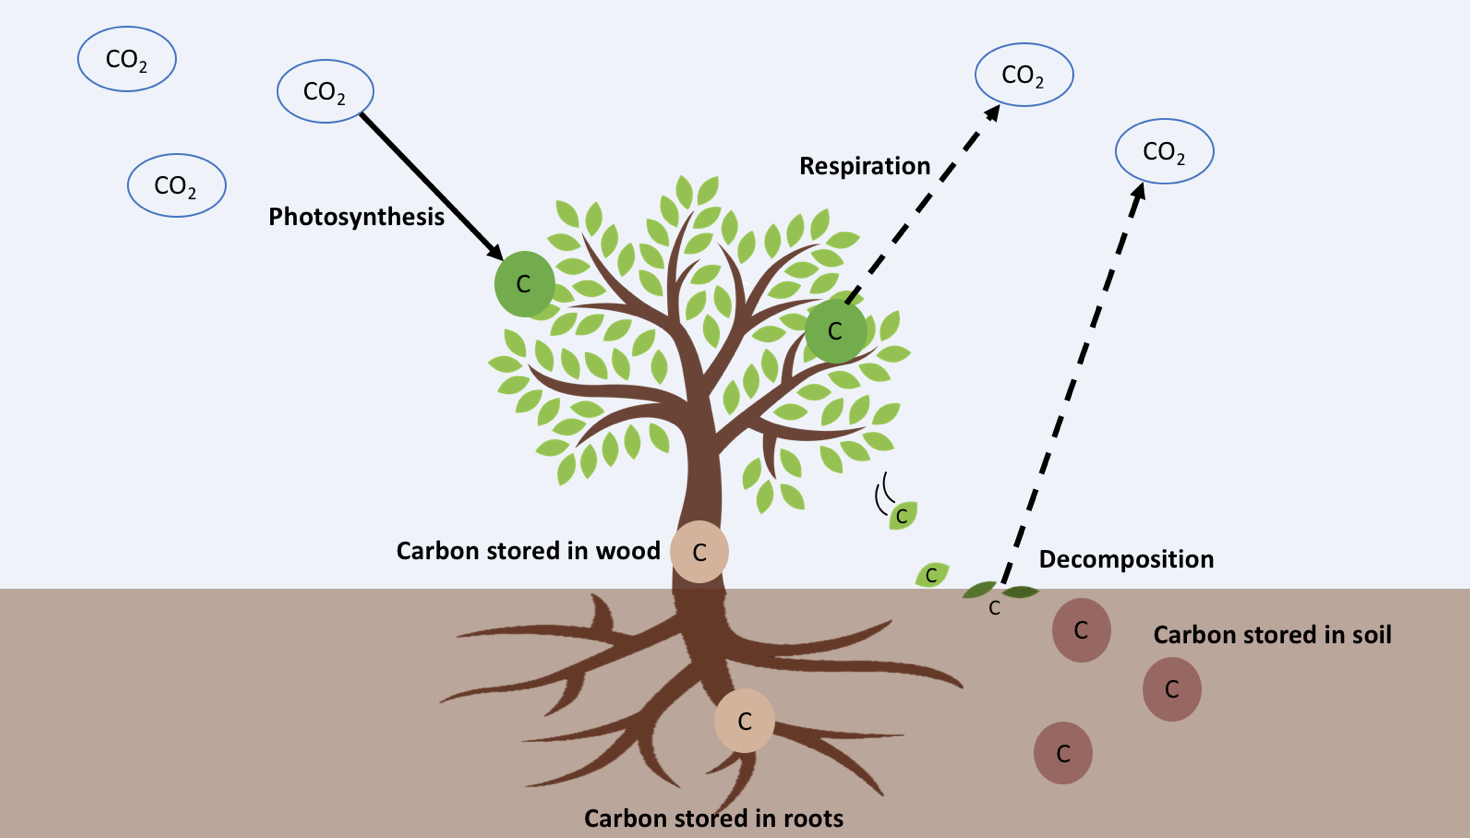
As humans drive cars and use electricity, we release carbon in the form of carbon dioxide (CO2) into the air. Because COhelps to trap heat near the surface of the earth, it is known as a greenhouse gas and contributes to climate change. However, carbon is also an important piece of natural ecosystems, because all living organisms contain carbon. For example, when plants photosynthesize, they take COfrom the air and turn it into other forms of carbon: sugars for food and structural compounds to build their stems, roots, and leaves. When the carbon in a living tree’s trunk, roots, leaves, and branches stays there for a long time, the carbon is kept out of the air. This carbon storage helps reduce the amount of COin the atmosphere. However, not all of the COthat trees take from the air during photosynthesis remains as part of the tree. Some of that carbon returns to the air during a process called respiration.

Another important part of the forest carbon cycle happens when trees drop their leaves and branches or die. The carbon that the tree has stored breaks down in a process called decomposition. Some of the stored carbon returns to the air as CO2, but the rest of the carbon in those dead leaves and branches builds up on the forest floor, slowly becoming soil. Once carbon is stored in soil, it stays there for a long time. We can think of forests as a balancing act between carbon building up in trees and soil, and carbon released to the air by decomposition and respiration. When a forest is building up more carbon than it is releasing, we call that area a carbon sink, because overall more COis “sinking” into the forest and staying there. On the other hand, when more carbon is being released by the forest through decomposition and respiration, that area is a carbon source, because the forest is adding more carbon back into the atmosphere than it is taking in through photosynthesis.

In the 1990s, scientists began to wonder what role forests were having in this exchange of carbon in and out of the atmosphere. Were forests overall storing carbon (carbon sink), or releasing it (carbon source)? Bill is one of the scientists who decided to explore this question. Bill works at the Harvard Forest in central Massachusetts, a Long-Term Ecological Research site that specializes in setting up big experiments to learn how the environment works. Bill and his team of scientists realized they could measure the COcoming into and out of an entire forest. They built large metal towers that stand taller than the forest trees around them and use sensors to measure the speed, direction, and COconcentration of each puff of air that passes by. Bill compares the COin the air coming from the forest to the ones moving down into the forest from the atmosphere. With the COdata from both directions, Bill calculates the Net Ecosystem Exchange (or NEE for short). When more carbon is moving into the forest than out, NEE is a negative number because COis being taken out of the air. This often happens during the summer when trees are getting a lot of light and are therefore photosynthesizing. When more COis leaving the forest, it means that decomposition and respiration are greater than photosynthesis and the NEE is a positive number. This typically happens at night and in the winter, when trees aren’t photosynthesizing but respiration and decomposition still occur. By adding up the NEE of each hour over a whole year, Bill finds the total amount of COthe forest is adding or removing from the atmosphere that year.

Bill and his team were very interested in understanding NEE because of how important it is to the global carbon cycle, and therefore to climate change. They wanted to know which factors might cause the NEE of a forest to vary. Bill and other scientists collected data on carbon entering and leaving Harvard Forest for many years to see if they could find any patterns in NEE over time. By looking at how the NEE changes over time, predictions can be made about the future: are forests taking up more COthan they release? Will they continue to do so under future climate change?

Featured scientist: Bill Munger from Harvard University. Written by: Fiona Jevon.

Flesch–Kincaid Reading Grade Level = 10.5

Additional teacher resource related to this Data Nugget:

  • There are several publications based on the data from the Harvard Forest LTER. Citations below:
    • Wofsy, S.C., Goulden, M.L., Munger, J.W., Fan, S.M., Bakwin, P.S., Daube, B.C., Bassow, S.L. and Bazzaz, F.A., 1993. Net exchange of CO2 in a mid-latitude forest. Science260(5112), pp.1314-1317.
    • Goulden, M.L., Munger, J.W., Fan, S.M., Daube, B.C. and Wofsy, S.C., 1996. Exchange of carbon dioxide by a deciduous forest: response to interannual climate variability. Science271(5255), pp.1576-1578.
    • Barford, C.C., Wofsy, S.C., Goulden, M.L., Munger, J.W., Pyle, E.H., Urbanski, S.P., Hutyra, L., Saleska, S.R., Fitzjarrald, D. and Moore, K., 2001. Factors controlling long-and short-term sequestration of atmospheric CO2 in a mid-latitude forest. Science294(5547), pp.1688-1691.
    • Urbanski, S., Barford, C., Wofsy, S., Kucharik, C., Pyle, E., Budney, J., McKain, K., Fitzjarrald, D., Czikowsky, M. and Munger, J.W., 2007. Factors controlling CO2 exchange on timescales from hourly to decadal at Harvard Forest. Journal of Geophysical Research: Biogeosciences112(G2).
    • Wehr, R., Munger, J.W., McManus, J.B., Nelson, D.D., Zahniser, M.S., Davidson, E.A., Wofsy, S.C. and Saleska, S.R., 2016. Seasonality of temperate forest photosynthesis and daytime respiration. Nature534(7609), p.680.
  • Our Changing Forests Schoolyard Ecology project – Do your students want to get involved with research monitoring carbon cycles in forests? Check out this hands-on field investigation, led by a team of Ecologists at Harvard Forest. Students can contribute to this study by monitoring a 20 meter by 20 meter plot in a wooded area near their schools.
  • Video showcasing 30 years of research at the Harvard Forest LTER
  • A cool article about the diversity of research being done at Harvard Forest – Researchers blown away by hurricane simulation
  • Additional images from Harvard Forest, diagrams of NEE, and a vocabulary list can be found in this PowerPoint.

Permitted Uses

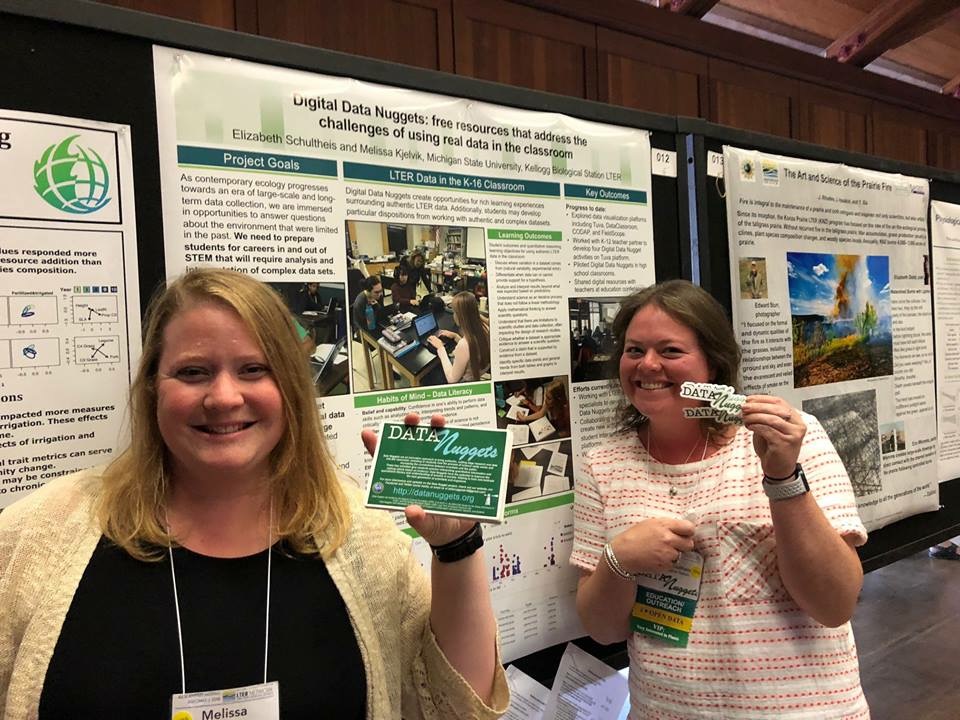
Data Nuggets were co-founded by Drs. Elizabeth Schultheis and Melissa Kjelvik, the Data Nuggets team. The Data Nuggets team maintains the copyright for all the activities and associated materials on this website. Use of Data Nuggets activities and materials must conform to our policies and restrictions, which we detail on this page. Please note:

  • We do not allow posting of content found within Data Nuggets activities, Teacher Guides, templates, or any other associated materials on other publicly accessible or commercial websites.
  • Scientists and other individuals who co-create Data Nuggets along with the Data Nuggets team maintain all rights and permissions for their data and images included in activities.
  • Violations of our policies will be investigated and pursued.

Permissions

As the copyright holder, Data Nuggets encourages use of our materials for educational and not-for-profit use by individual educators, professional development providers, researchers, and administrators. In most cases, the use of Data Nuggets falls under standard usage and does not require permissions. However, there are non-standard cases where permission is necessary. Below we clarify our distinction between standard usage and non-standard usage.

Standard Usage

Standard usage of Data Nuggets means that you do not need to contact us for permission. In order to fall into this category, each of the following conditions must be met. Failure to meet any of these criteria means that usage is considered non-standard. To be standard, usage must be:

  • Educational
  • Non-profit
  • In print format, or on a password-protected website on your school’s intranet or on a course management system, which only the teacher and students can access. In cases of professional development (PD) training, similar organizational sharing is acceptable if limited to the PD provider and participants.

The following are typical examples of standard usage.

  1. Teaching materials: Educators may use our activities in their classrooms in accordance with “fair use” guidelines without seeking our permission. This includes modification of materials to fit a classroom setting, including personalization of activities for students. Data Nuggets are available on our website in PDF format, but are available as Microsoft Word documents upon request. When activities are used, the featured scientists in the activity and the Data Nuggets program should be acknowledged as the source.
  2. Professional development (PD): We encourage PD providers to use our materials to train educators as a component of not-for-profit PD offerings. This includes training provided within districts or educational organizations and projects. We also encourage the use of our materials to facilitate training for scientists and researchers, regarding the communication of scientific research to broad audiences.
  3. Educational conference: We are happy to have educators disseminate Data Nuggets at educational conferences by including them in their workshops and talks. If you plan an event where you’ll be using Data Nuggets, let us know and we can help disseminate!

Non-Standard Usage

All other uses of Data Nuggets we consider to be non-standard usage and requires our formal permission before proceeding. To request permission, please email Elizabeth Schultheis and Melissa Kjelvik at datanuggetsK16@gmail.com. In most cases we will allow the usage of materials and we will email you a response quickly and let you know if any additional information is required.

Examples of non-standard usage includes but is not limited to:

  1. Inclusion of material in a commercial text book.
  2. Use of Data Nuggets as assessments for students at the district or state level.
  3. Use of Data Nuggets for research purposes where data collection occurs. This includes data collection intended for publication in the science education literature, or for use by districts and administrators to track students performance.
  4. Posting of Data Nuggets materials on any website other than https://datanuggets.org

Restrictions and Limitations

Student versions of Data Nuggets are hosted on our website and may not be re-posted on other publicly accessible websites or databases. We strictly control the access to the Teacher Guides associated with each Data Nuggets activity. Teachers, instructors, PD providers, and administrators may download our Teacher Guides after requesting permission by filling out a short form that can be found here. Teacher Guides serve both as answer keys, as well as provide educators with additional notes, teaching tips, and links to additional resources. The use of Teacher Guides is restricted to the standard usage guidelines described above. Reproduction of our notes or answer keys in any form is prohibited without our written permission.


Copyright

Copyright for all Data Nugget activities is held by the Data Nuggets team. To determine whether you need our permission to use materials, see our Permissions section above.

Featured scientists and researchers maintain all rights and permissions to the data and images found in our activities or on our website. Data Nuggets use datasets with direct permission from their sources. All reproduction or hosting of data is prohibited without written permission from Data Nuggets or the scientists directly. Data Nuggets are often based on ongoing or recently completed research, and therefore many of these datasets are not yet published or in the public domain. When data is available through other sources, please follow the guidelines put forth by that institution. For example, some datasets are available in the public domain through repositories, such as Dryad, or networks, such as the LTER. Dryad’s policies can be found here. LTER’s policies can be found here.

Images on our website are either owned by Data Nuggets, used with direct permission from their sources, believed to be in the public domain, or incorporated into our activities according to “fair use” guidelines. Images will occasionally have their sources acknowledged in their captions when expressly requested by the featured scientists. To request the use of an image, please contact us directly.

Bringing back the Trumpeter Swan

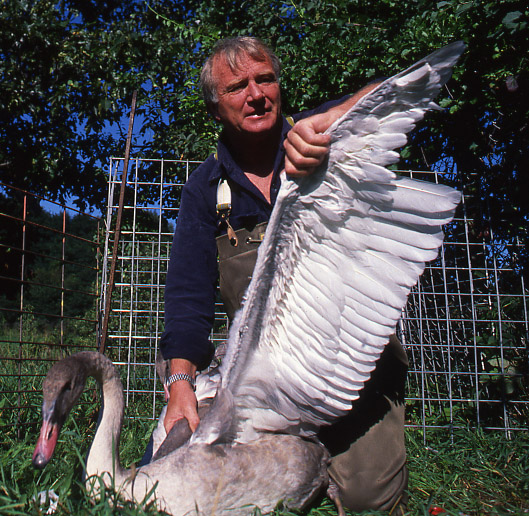
Joe with a Trumpeter Swan.

The activities are as follows:

The Kellogg Bird Sanctuary was created in 1927 to provide safe nesting areas for waterfowl such as ducks, geese, and swans. During that time many waterfowl species were in trouble due to overhunting and the loss of wetland habitats. One species whose populations had declined a lot was the Trumpeter Swan. Trumpeter swans are the biggest native waterfowl species in North America. At one time they were found across North America, but by 1935 there were only 69 known individuals in the continental U.S.! The swans were no longer found in Michigan.

The reintroduction, or release of a species into an area where they no longer occur, is an important tool in helping them recover. In the 1980s, many biologists came together to create a Trumpeter Swan reintroduction plan. Trumpeter Swans in North America can be broken up into three populations – Pacific Coast, Rocky Mountain, and Interior. The Interior is further broken down into Mississippi/Atlantic and High Plains subpopulations. Joe, the Kellogg Bird Sanctuary manager and chief biologist, wrote and carried out a reintroduction plan for Michigan. Michigan is part of the Mississippi/Atlantic subpopulation. Joe and a team of biologists flew to Alaska in 1989 to collect swan eggs to be reared at the sanctuary. After two years the swans were released throughout Michigan.

The North American Trumpeter Swan survey has been conducted approximately every 5 years since 1968 as a way to estimate the number of swans throughout their breeding range. The survey is conducted in late summer when young swans can’t yet fly but are large enough to count. Although the surveys are conducted across North America, the data provided focuses on just the Interior Population, which includes swans in the High Plains and Mississippi/Atlantic Flyways.

Featured scientist: Wilbur C. “Joe” Johnson from the W.K. Kellogg Bird SanctuaryWritten by: Lisa Vormwald and Susan Magnoli from Michigan State University.

Flesch–Kincaid Reading Grade Level = 11.5

Additional teacher resource related to this Data Nugget:

A video on Trumpeter Swan reintroduction efforts that could be shown before the Data Nugget to engage students with the topic, or after to expand the research beyond the one study:

SaveSave

SaveSave

SaveSave

SaveSave

SaveSave

When whale I sea you again?

Image of a humpback whale tail from the Palmer Station LTER. Photo credit Beth Simmons.

The activities are as follows:

People have hunted whales for over 5,000 years for their meat, oil, and blubber. In the 19th and 20th centuries, pressures on whales got even more intense as technology improved and the demand for whale products increased. This commercial whaling used to be very common in several countries, including the United States. Humpback whales were easy to hunt because they swim slowly, spend time in bays near the shore, and float when killed.  Before commercial whaling, humpback whales were one of the most visible animals in the ocean, but by the end of the 20th century whaling had killed more than 200,000 individuals.

Today, as populations are struggling to recover from whaling, humpback whales are faced with additional challenges due to climate change. Their main food source is krill, which are small crustaceans that live under sea ice. As sea ice disappears, the number of krill is getting lower and lower. Humpback whale population recovery may be limited because their main food source is threatened by ongoing ocean warming.

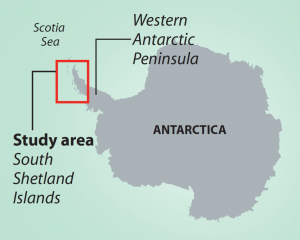
One geographic area that was over-exploited during times of high whaling was the South Shetland Islands along the Western Antarctic Peninsula (WAP). The WAP is in the southern hemisphere in Antarctica. Humpback whales migrate every year from the equator towards the south pole. In summer they travel 25,000 km (16,000 miles) south to WAP’s nutrient-rich polar waters to feed, before traveling back to the equator in the winter to breed or give birth. Today the WAP is experiencing one of the fastest rates of regional climate change with an increase in average temperatures of 6° C (10.8° F) since 1950. Loss of sea ice has been documented in recent years, along with reduced numbers of krill along the WAP.


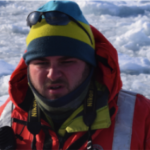
Logan is a scientist who is studying how humpback whales are recovering after commercial whaling. Logan’s work helps keep track of the number of whales that visit the WAP in the summer. He also determines the sex ratio, or ratio of males to females, which is important for reproduction. The more females in a population compared to males, the greater the potential for having more baby whales born into the next generation. Logan predicts there may be a general trend of more females than males along the WAP as the season progresses from summer to fall. Logan thinks that female humpback whales stay longer in the WAP because they need to feed more than males in order to have extra nutrients and energy before they birth their babies later in the year. This extra energy will be needed for their milk supply to feed their babies.

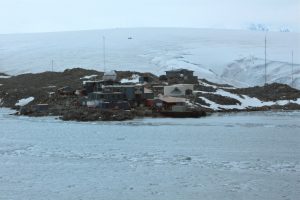
The Palmer LTER station when Logan and others scientists live while they conduct research on whales.

Humpback whales only surface for air for a short period of time, making it difficult to determine their sex. In order to identify surfacing whales as female or male, scientists need to collect a biopsy, or a sample of living tissue, in order to examine the whale’s DNA. Logan worked with a team of scientists at Oregon State University and Duke University to engineer a modified crossbow that could be used to collect samples. Logan uses this crossbow to collect a biopsy sample each time they spot a whale. To collect a sample, Logan aims the crossbow at the whale’s back, taking care to avoid the dorsal fin, head, and fluke (tail). He mounts each arrow with a 40mm surgical stainless steel tip and a flotation device so the samples will bounce off the whale and float for collection. The samples are then frozen so they can be stored and brought back to the lab for analysis. Logan also takes pictures of each whale’s fluke because each has a pattern unique to that individual, just like the human fingerprint. Additionally, at the time of biopsy, Logan records the pod size (number of whales in the area) and GPS location.

Logan’s data are added to the long-term datasets collected at the WAP. To address his question he used data from 2010-2016 along the WAP and other feeding grounds. Logan’s data ranges from January to April because those are the months he is able to spend at the research station in the WAP before it gets too cold. Logan has added to the scientific knowledge we have about whales by building off of and using data collected by other scientists.

Featured scientist: Logan J. Pallin from Oregon State University. Written by: Alexis Custer

Flesch–Kincaid Reading Grade Level = 10.7

Additional teacher resources related to this Data Nugget:

  • To see more images of humpback whales, and the Palmer Research Station in the WAP where Logan works, check out this PowerPoint. This can be shared with students in class after they read the Research Background and before they move on to the data.
  • More data from this region can be found on the DataZoo, Palmer LTER’s online data portal. To access data on this portal, follow instructions found on this “cheat sheet”. For files that have been compiled for educators, check out this Google Drive folder.
  • For his research, Logan has traveled to United States Antarctic Programs’ Palmer Research Station on the WAP during the austral summer and fall and will be departing again for the WAP in January 2018. He is part of a team of scientists interested in Palmer Long Term Ecological Research, which is funded through the National Science Foundation, documenting changes on in the Antarctic ecosystem.
  • For more information on whale research at Palmer Station LTER and the WAP, check out this website.
  • For additional classroom activities dealing with Palmer Station LTER data, check out this website.
  • The International Whaling Commission (IWC) was created in
    1946 in Washington D.C. in hopes to provide conservation to whale stocks around the world. In 1982, the IWC placed a moratorium on commercial whaling. Fore more information on the IWC and humpback whales, check out their website.

About Logan: Logan is interested in determining how humpback whales are recovering after commercial whaling. Logan first got interested in working with marine mammals when he was an undergraduate student at Duke University and had the opportunity to work as a field technician on a project with some scientists at Duke. He quickly realized this was what he wanted to do and that studying humpbac whales was particularly interesting as they appear to have all rebounded quite heavily in the Southern Hemisphere. Assessing why this recovery was happening so fast and why now, was something Logan really wanted to look at. After graduating from college, he continued to work with marine mammologists as a graduate student to receive his Masters in Science from Oregon State University. In the fall of 2017, he started his work on a PhD from University of California, Santa Cruz continuing asking questions and learning more about whales around Antarctica.
SaveSave

SaveSave

SaveSave

SaveSave

SaveSave

SaveSave

SaveSave

SaveSave

SaveSave

SaveSave

SaveSave

SaveSave

Research Documents


DOCUMENTS FOR RESEARCH: If you have questions about the research, please email Molly mstuhlsatz@bscs.org or Val vmaltese@bscs.org from BSCS.


ONCE YOU HAVE YOUR CLASS ASSIGNMENTS FOR FALL 2017: Please complete the following survey by August 5th. This survey will update us on your class schedule for the year and provide us some information on your classroom context.

http://www.surveymonkey.com/r/dnstudyclass


SCHEDULING CLASSROOM OBSERVATION VISITS – Fall 2017

SaveSave

SaveSaveSaveSave

SaveSave

SaveSave

SaveSave

SaveSave

SaveSave

Study 26 Pack

Below, you will find a table of the 26 Data Nuggets to be used in the research study. Click on the Title to open a page displaying the Data Nugget and associated activities. The table can be sorted using the arrows located next to each column header. It can also be searched using the search command at the top of the table. By default we have the activities sorted by increasing difficulty.

For a reminder on what the Content Levels (1-4) and Graph Types (A-C) mean, check out our information page here.

TitleContent LevelKeywordsSummary
DSC_0060Won’t you be my urchin?1coral reef, herbivory, marine, sea urchin, water, animals, competitionCorals are the most important reef animals since they build the reef for all of the other animals to live in. But corals only like to live in certain places. In particular they hate living near algae because the algae and coral compete for the space they both need to grow. Perhaps if there are more vegetarians, like urchins, eating algae on the reef then corals would have less competition and more space to grow.
DSC_0060Coral bleaching and climate change1climate change, coral reef, marine, mutualism, temperature, animals, algaeCorals are animals that build coral reefs. They look brown and green because they have small plants, called algae, that live inside them. The coral animal and the algae work together to produce food so that corals can grow big. When the water gets too warm, sometimes the coral and algae can no longer work together. The algae leave and the corals turn white, called coral bleaching. Scientists want to study coral bleaching so they can protect corals and the reefs that provide a home for so many different species.
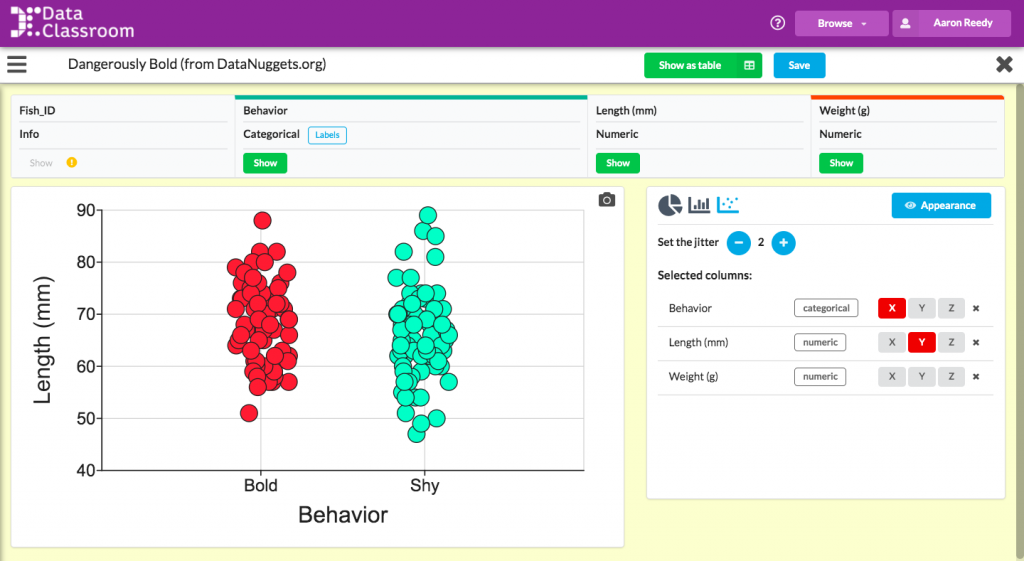
DSC_0060Dangerously bold1animals, animal behavior, tradeoff, fish, predationThere are two main habitats that young bluegill sunfish can use to find food to eat – open water and cover. There is lots of food in the open water, but this habitat also has very few plants for bluegill to hide from predators, like the largemouth bass, so it’s not safe when bluegill are small! The cover habitat has less food, but it has lots of plants that make it hard for predators to see the bluegill. This sets up a situation where there are costs and benefits to using either habitat, called a tradeoff.
DSC_0060Springing forward1 & 3climate change, phenology, plants, temperatureWhat does climate change mean for flowering plants that rely on temperature cues to determine when it is time to flower? Scientists who study phenology, or the timing if life-history events in plants and animals, predict that with warming temperatures, plants will produce their flowers earlier and earlier each year.
DSC_0060Do insects prefer local or foreign foods?2herbivory, invasive species, plants, insects, enemy release, ecologyInsects that feed on plants, called herbivores, can have big effects on how plants grow. A plant with leaves eaten by herbivores will likely do worse than a plant that is not eaten. Herbivores may even determine how well an exotic plant does in its new habitat and whether it becomes invasive. Understanding what makes a species become invasive could help control invasions already underway, and prevent new ones in the future.
Deadly windows2animals, behavior, birds, environmentalGlass makes for a great windowpane because you can see right through it. However, this makes windows very dangerous for birds. Many birds die from window collisions in urban areas. In North America window collisions kill up to 1 billion birds every year! Perhaps local urban birds are able to learn the locations of windows and avoid collisions. By comparing window collisions by local birds to those of migrant birds that are just passing through, we can determine if local birds have learned to deal with this challenge.
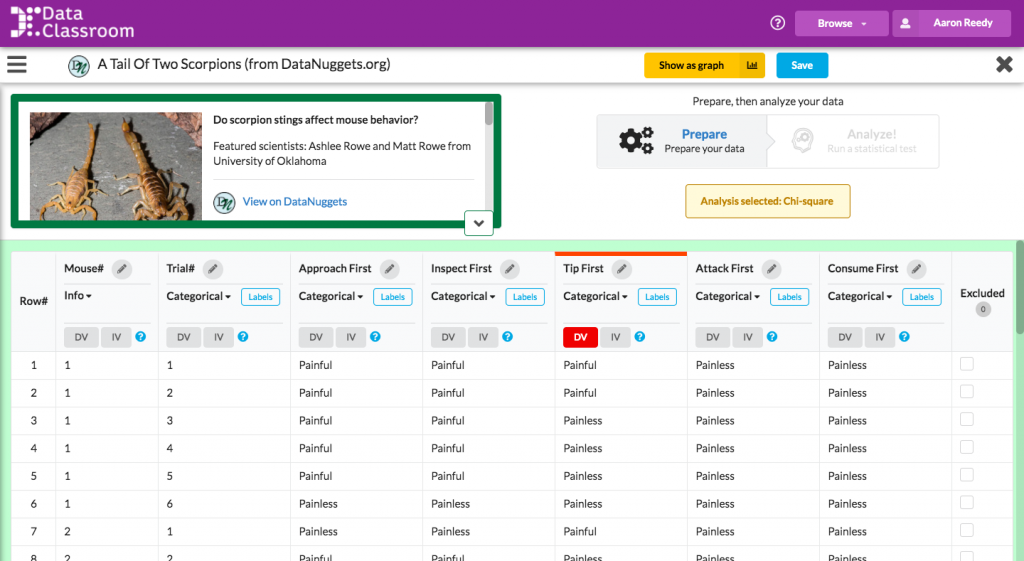
DSC_0060A tail of two scorpions2animal behavior, animals, predationSpecies rely on a variety of methods to defend against predators, including camouflage, speedy escape, or retreating to the safety of a shelter. Other animals, such as scorpions, have painful venomous stings. Scientists wanted to know whether the pain of a scorpion sting was enough to deter predators, like the grasshopper mouse.
DSC_0060Sexy smells2adaptation, animal behavior, animals, birds, matingAnimals collect information about each other and the rest of the world using multiple senses, including sight, sound, and smell. They use this information to decide what to eat, where to live, and who to pick as a mate. Many male birds have brightly colored feathers and ornaments that are attractive to females. Visual signals like these ornaments have been studied a lot in birds, but birds may be able to determine the quality of a potential mate using other senses as well, such as their smell!
flyfightHow do brain chemicals influence who wins a fight?2animals, behavior, competition, insects, aggression, brain chemistry, physiologyAnimals compete for resources, including space, food, and mates. What are the factors that determine who wins in a fight? Within the same species, larger individuals tend to win fights. However, if two opponents are the same size, other factors can influence outcomes. Serotonin is a chemical compound found in the brains of all animals, including stalk-eyed flies. Even a small amount of this chemical can make a big impact on aggressive behavior, and perhaps the outcome of competition.
DSC_0060Marvelous mud2ecology, environmental, fertilization, mud, phosphorus, substrate, water, wetlandBecause mud is wet most of the time, it tends to have different properties than soil. Dead organic matter (partially decomposed plants) is an important part of mud and tends to build up in wetlands because it is decomposed more slowly under water where microbes do not have all the oxygen they need to break it down quickly. The amounts of organic matter may determine the levels of phosphorus and other nutrients held in wetland muds.
DSC_0060Is chocolate for the birds?2agriculture, animals, birds, biodiversity, ecology, plants, rainforestHumans invented agriculture 9,000 years ago, and today it covers 40% of Earth’s land surface. To grow our crops, native plants are often removed, causing the loss of animals that relied on these native plants for habitat. However, sometimes animals can use crop species for food and shelter. For example, the cacao tree may provide habitat for bird species in the rainforests of Costa Rica. Will the abundance and types of birds differ in cacao plantations, compared to native rainforests?
DSC_0060Bye bye birdie? Part I2animals, biodiversity, birds, climate change, succession, disturbance, ecologyAvian ecologists at the Hubbard Brook Experimental Forest have been monitoring bird populations for over 40 years. The data collected during this time is one of the longest bird studies ever conducted! What can we learn from this long-term data set? Are bird populations remaining stable over time?
DSC_0060Bye bye birdie? Part II3animals, biodiversity, birds, climate change, succession, disturbance, ecologyHubbard Brook was heavily logged and disturbed in the early 1900s. When logging ended in 1915, trees began to grow back. The forest then went through secondary succession, which refers to the naturally occurring changes in forest structure that happen as a forest ages after it has been cut or otherwise disturbed. Can these changes in habitat availability, due to succession, explain why the number of birds are declining at Hubbard Brook? Are all bird species responding succession in the same way?
To bee or not to bee aggressive3animals, behavior, genes, insects, tradeoffHoney bees turn nectar from flowers into honey, and honey serves as an energy-rich food source for the colony. Honey also makes hives a target for break ins by animals that want to steal it. Bees need to aggressively defend their honey when the hive is threatened. They also need to ensure that they do not waste energy on unnecessary aggressive behaviors when the threat level is low. One way bees might match their aggressiveness to the threat level in the environment is learning from adults when they are young.
pcare2Raising Nemo: Parental care in the clown anemonefish3adaptation, animals, behavior, coral reef, ecology, fish, marine, mating, tradeoffOffspring in many animal species rely on parental care; the more time and energy parents invest in their young, the more likely it is that their offspring will survive. However, parental care is costly for the parents. The more time spent on care, the less time they have to find food or care for themselves. In the clown anemonefish, the amount of food available may impact parental care behaviors. When there is food freely available in the environment, are parents able to spend more time caring for their young?
DSC_0060Growing energy: comparing biofuel crop biomass3agriculture, biofuels, climate change, fertilization, plantsCorn is one of the best crops for producing biomass for fossil fuels, however it is an annual and needs very fertile soil. To grow corn, farmers add a lot of chemical fertilizers and pesticides to their fields. Other crops, like switchgrass, prairie, poplar trees, and Miscanthus grass are perennials and require fewer fertilizers and pesticides to grow. If perennials can produce high levels of biomass with low inputs, perhaps they could produce more biomass than corn under certain low nutrient conditions.
DSC_0060Fertilizing biofuels may cause release of greenhouse gasses3biofuels, climate change, fertilization, greenhouse gasses, nitrogen, plantsOne way to reduce the amount of greenhouse gases we release into the atmosphere could be to grow our fuel instead of drilling for it. Unlike fossil fuels that can only release CO2, biofuels remove CO2 from the atmosphere as they grow and photosynthesize, potentially balancing the CO2 released when they are burned for fuel. However, the plants we grow for biofuels don’t necessarily absorb all greenhouse gas that is released during the process of growing them on farms and converting them into fuels.
DSC_0060The ground has gas!3climate change, temperature, greenhouse gasses, nitrogen, plantsNitrous oxide and carbon dioxide are responsible for much of the warming of the global average temperature that is causing climate change. Sometimes soils give off, or emit, these greenhouse gases into the earth’s atmosphere, adding to climate change. Currently scientists figuring out what causes differences in how much of each type of greenhouse gas soils emit.
kgrayson1When a species can’t stand the heat3animals, climate change, disturbance, ecology, environmental, mating, temperatureTuatara are a unique species of reptile found only in New Zealand. In this species, the temperature of the nest during egg development determines the sex of offspring. Warm nests lead to more males, and cool nests lead to more females. With warming temperatures due to climate change, scientists expect the sex ratio to become more and more unbalanced over time, with males making up more of the population. This could leave tuatara populations with too few females to sustain their numbers.
 junglefoulFeral chickens fly the coop3adaptation, animals, behavior, birds, ecology, evolution, matingSometimes domesticated animals escape captivity and interbreed with closely related wild relatives. Their hybrid offspring have some traits from the wild parent, and some from the domestic parent. Traits that help hybrids survive and reproduce will be favored by natural selection. On the island of Kauai, domestic chickens escaped and recently interbred with wild Red Junglefowl to produce a hybrid population. Over time, will the hybrids on Kauai evolve to be more like chickens, or more like Red Junglefowl?
DSC_0060CSI: Crime Solving Insects3animals, insects, parasitismYou might think maggots (blow fly larvae) are gross, but without their help in decomposition we would all trip over dead bodies every time we went outside! Forensic entomologists also use these amazing insects to help solve crimes. Blow flies oviposit on dead bodies, and the age of the maggots that hatch helps scientists determine how long ago a body died. Scientists noticed parasitic wasps were also present at some bodies. Might these wasps delay blow fly oviposition and interfere with scientists' estimates of time of death?
DSC_0060How the cricket lost its song, Part I3adaptation, animal behavior, animals, evolution, mating, parasitismPacific field crickets live on several Hawaiian Islands, including Kauai. Male field crickets make a loud, long-distance song to help females find them, and then switch to a quiet courtship song once a female comes in close. One summer scientists noticed that the crickets on the island were unusually quiet. Back in the lab they saw males that had lost their specialized wing structures used to produce song! Why did these males lose their wing structures?
DSC_0060How the cricket lost its song, Part II3adaptation, animal behavior, animals, evolution, mating, parasitismWIthout their song, how are flatwing crickets able to attract females? In some other animals species, males use an alternative to singing, called satellite behavior. Satellite males hang out near a singing male and attempt to mate with females who have been attracted by the song. Perhaps the satellite behavior gives flatwing males the opportunity to mate with females who were attracted to the few singing males left on Kauai.
6298983_origAre you my species?3adaptation, animals, behavior, biodiversity, competition, evolution, fish, matingHow do animals know who to choose as a mate and who is a member of their own species? One way is through communication. Animals collect information about each other and the rest of the world using multiple senses, including sight, sound, and smell. Darters are a group of over 200 colorful fish species that live in lakes and rivers across the US. The bright color patterns on males may signal to females during mating who is a member of the same species and who would make a good mate.
DSC_0060The mystery of Plum Island Marsh3fertilization, fish, marine, mollusk, water, wetlandSalt marshes are among the most productive coastal ecosystems, and support a diversity of plants and animals. Algae and marsh plants feed many invertebrates, like snails and crabs, which are then eaten by larger fish and birds. In Plum Island, scientists have been fertilizing and studying salt marsh creeks to see how added nutrients affect the system. They noticed that fish populations seemed to be crashing in the fertilized creeks, while the mudflats were covered in mudsnails. Could there be a link?
chickadee2Finding Mr. Right4adaptation, animals, behavior, biodiversity, birds, evolution, mating, local adaptationMountain chickadees are small birds that live in the mountains. To deal with living in a harsh environment during the winter, mountain chickadees store large amounts of food throughout the forest. Compared to populations at lower elevations, birds from higher elevations are smarter and have better spatial memory, helping them better find stored food. Smarter females from high elevations may be contributing to local adaptation by preferring to breed with males from their own population.

Data Nugget Research Study 2017-2018

Below are links to all the materials from the research study, Scientific Data in Schools: Measuring the efficacy of an innovative approach to integrating quantitative reasoning in secondary scienceIf you have any questions, our contact information is linked below!

SaveSave

SaveSave

SaveSave

SaveSave

SaveSave

SaveSave

SaveSave

SaveSave

SaveSave

SaveSave

SaveSave

SaveSave

Deadly windows

A white-throated sparrow caught during the experiment. You can see the band on it’s leg, used to make sure they did not record the same bird more than once.

The activities are as follows:

Glass makes for a great windowpane because you can see right through it. However, the fact that windows are see-through makes them very dangerous for birds. Have you ever accidentally run into a glass door or been confused by a tall mirror in a restaurant? Just like people, birds can mistake a see-through window or a mirrored pane for an opening to fly through or a place to get food and will accidentally fly into them. These window collisions can hurt the bird or even kill it. Window collisions kill nearly one billion birds every year!

Urban areas, with a lot of houses and stores, have a lot of windows. Resident birds that live in the area may get to know these buildings well and may learn to avoid the windows. However, not all the birds in an area live there year-round. There are also migrant birds that fly through urban areas during their seasonal migrations. In the fall, for example, migrant birds use gardens and parks in urban areas to rest along their journeys to their winter southern homes. During the fall migration, people have noticed that it seems like more birds fly into windows. This may be because migrant birds, especially the ones born that summer, are not familiar with the local buildings. While looking for food and places to sleep, migrant birds might have more trouble identifying windows and fly into them more often. However, it could also be that there are simply more window collisions in the fall because there are more birds in the area when migrant and resident birds co-occur in urban areas.

Researchers identify the species of each bird caught in one of the nets used in the study. They then place a metal bracelet on one leg so they will know if they catch the same bird again.

Natasha was visiting a friend who worked at a zoo when he told her about a problem they were having. For a few weeks in the fall, they would find dead birds under the windows, more than they would during the rest of the year. He wanted to figure out a way to prevent birds from hitting the exhibit windows. Natasha became interested in learning whether migrant birds were more likely to fly into windows than resident birds or if the number of window collisions only increase in the fall because there are a lot of birds around. To do this she would have to count the total number of birds in the area and also the total number of birds that were killed in window collisions, as well as identify the types of birds. To count the total number of birds in the area, Natasha hung nets that were about the same height as windows. When the birds got caught in the nets, Natasha could count and identify them. These data could then be used to calculate the proportion of migrants and residents flying at window-height. She put 10 nets up once a week for four hours, over the course of three months, and checked them every 15 minutes for any birds that got caught.

Researcher identifying a yellow-rumped warbler, one of the birds captured in the net as part of the study.

Then, she also checked under the windows in the same area to see what birds were killed from window collisions. She checked the windows every morning and evening for the three months of the study. Different species of birds are migratory or resident in the area where Natasha did her study. Each bird caught in nets was examined to identify its to species using its feathers, which would tell her whether the bird was a migrant or a resident. The same was done for birds found dead below windows.

If window collisions are really more dangerous for migrants, she predicted that a higher proportion of migrants would fly into windows than were caught in the nets. But, if window collisions were in the same proportion as the birds caught in the nets, she would have evidence that windows were just as dangerous for resident birds as for migrants.

Featured scientist: Natasha Hagemeyer from Old Dominion University

Flesch–Kincaid Reading Grade Level = 8.7

There is one scientific paper associated with the data in this Data Nugget. The citation and PDF of the paper is below:

To engage students with the lesson before they begin, or after the lesson to help them develop their own independent questions for the system, you can share the following videos:

SaveSave

SaveSave

SaveSave

SaveSave

SaveSave

SaveSave

SaveSave

SaveSave

SaveSave

SaveSave

SaveSave

Marsh makeover

A saltmarsh near Boston, MA being restored after it was degraded by human activity.

The activities are as follows:

Salt marshes are diverse and productive ecosystems, and are found where the land meets the sea. They contain very unique plant species that are able to tolerate flooding during high tide and greater salt levels found in seawater. Healthy salt marshes are filled with many species of native grasses. These grasses provide food and nesting grounds for lots of important animals. They also help remove pollution from the land before it reaches the sea. The grass roots protect the shoreline from erosion during powerful storms. Sadly today, humans have disturbed most of the salt marshes around the world. As salt marshes are disturbed, native plant biodiversity, and the services that marshes provide to us, are lost.

A very important role of salt marshes is that they are able to store carbon, and the amount they store is called their carbon storage capacity. Carbon is stored in marshes in the form of both dead and living plant tissue, called biomass. Marsh grasses photosynthesize, taking carbon dioxide out of the atmosphere and storing it in plant biomass. This biomass then falls into the mud and the carbon is stored there for a very long time. Salt marshes have waterlogged muddy soils that are low in oxygen. Because of the lack of oxygen, decomposition of dead plant tissue is much slower than it is in land habitats where oxygen is plentiful. All of this stored carbon can help lower the levels of carbon dioxide in our atmosphere. This means that healthy and diverse salt marshes are very important to help fight climate change.

However, as humans change the health of salt marshes, we may also change the amount of carbon being stored. As humans disturb marshes, they may lower the biodiversity and fewer plant species can grow in the area. The less plant species growing in the marsh, the less biomass there will be. Without biomass falling into the mud and getting trapped where there is little oxygen, the carbon storage capacity of disturbed marshes may go down.

Jennifer, working alongside students, to collect biomass data for a restored saltmarsh.

It is because of the important role that marshes play in climate change that Jennifer, and her students, spend a lot of time getting muddy in saltmarshes. Jennifer wants to know more about the carbon storage capacity of healthy marshes, and also those that have been disturbed by human activity. She also wants to know whether it is possible to restore degraded salt marshes to help improve their carbon storage capacity. Much of her work focuses on comparing how degraded and newly restored marshes to healthy marshes. By looking at the differences and similarities, she can document the ways that restoration can help increase carbon storage. Since Jennifer and her students work in urban areas with a lot of development along the coast, there are lots of degraded marshes that can be restored. If she can show how important restoring marshes is for increasing plant diversity and helping to combat climate change, then hopefully people in the area will spend more money and effort on marsh restoration.

Jennifer predicted that: 1) healthy marshes will have a higher diversity of native vegetation and greater biomass than degraded salt marshes, 2) restored marshes will have a lower or intermediate level of biomass depending on how long it has been since the marsh was restored, and 3) newly restored marshes will have lower biomass, while marshes that were restored further in the past will have higher biomass.

To test her predictions, Jennifer studied two different salt marshes near Boston, Massachusetts, called Oak Island and Neponset. Within each marsh she sampled several sites that had different restoration histories. She also included some degraded sites that had never been restored for a comparison. Jen measured the total number of different plant species and plant biomass at multiple locations across all study sites. These measurements would give Jen an idea of how much carbon was being stored at each of the sites.

Featured scientist: Jennifer Bowen from Northeastern University

Flesch–Kincaid Reading Grade Level = 11.0

Sticky situations: big and small animals with sticky feet

Travis in the lab measuring the stickiness of a gecko’s toe.

Travis in the lab measuring the stickiness of a gecko’s toe.

The activities are as follows:

Species are able to do so many amazing things, from birds soaring in the air, lizards hanging upside-down from ceilings, and trees growing hundreds of feet tall. The study of biomechanics looks at living things from an engineering point of view to study these amazing abilities and discover why species come in such a huge variety of shapes and sizes. Biomechanics can improve our understanding of how plants and animals have adapted to their environments. We can also take what we learn from biology and apply it to our own inventions in a process called biomimicry. Using this approach, scientists have built robotic jellyfish to survey the oceans, walking robots to help transport goods, and fabrics that repel stains like water rolling off a lotus leaf.

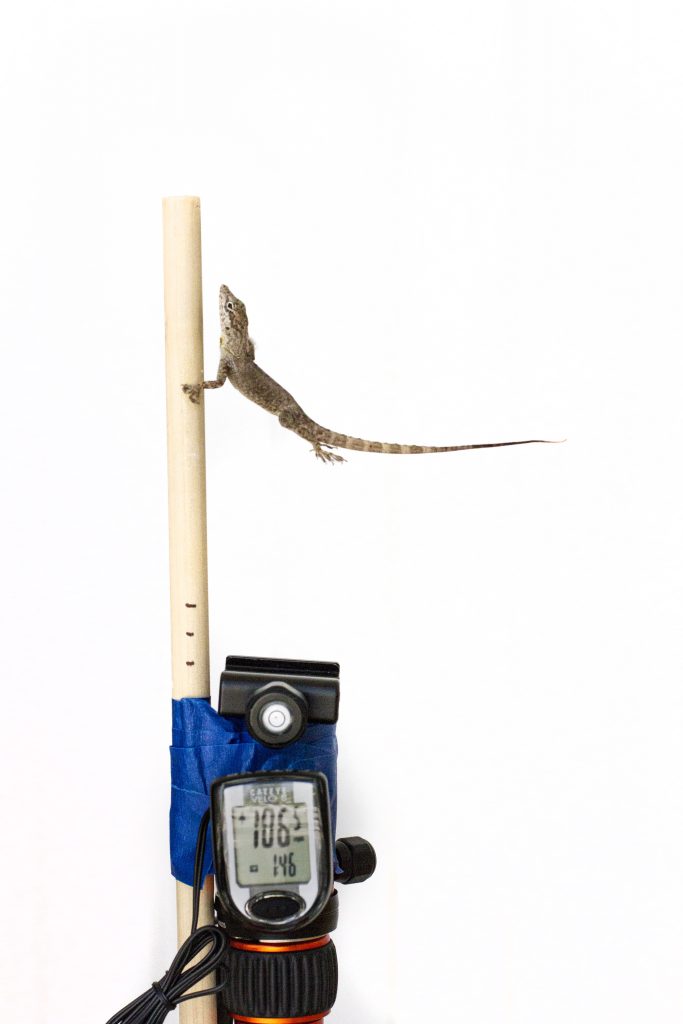
Travis studies biomechanics and is interested in the ability of some species to climb and stick to walls. Sticky, or adhesive, toe pads have evolved in many different kinds of animals, including insects, arachnids, reptiles, amphibians, and mammals. Some animals, like frogs, bats, and bugs use suction cups to hold up their weight. Others, like geckos, beetles, and spiders have toe pads covered in tiny, branched hairs. These hairs actually adhere to the wall! Electrons in the molecules that make up the hairs interact with electrons in the molecules of the surface they’re climbing on, creating a weak and temporary attraction between the hairs and the surface. These weak attractions are called van der Waals forces.

Travis catching lizards in the Dominican Republic.

Travis catching lizards in the Dominican Republic.

The heavier the animal, the more adhesion they will need to stick and support their mass. With a larger toe surface area, more hairs can come in contact with the climbing surface, or the bigger the suction cup can be. For tiny species like mites and flies, tiny toes can do the job. Each fly toe only has to be able to support a small amount of weight. But when looking at larger animals like geckos, their increased weight means they need much larger toe pads to support them.

When comparing large and small objects, the mass of large objects grows much faster then their surface area does. As a result, larger species have to support more mass per amount of toe area and likely need to have non-proportionally larger toes than those needed by lighter species. This results in geckos having some crazy looking feet! This relationship between mass and surface area led Travis to hypothesize that larger species have evolved non-proportionally larger toe pads, which would allow them to support their weight and stick to surfaces.

To investigate this idea, Travis looked at the data published in a paper by David Labonte and fellow scientists. In their paper they measured toe pad surface area and mass of individual animals from 17 orders (225 species) including insects, arachnids, reptiles, amphibians, and mammals. From their data, Travis calculated the average toe pad area and mass for each order.

Travis then plotted each order’s mass and toe pad area on logarithmic axes so it is easier to compare very small and very large values. Unlike a standard axis where the amount represented between tick marks is always the same, on logarithmic axes each tick mark increases by 10 times the previous value. For example, if the first tick represents 1.0, the second tick will be 10, and the next 100. As an example, look at the graphs below.

gecko-graph

The left plot shows hypothetical gecko species of different sizes, but with proportional toes. Their mass per toe pad area ratio (g/mm2) varies, with larger species having larger g/mm2 ratios. In this case, larger species have to support more mass per toe pad area. In the right plot, larger gecko species have disproportionally larger toes. These differences change each species’ mass per toe pad area ratios, so that all species, regardless of their size, have the same mass per toe pad area ratio.

Featured scientists: David Labonte, Christofer J. Clemente, Alex Dittrich, Chi-Yun Kuo, Alfred J. Crosby, Duncan J. Irschick, and Walter Federle. Written by: Travis Hagey

Data Nugget Flesch–Kincaid Reading Grade Level = 10.3

Scaling Up – Math Activity Flesch–Kincaid Reading Grade Level = 9.5

There is a scientific paper associated with the data in this Data Nugget. The data was used with permission from D. Labonte.

Labonte, D., Clemente, C.J., Dittrich, A., Kuo, C.Y., Crosby, A.J., Irschick, D.J. and Federle, W., 2016. Extreme positive allometry of animal adhesive pads and the size limits of adhesion-based climbing. Proceedings of the National Academy of Sciences, p.201519459.

To learn more about Travis and his research on geckos, read this blog post, “An evolving sticky situation” and check out the video below!

poster
Sticky situations video
00:00
--
/
--

For a video and article on using “gecko power” to scale a building, check out this article – Climbing a Glass Building? Try a Gecko’s Sticky Pads


dr-fowleriAbout Travis: Ever since Travis was a kid, he was interested in animals and wanted to be a paleontologist. He even had many dinosaur names memorized to back it up! In college he discovered evolutionary biology, which drove him to apply for graduate school and become a scientist. There, he fell in love with comparative biomechanics, which combines evolutionary biology and mechanical engineering. Today Travis studies geckos and their sticky toes that allow them to scale surfaces like glass windows and tree branches.

SaveSave

SaveSave

SaveSave

SaveSave

SaveSave

SaveSave