The activities are as follows:
- Teacher Guide
- Student activity, Graph Type A, Level 3
- Student activity, Graph Type B, Level 3
- Student activity, Graph Type C, Level 3
- Grading Rubric
Casey is a biologist who grew up with dogs as pets. His dogs were all the same species and had some things in common – they all had a tail, ears, and fur. But, each dog also had its own unique appearance – tail length, ear shape, and fur color. These things are called traits. Casey became interested in how slight differences in traits make individuals unique.
As Casey observed in dogs, not all individuals in the same species are exactly alike. This is also true in plants. When we look closely at individual plants of the same species, we often see that each is slightly different from the next. Some grow faster. Some have more leaves than others. Some are better at defending themselves against herbivores that might eat them.
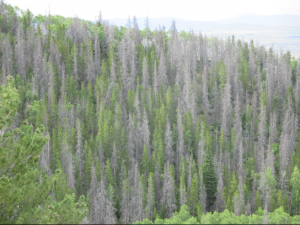
People move species around the globe, and some of these species cause problems where they are introduced. These trouble-making species are called invasive species. Casey wanted to apply what he knew about trait differences to the environment around him, so he chose to study invasive plants and their traits. He wants to know what it is about invasive species that make them able to invade. Casey thought that maybe certain traits cause invasive species to be more troublesome than others. The individual plants that have invaded other parts of the world might have different traits that made them successful in that environment. Plants in their new invasive range might be slightly different than plants in the native range where they came from.
Along with other members of his lab, Casey is studying an invasive plant species called burr clover. The lab collected seeds of burr clover from all different parts of the world. Some of the seeds came from the native range around the Mediterranean Sea (e.g. Italy, France, and Morocco) and some came from areas where they are invasive (e.g. Japan, Brazil, and the United States). The plants from the invasive range have already proven that they can invade new areas. Studying traits in native and invasive ranges would allow Casey to learn more about how those individuals invaded in the first place. Because Casey thought trait differences might have caused certain individuals of burr clover to become invasive, he predicted that individuals from the invasive range would have different traits than those from the native range.
The lab decided to look at one trait in particular – how much an individual plant was affected by herbivores, which is called tolerance. The most tolerant individuals can still grow and produce fruits, even when herbivores eat a lot of their tissue. Casey thought that individuals from the invasive range would be more tolerant than individuals from the native range. One reason the invading individuals may have been successful is that they were more tolerant of herbivores in their new environment.The fruits contain seeds that make new plants, so plants that make more fruits can invade more easily. If individuals from the invasive range can make more fruits, even when herbivores are around, then they may reproduce and spread more quickly.
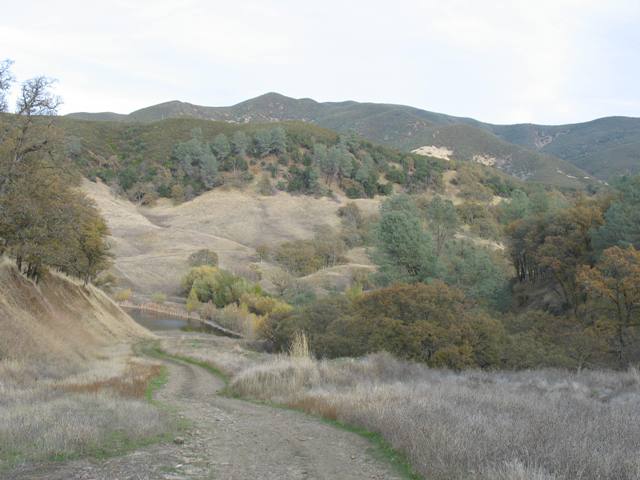
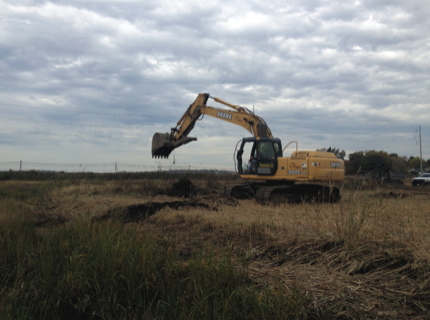
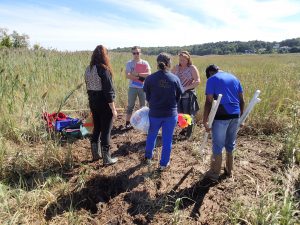
So, Casey and his lab collected seeds from 22 individual plants from the native range and 22 individual plants from the invasive range. Each plant produces many seeds, so they collected several seeds from each individual. They created 24 2×2-meter plots in a field in California. Into each plot they planted 2-4 seeds from each individual plant and the seeds were planted in a random order in each plot. In all, there were 3,349 plants! In half of the plots, they removed any insects that might eat the plants. To do this they randomly chose half of the plots and sprayed them with insecticide, which kills insects. They sprayed the other half of the plots with water as a control. They wanted to know how many fruits were made by plants under good conditions so they could compare to plants that are being eaten by herbivores. After the plants grew all spring, they measured how many small, spiky fruits each plant produced. They compared how many fruits each plant produced in the plots with insects and the plots without insects.
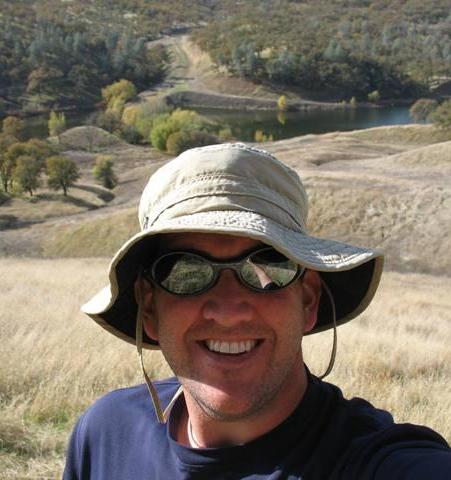
Featured scientist: Casey terHorst from California State University, Northridge
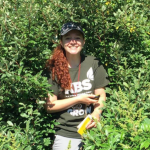 About Nora: Nora is currently an undergraduate getting her B.S. in Zoology with a concentration in Zoo and Aquarium as well as a minor in Marine Ecosystem Management from Michigan State University. Although aquatic life is her main interest, she think it’s important to appreciate other animal groups and take a break to play and explore the nature around you. That curiosity was how she was able to volunteer in labs on campus from entomology to genetics, and how she came to spend a summer at the Kellogg Biological Station in Michigan.

 About Kristine: Kristine L. Grayson is an Associate Professor in the Biology Department at University of Richmond, where she teaches Intro Ecology/Evolution, Field Ecology, Ecophysiology, and