The activities are as follows:
- Teacher Guide
- Student activity, Graph Type A, Level 2
- Student activity, Graph Type B, Level 2
- Student activity, Graph Type C, Level 2
- PowerPoint of Images
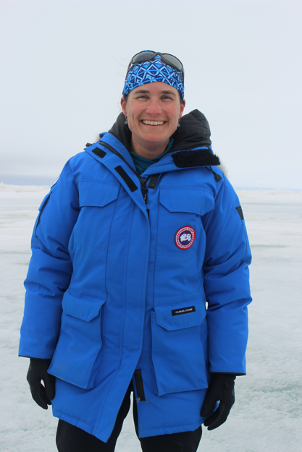
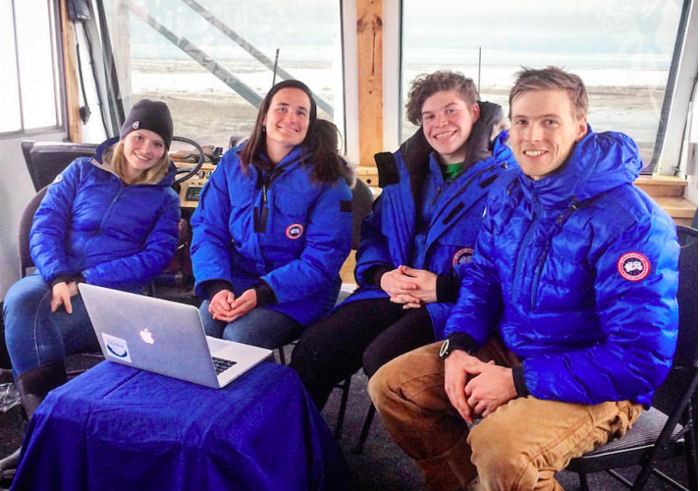
- Christie Bahlai Scientist Profile
- Julia Perrone Scientist Profile
- Grading Rubric
- Digital Data Nugget on DataClassroom
The longest surveys of fireflies known to science was actually started by accident!
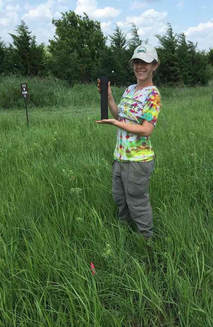
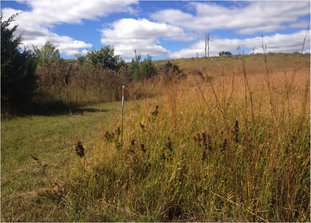
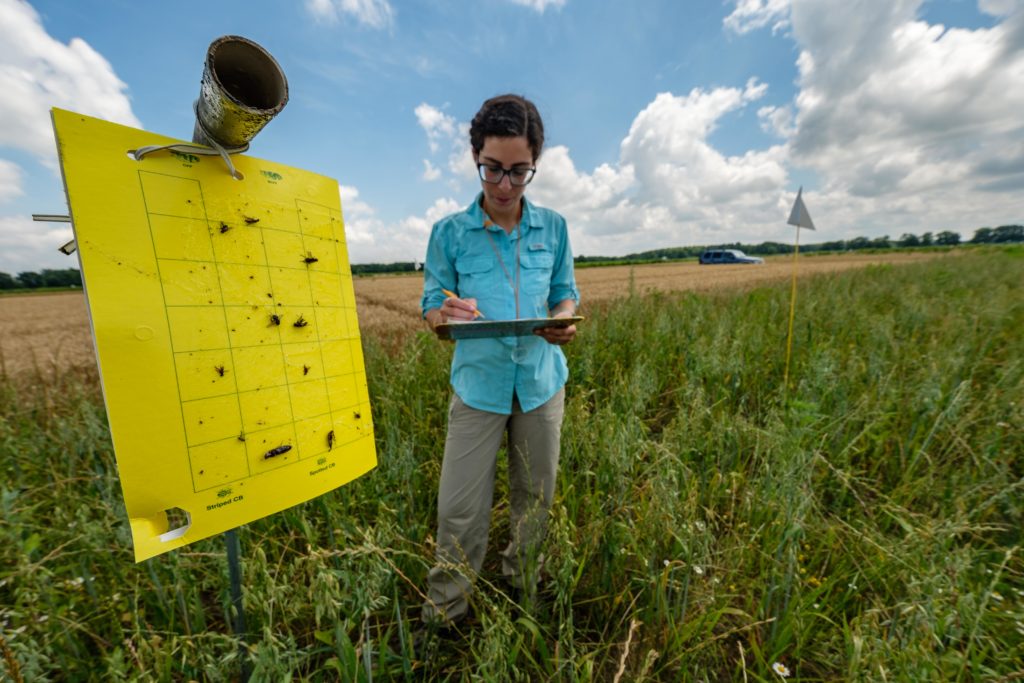
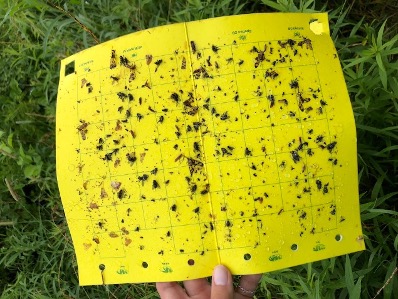
At the Kellogg Biological Station Long-Term Ecological Research Site, scientists work together to answer questions that can only be studied with long-term data. Their focus is to collect data in the same way over many consecutive years to look for patterns through time. One of these long-term studies, looking at lady beetle populations, was developed to keep watch on these important species. To count lady beetles, scientists placed yellow sticky card traps out in the same plots year after year. These data are used to figure out if lady beetle numbers are changing over time.
Because sticky traps catch everything small that flies by, other insect species get stuck as well. One day, a research technician noticed this and decided to add a few new columns to the data sheet. That way they could start recording data on the other insect species found on the sticky traps. Each year the technician kept adding to the record and over time, more and more data were collected. One of those new columns happened to record the number of fireflies caught. Though the exact reason for this data collection is lost to history, scientists quickly realized the value of this dataset!
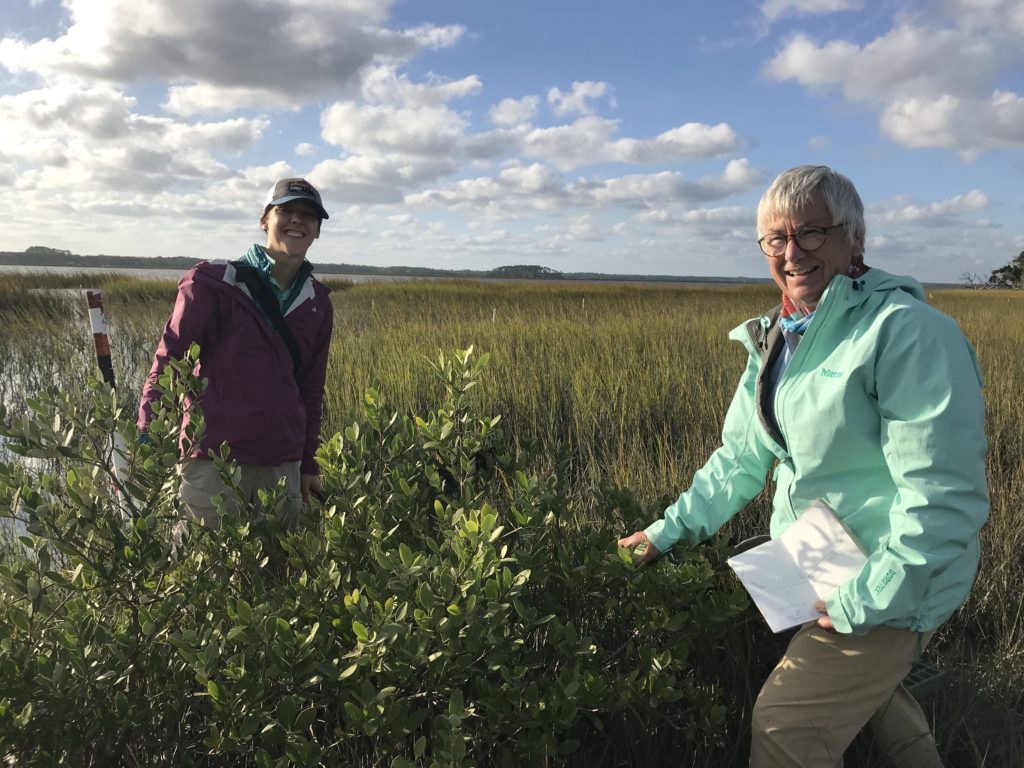
Several years later, Julia became the lab technician. She took over the responsibility of the sticky trap count, adding to the dataset. Christie joined this same lab as a scientist and stumbled upon the data on fireflies that Julia and the previous technician had collected. She wanted to take advantage of the long-term data and analyze whether firefly populations had been increasing or decreasing.
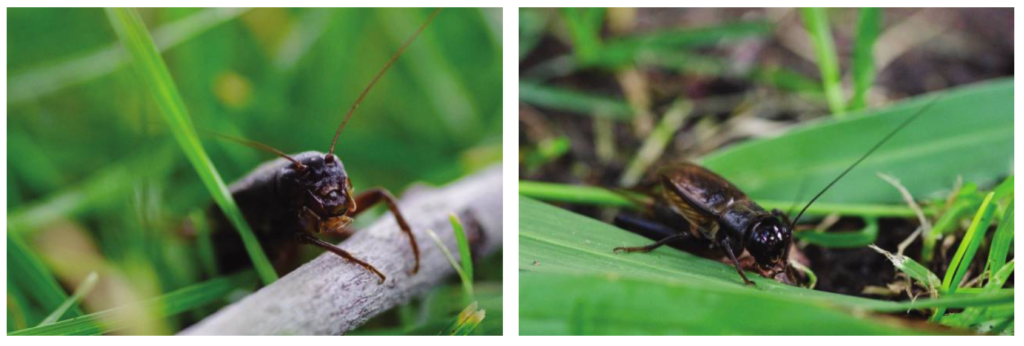
Many people have fond memories of watching fireflies blink across open fields and collecting them in jars as children. This is one of the reasons why fireflies are a beloved insect species. Julia grew up in southwest Michigan and fondly recalls spending summers watching them blink over yards and open fields, catching them in jars to watch them for a little while. Christie did the same in her parent’s yard in rural Ontario! That fondness never really went away and both enjoy watching the fireflies around Northeast Ohio where they currently live. Fireflies are also an important part of the ecosystems where they live. Larvae spend most of their time in the soil and are predators of insects and other small animals, such as snails.
Many scientists and citizens alike have noticed that they aren’t seeing as many fireflies as they used to. Habitat loss and light pollution could be causing problems for fireflies. This is where the importance of long-term data really comes into play. Long-term data are critical to identifying and understanding natural population cycles over long periods of time that we wouldn’t be able to see with just a few years of data. It also gives scientists opportunities to answer unanticipated research questions. In this situation, even though the data were collected without a specific purpose in mind, having the dataset available offered new opportunities! Christie and Julia were able to look at the long-term changes in southwest Michigan firefly populations, something they would not have been able to do before the research technician added those extra columns. In order to start answering this question, they compiled all of the years of firefly data and began to compare the average counts from year to year. Although data were collected in multiple different habitat types, they focused on data from open fields because fireflies use these areas to find mates.
Featured scientists: Christie Bahlai and Julia Perrone from Kent State University. Data from the Kellogg Biological Station Long Term Ecological Research Program – KBS LTER
Flesch–Kincaid Reading Grade Level = 10.7

Additional teacher resources related to this Data Nugget include:
- Paper written by students about the firefly dataset.
- Interview with Christie, exploring her interests in entomology and exploring variability in data!
- Two papers (here and here) relating to the KBS LTER ladybug study from which this data came.
- If you or your students are interested in accessing more of the data behind this Data Nugget, you can recreate the dataset with additional variables in addition to firefly population numbers using R code found in GitHub. This dataset includes things like degree day accumulations, precipitation accumulation, and more.
- Webinar, hosted by Data Nuggets and DataClassroom, exploring the research and data behind this activity.
- Scientist Profile for Julia Perrone on Project Biodiversify
- Video showing a firefly blinking at the KBS LTER