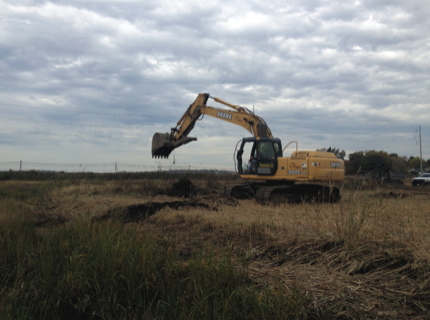
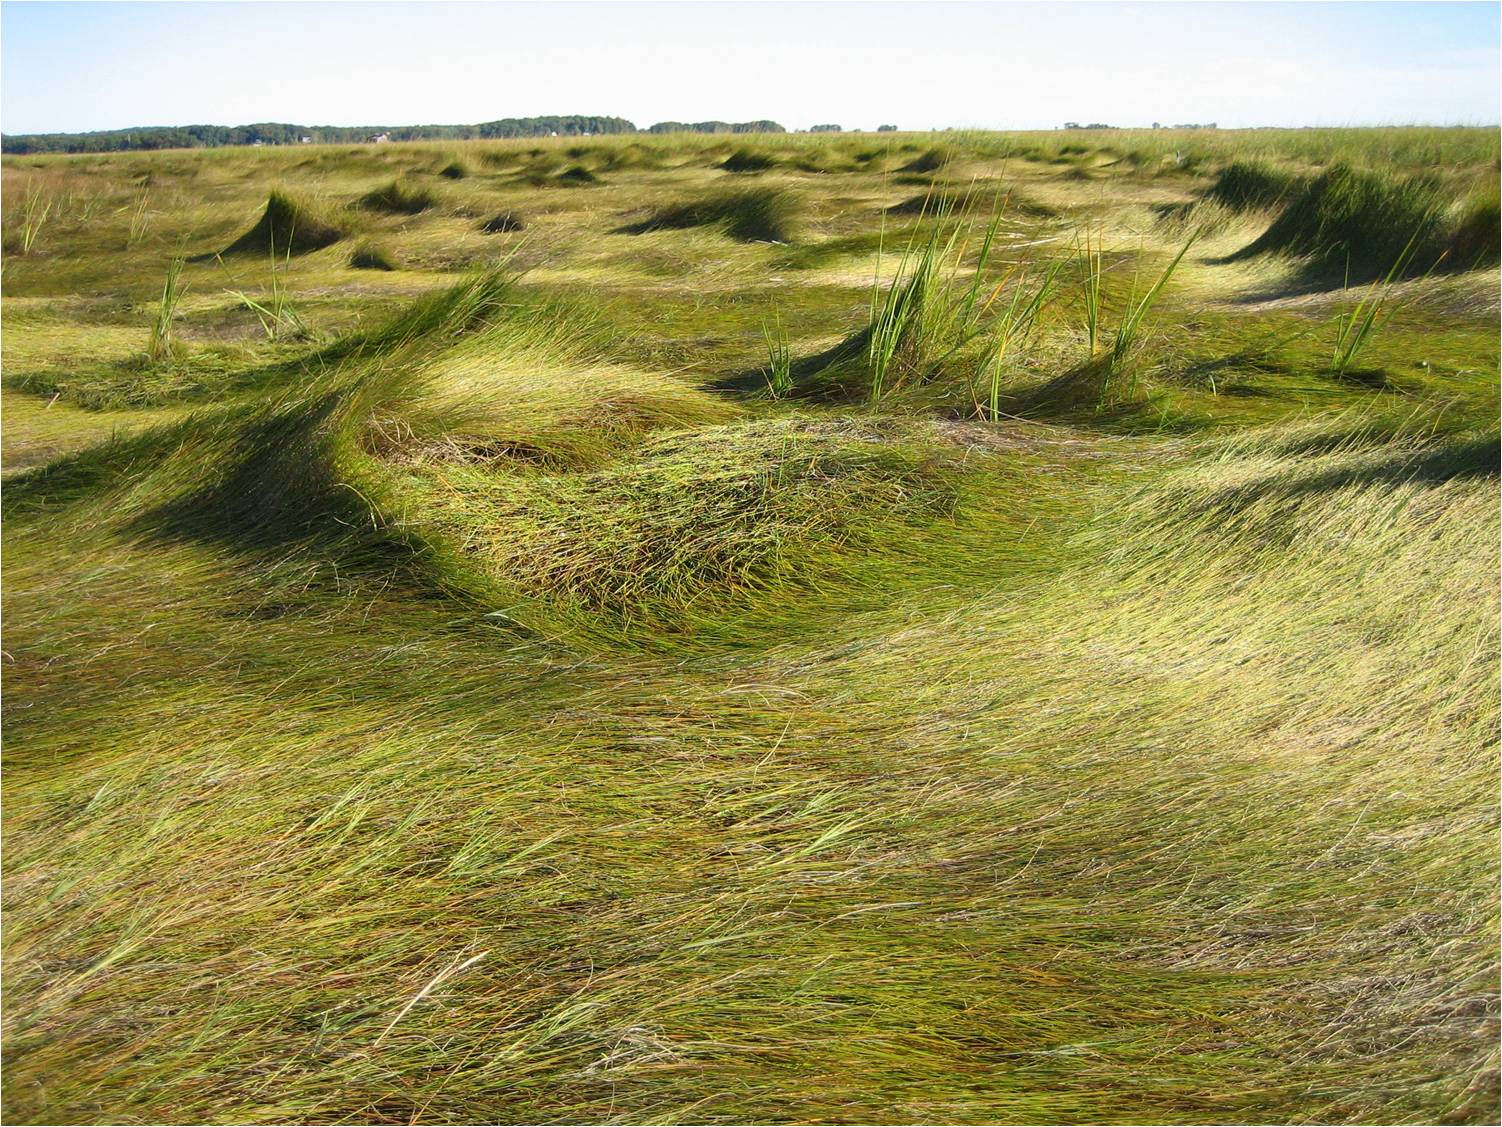
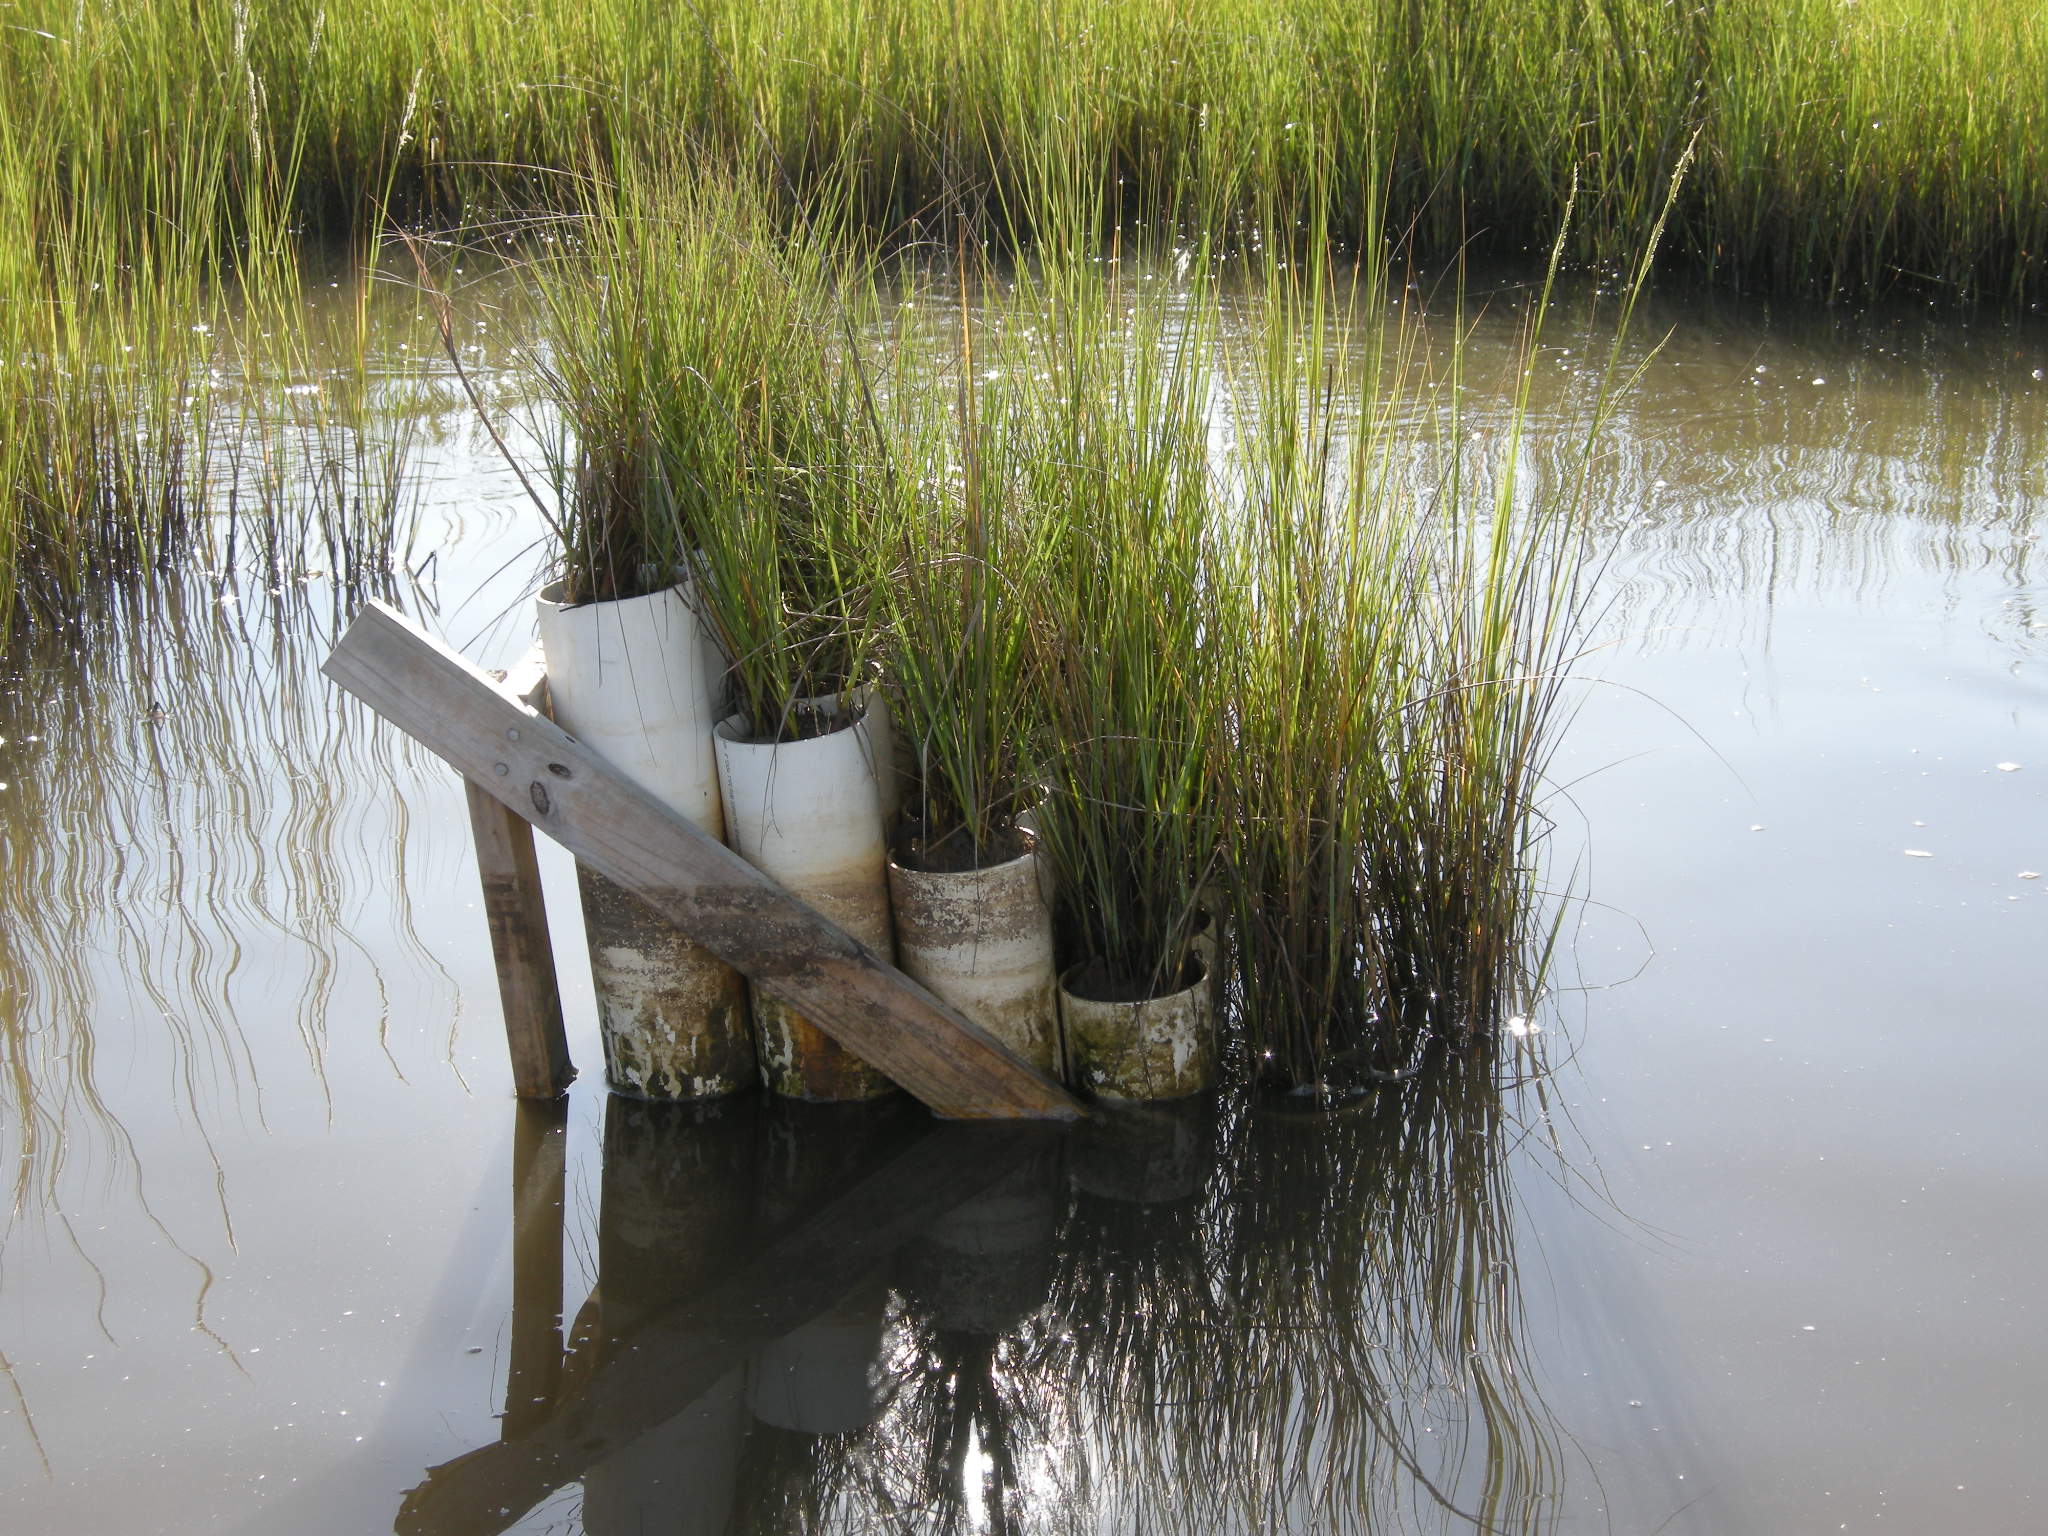
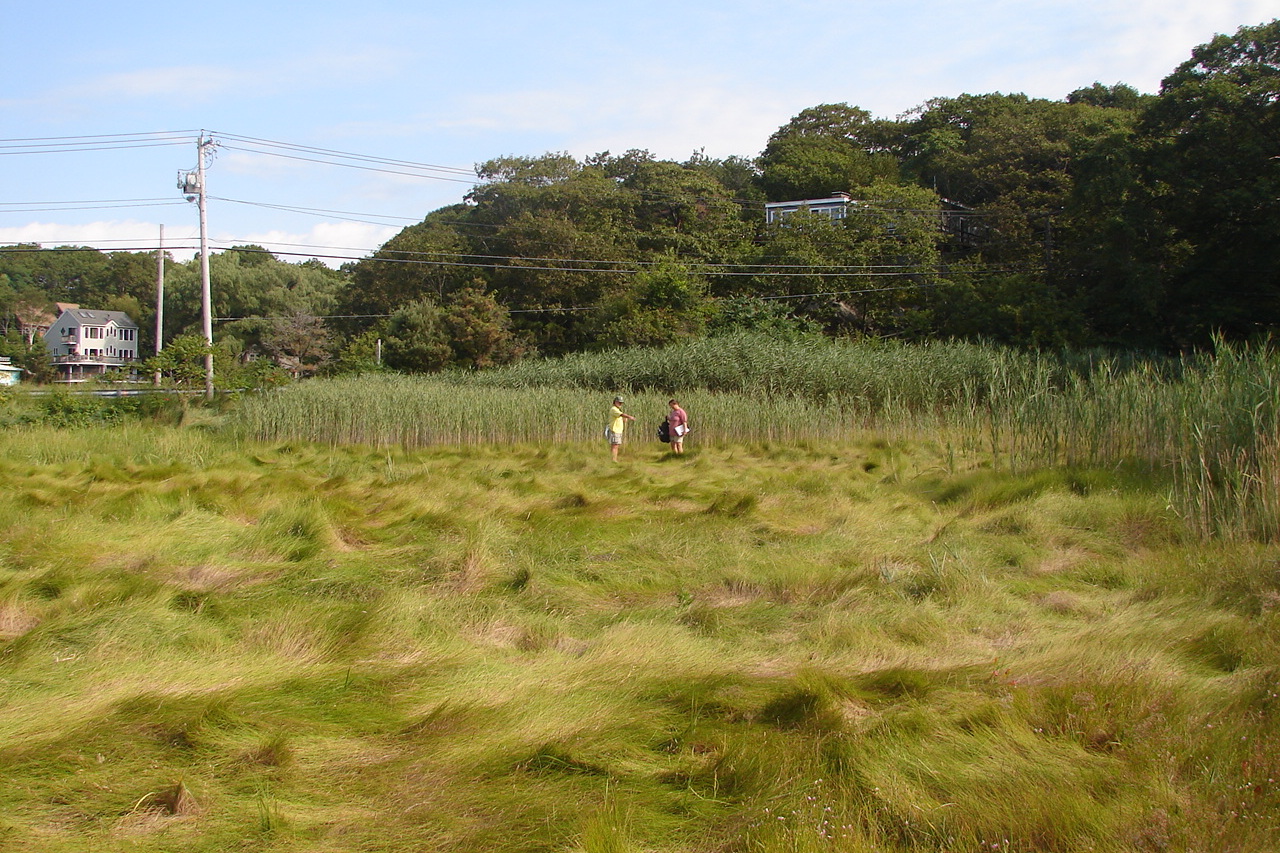
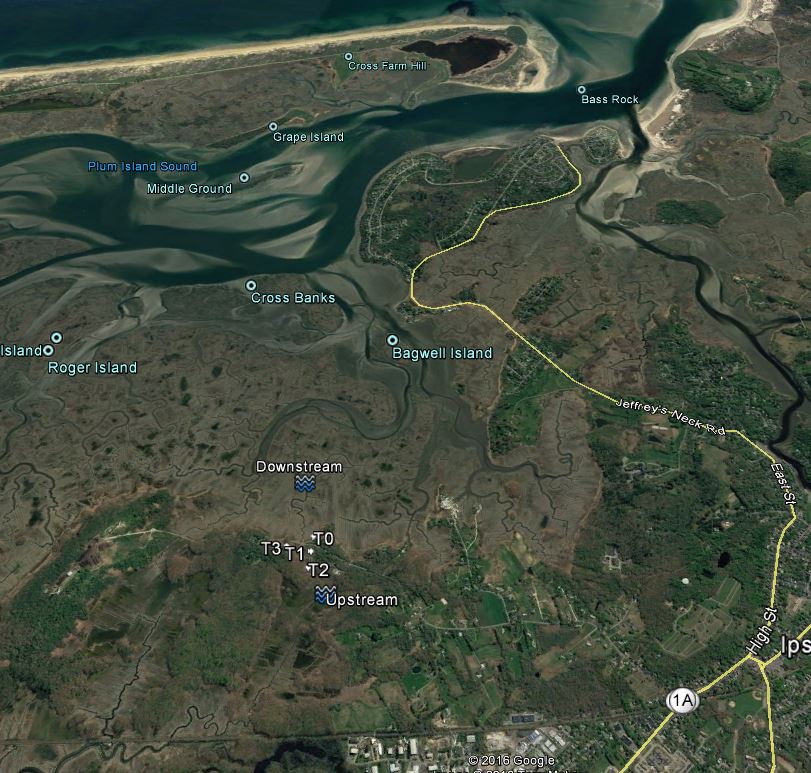
A saltmarsh near Boston, MA being restored after it was degraded by human activity.
The activities are as follows:
- Teacher Guide
- Student activity, Graph Type A, Level 3
- Student activity, Graph Type B, Level 3
- Student activity, Graph Type C, Level 3
- Alternative Graphs
- Grading Rubric
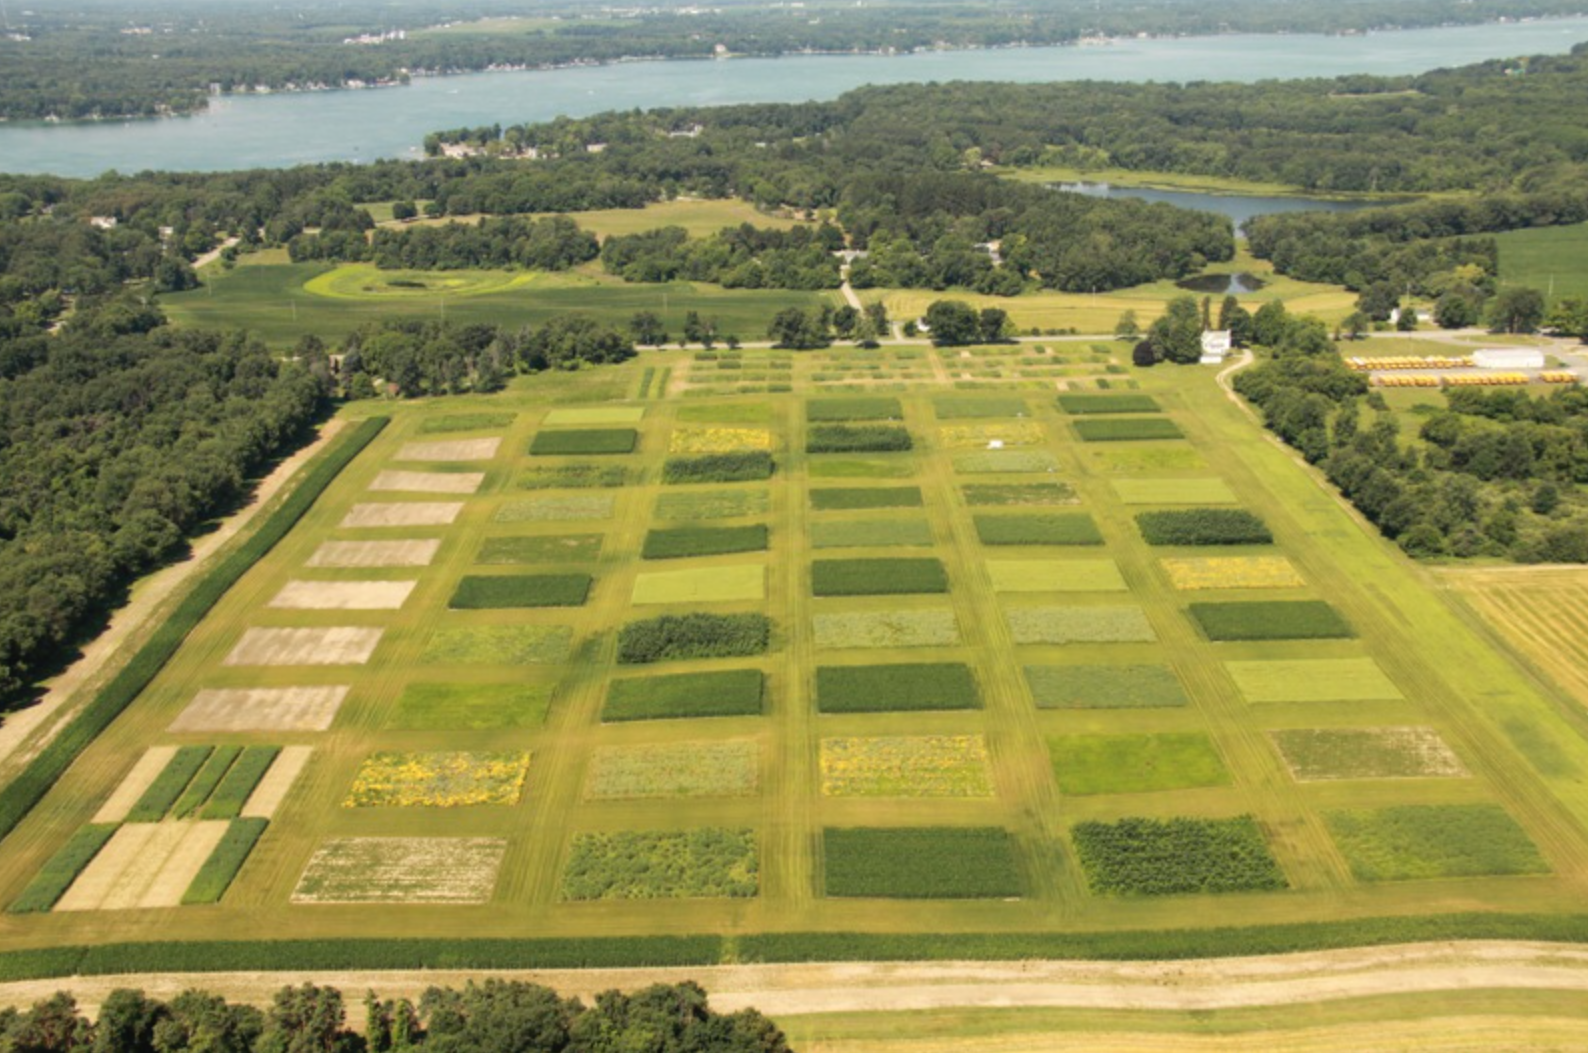
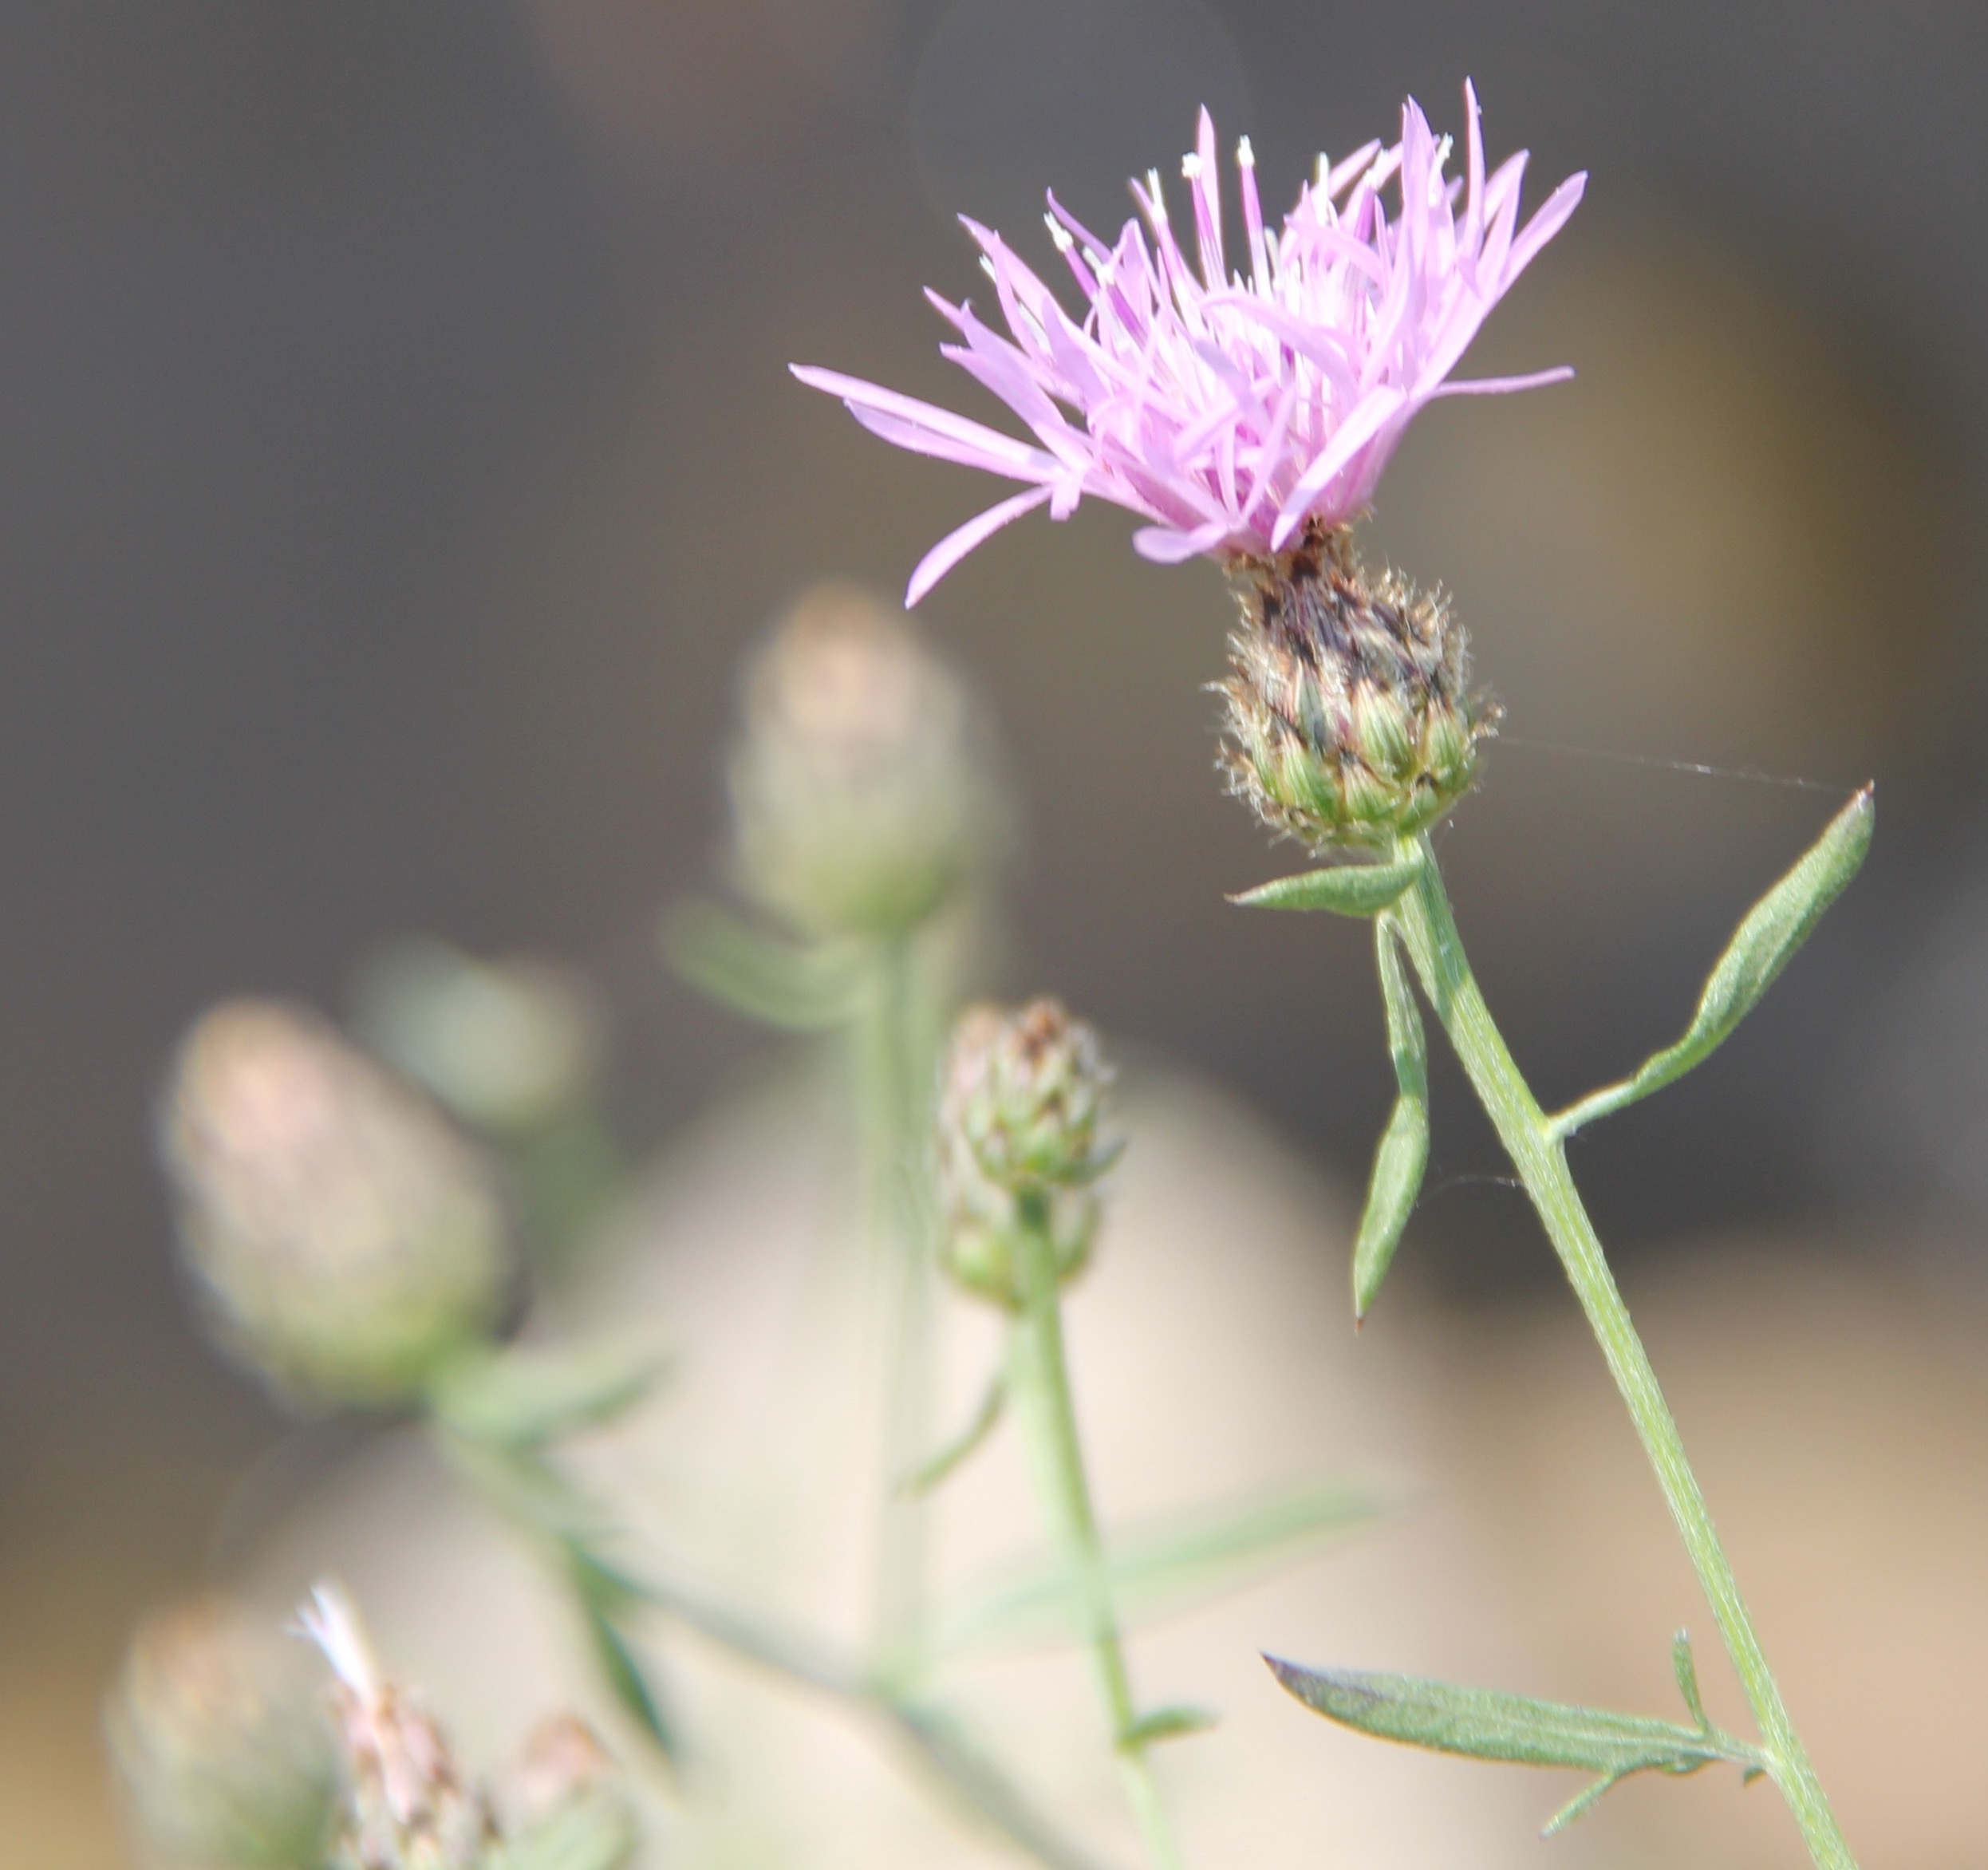
Salt marshes are diverse and productive ecosystems, and are found where the land meets the sea. They contain very unique plant species that are able to tolerate flooding during high tide and greater salt levels found in seawater. Healthy salt marshes are filled with many species of native grasses. These grasses provide food and nesting grounds for lots of important animals. They also help remove pollution from the land before it reaches the sea. The grass roots protect the shoreline from erosion during powerful storms. Sadly today, humans have disturbed most of the salt marshes around the world. As salt marshes are disturbed, native plant biodiversity, and the services that marshes provide to us, are lost.
A very important role of salt marshes is that they are able to store carbon, and the amount they store is called their carbon storage capacity. Carbon is stored in marshes in the form of both dead and living plant tissue, called biomass. Marsh grasses photosynthesize, taking carbon dioxide out of the atmosphere and storing it in plant biomass. This biomass then falls into the mud and the carbon is stored there for a very long time. Salt marshes have waterlogged muddy soils that are low in oxygen. Because of the lack of oxygen, decomposition of dead plant tissue is much slower than it is in land habitats where oxygen is plentiful. All of this stored carbon can help lower the levels of carbon dioxide in our atmosphere. This means that healthy and diverse salt marshes are very important to help fight climate change.
However, as humans change the health of salt marshes, we may also change the amount of carbon being stored. As humans disturb marshes, they may lower the biodiversity and fewer plant species can grow in the area. The less plant species growing in the marsh, the less biomass there will be. Without biomass falling into the mud and getting trapped where there is little oxygen, the carbon storage capacity of disturbed marshes may go down.
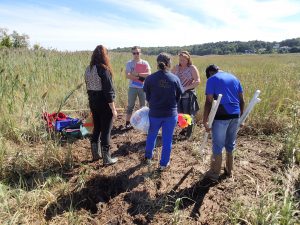
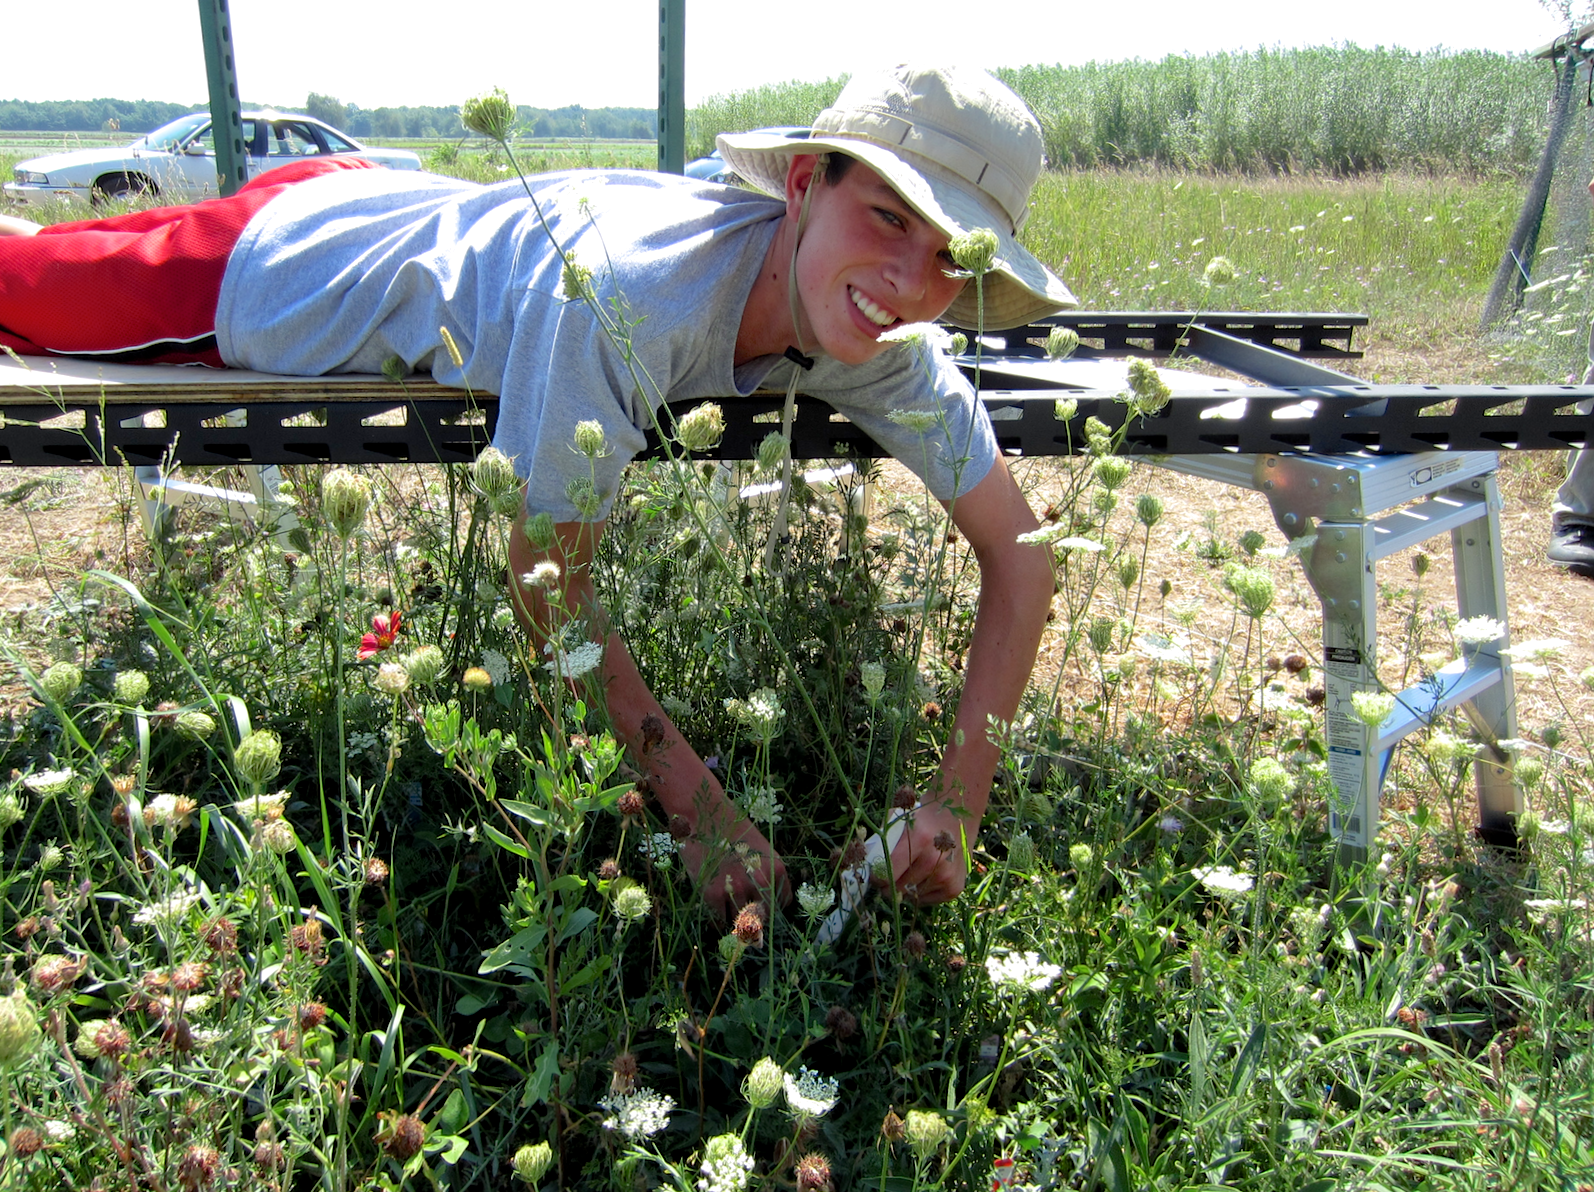
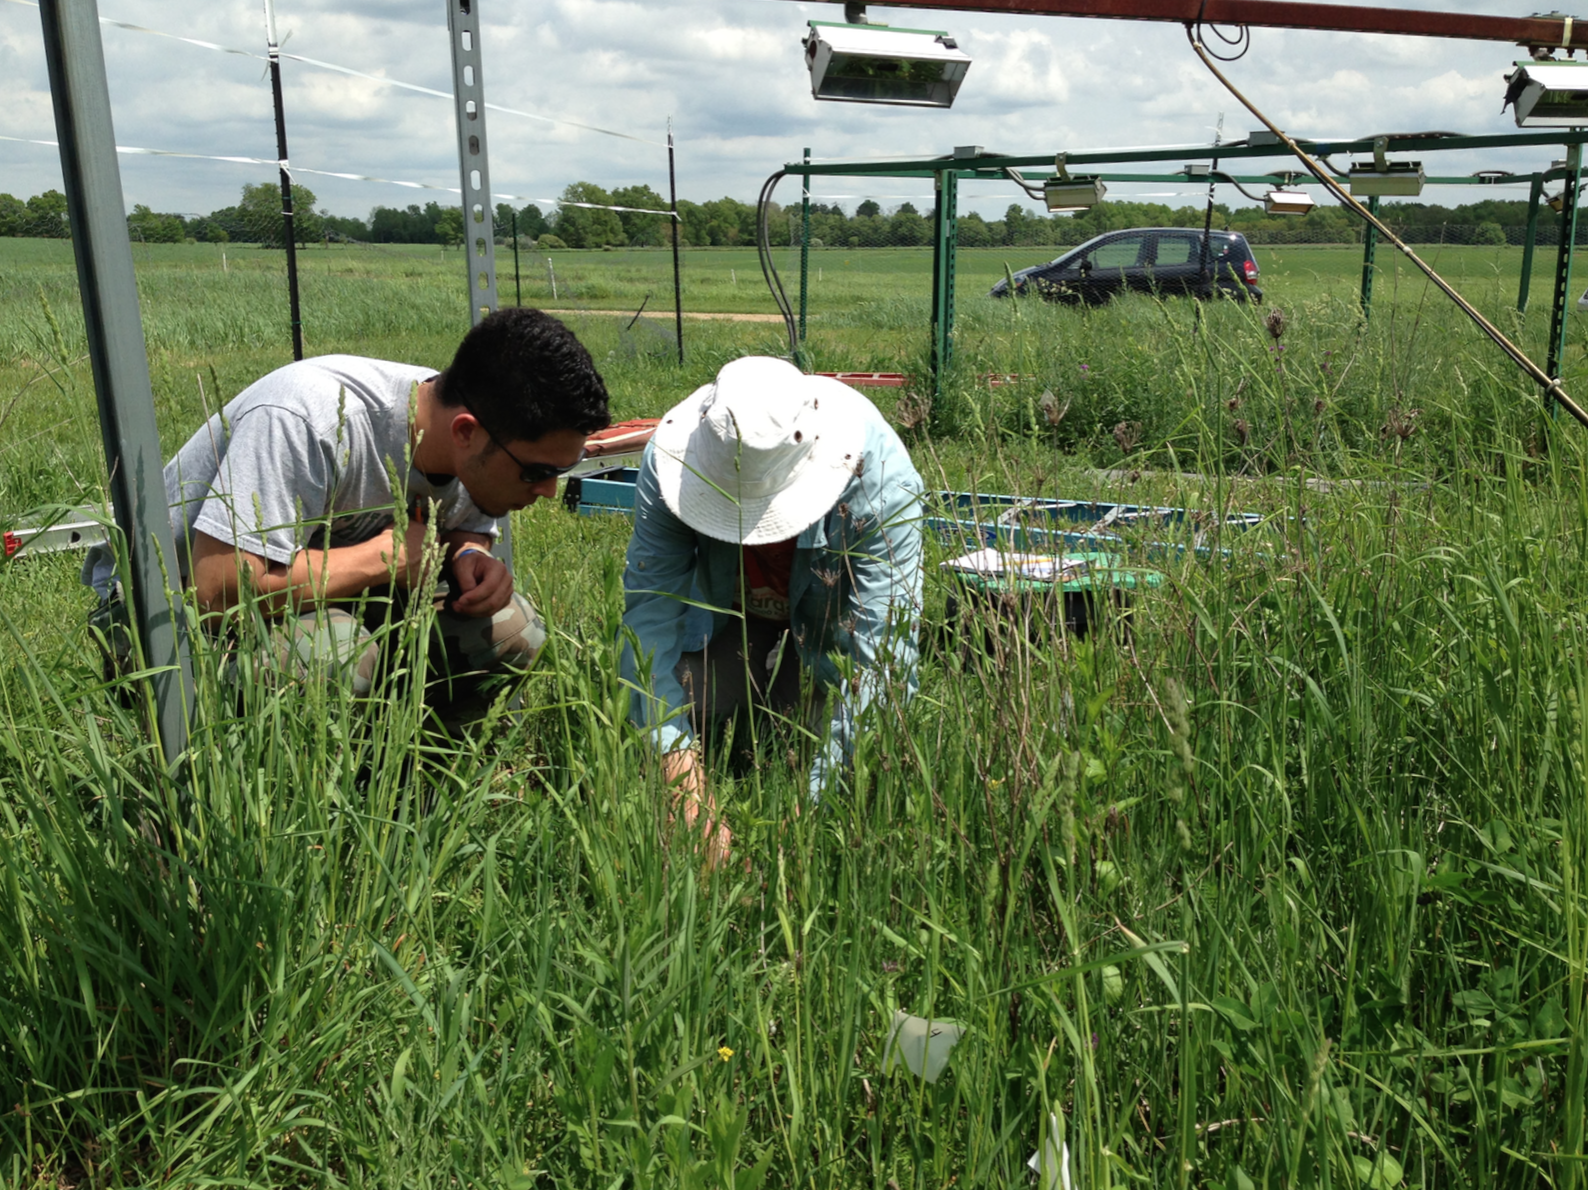
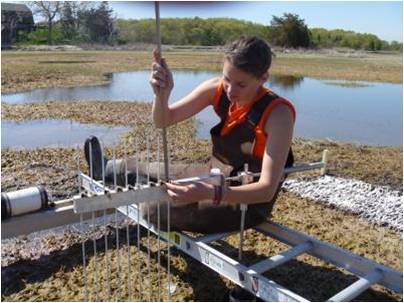
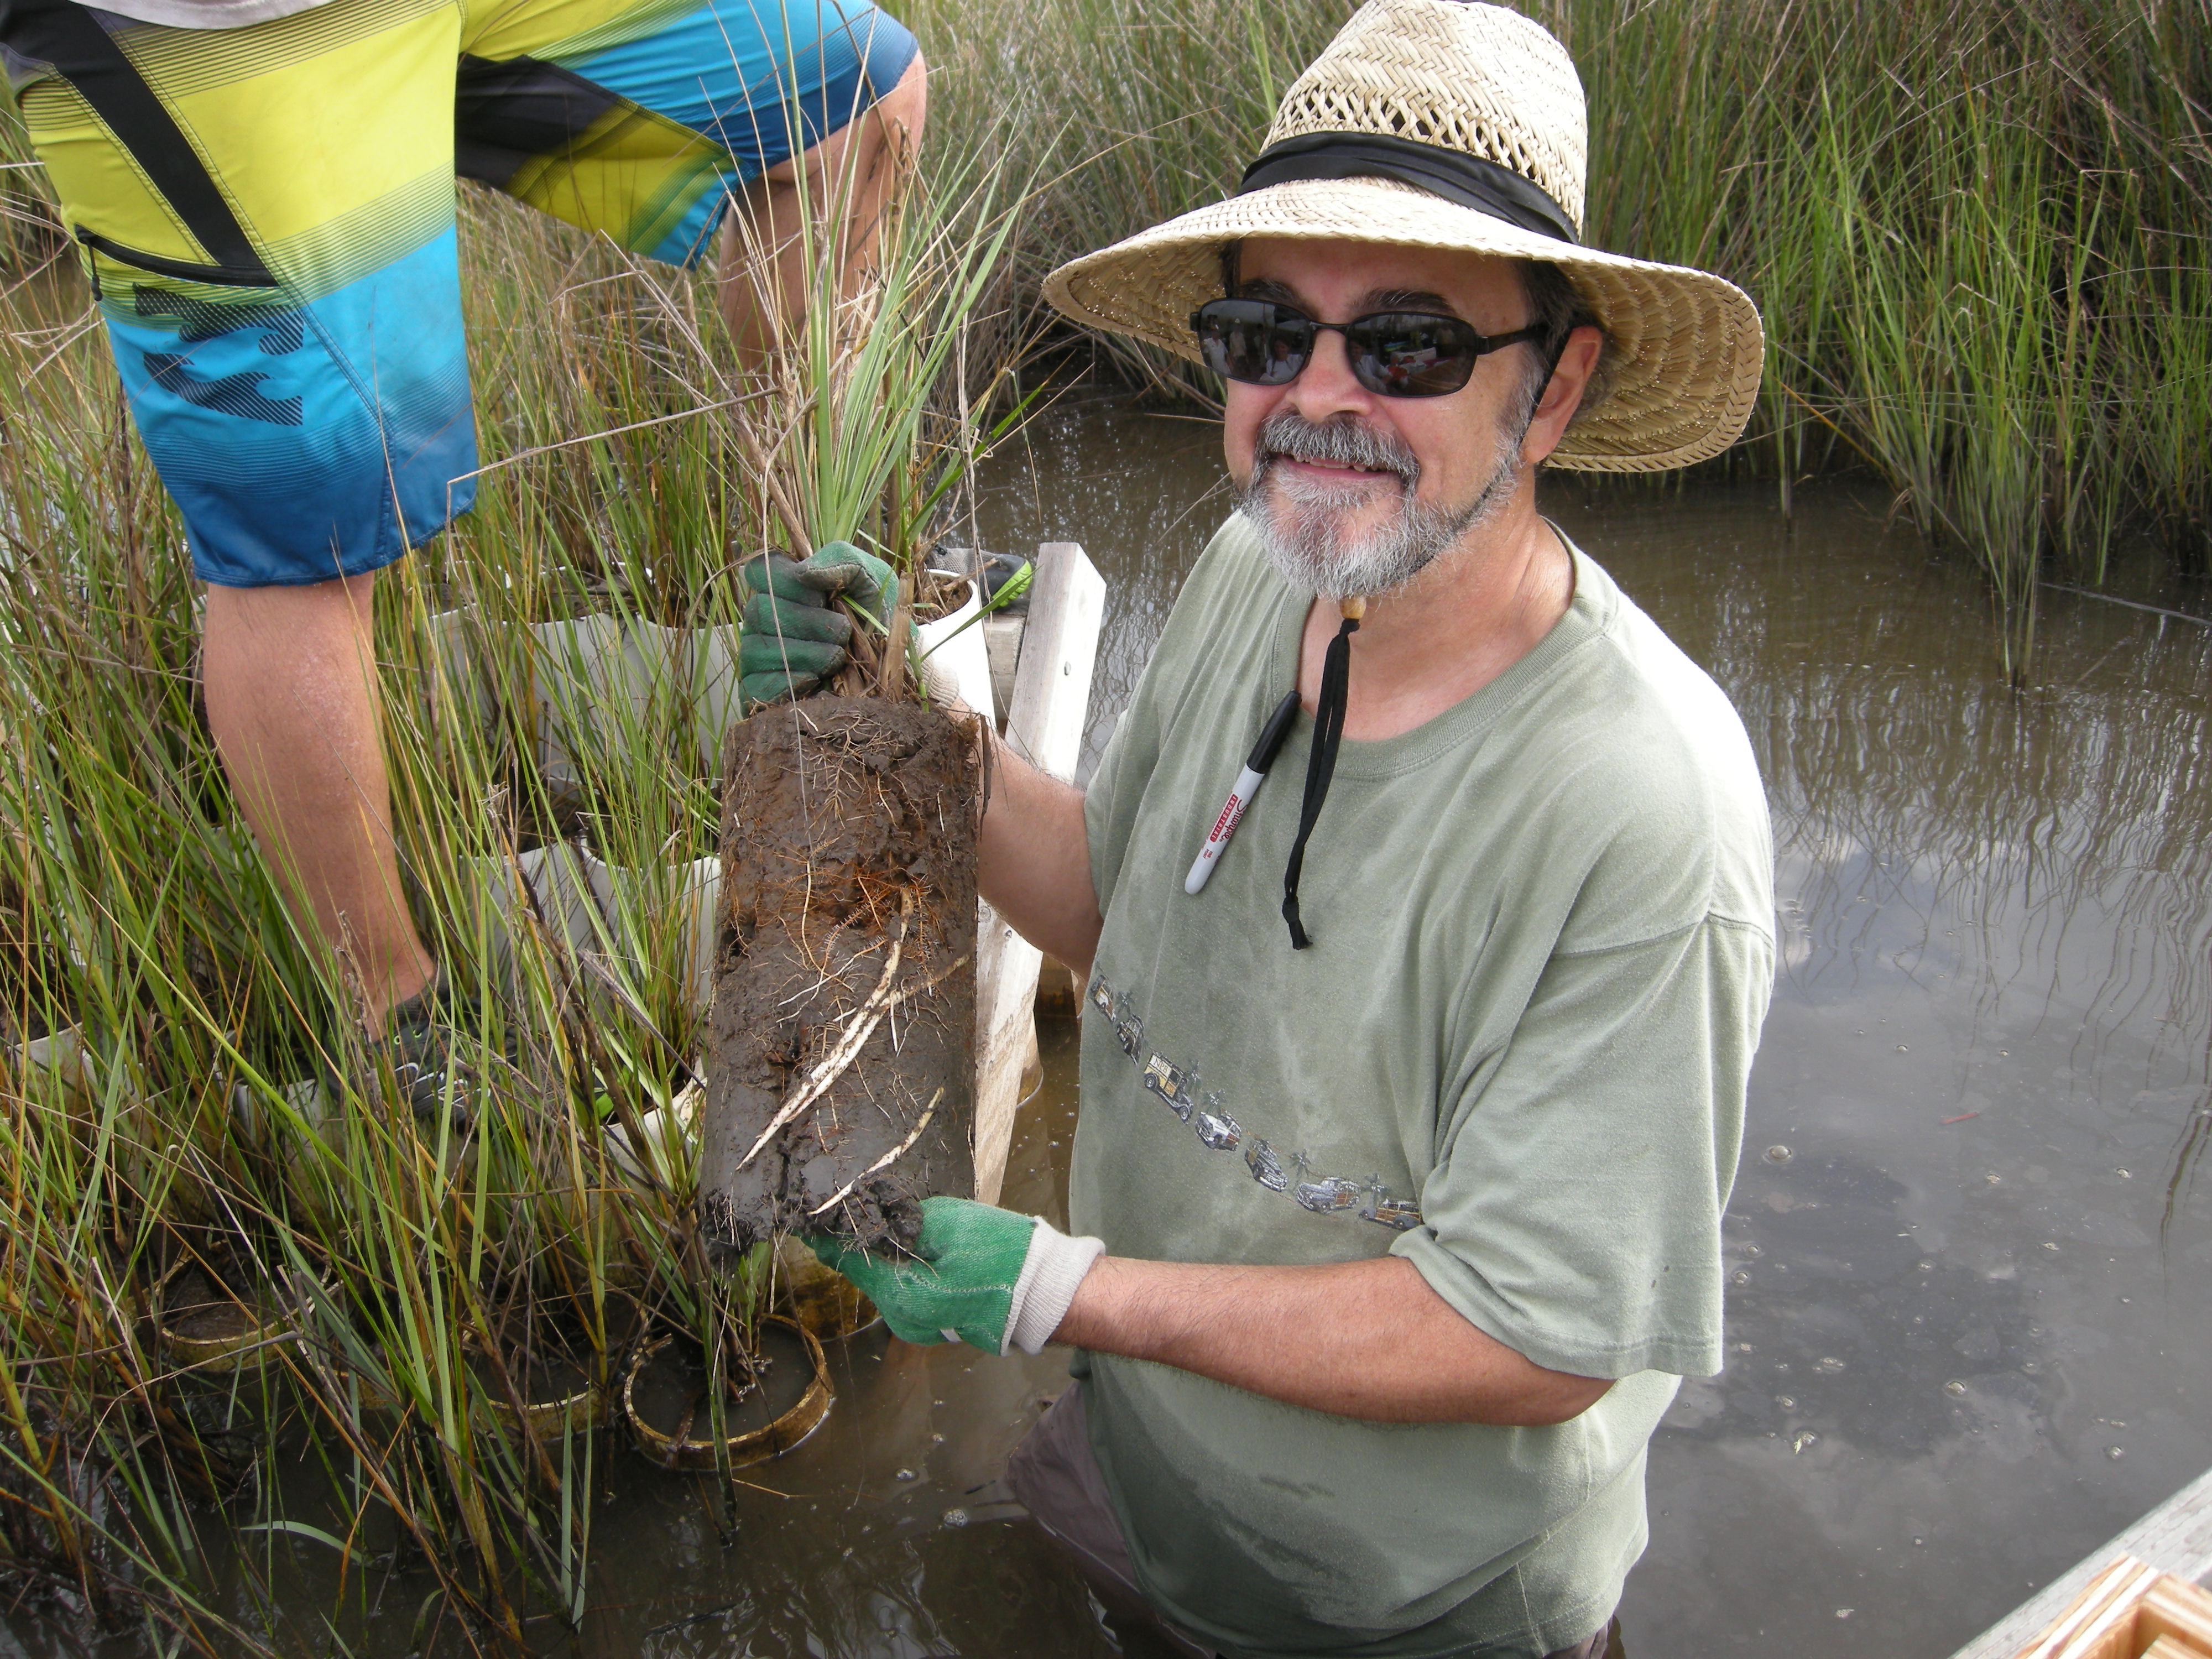
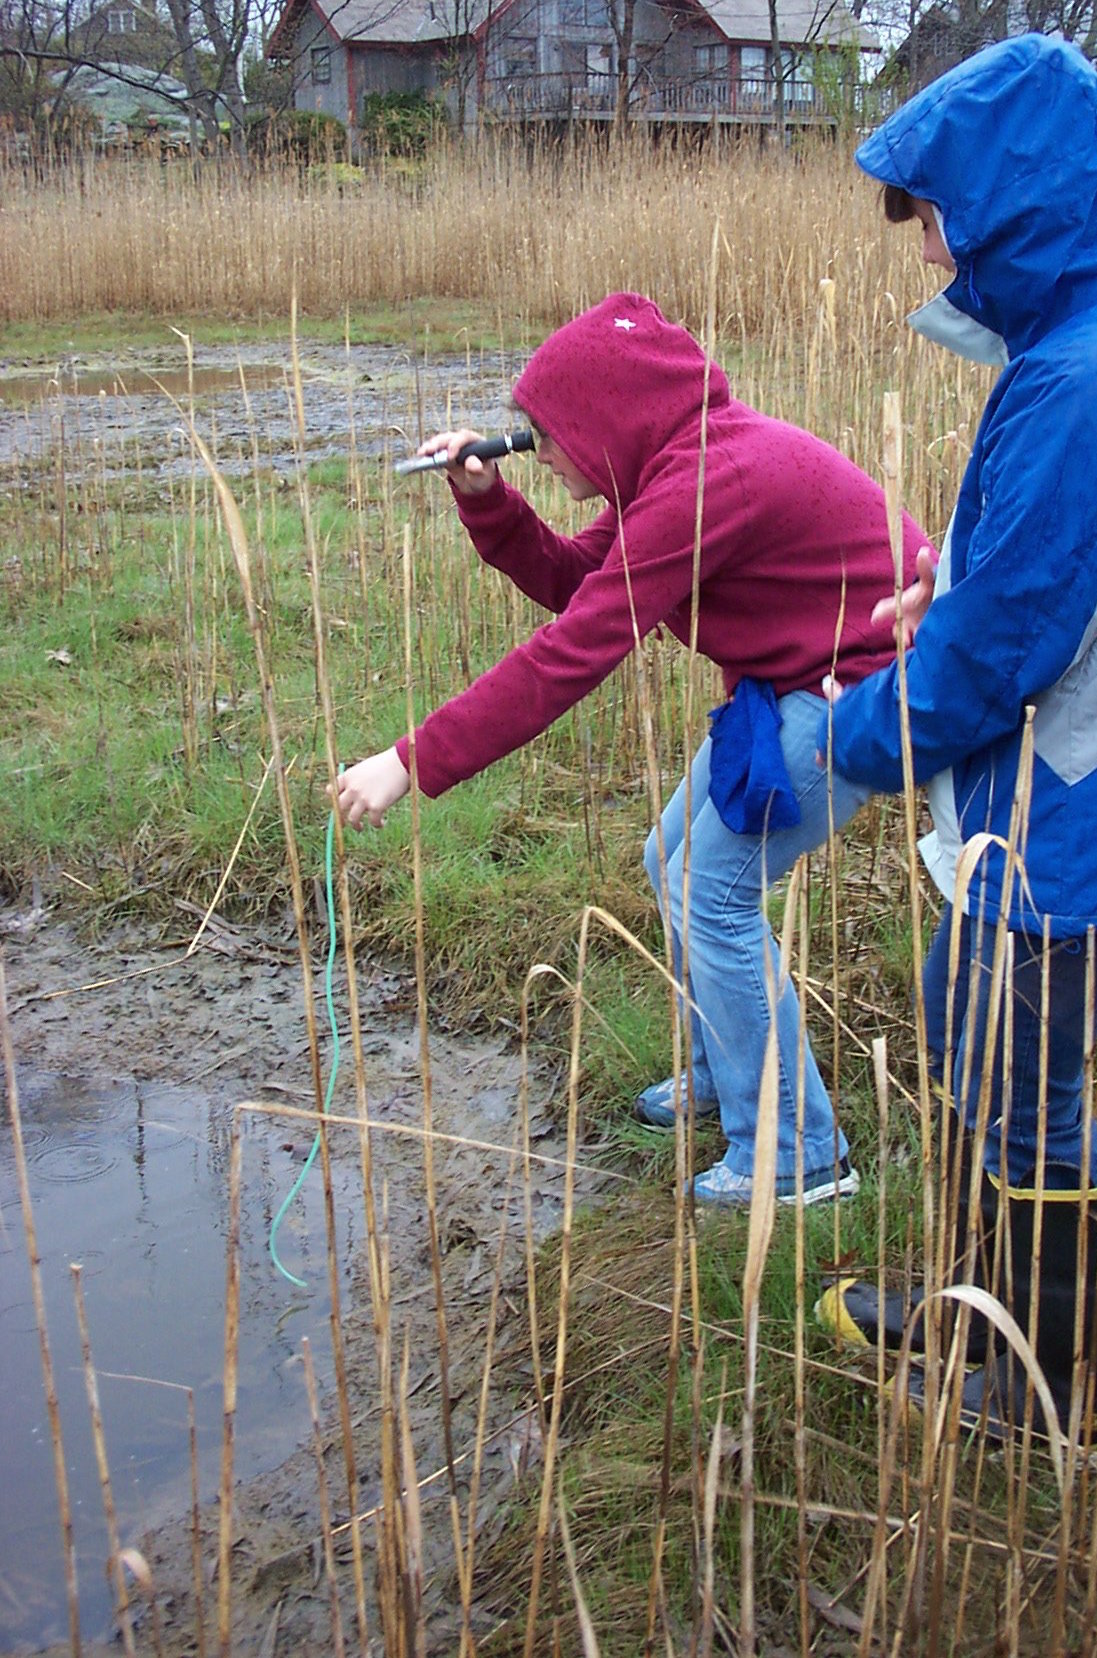
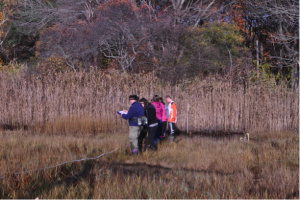
Jennifer, working alongside students, to collect biomass data for a restored saltmarsh.
It is because of the important role that marshes play in climate change that Jennifer, and her students, spend a lot of time getting muddy in saltmarshes. Jennifer wants to know more about the carbon storage capacity of healthy marshes, and also those that have been disturbed by human activity. She also wants to know whether it is possible to restore degraded salt marshes to help improve their carbon storage capacity. Much of her work focuses on comparing how degraded and newly restored marshes to healthy marshes. By looking at the differences and similarities, she can document the ways that restoration can help increase carbon storage. Since Jennifer and her students work in urban areas with a lot of development along the coast, there are lots of degraded marshes that can be restored. If she can show how important restoring marshes is for increasing plant diversity and helping to combat climate change, then hopefully people in the area will spend more money and effort on marsh restoration.
Jennifer predicted that: 1) healthy marshes will have a higher diversity of native vegetation and greater biomass than degraded salt marshes, 2) restored marshes will have a lower or intermediate level of biomass depending on how long it has been since the marsh was restored, and 3) newly restored marshes will have lower biomass, while marshes that were restored further in the past will have higher biomass.
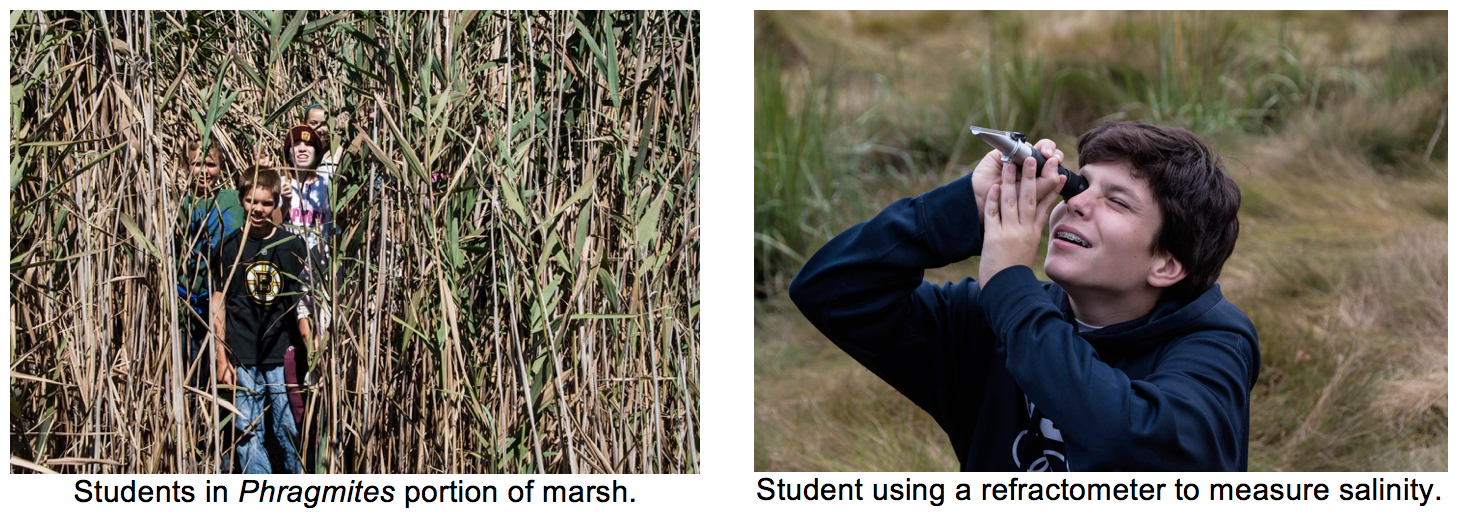
To test her predictions, Jennifer studied two different salt marshes near Boston, Massachusetts, called Oak Island and Neponset. Within each marsh she sampled several sites that had different restoration histories. She also included some degraded sites that had never been restored for a comparison. Jen measured the total number of different plant species and plant biomass at multiple locations across all study sites. These measurements would give Jen an idea of how much carbon was being stored at each of the sites.
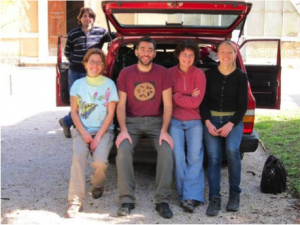
Featured scientist: Jennifer Bowen from Northeastern University


 This Data Nugget was adapted from a data analysis activity developed by the Great Lakes Bioenergy Research Center (GLBRC). For a more detailed version of this lesson plan, including a supplemental reading, biomass harvest video and extension activities,