The activities are as follows:
- Teacher Guide
- Student activity, Graph Type A, Level 3
- Student activity, Graph Type B, Level 3
- Student activity, Graph Type C, Level 3
- PowerPoint of images
- Scientist Profile on Project Biodiversify
- Scientist Profile
- Grading Rubric
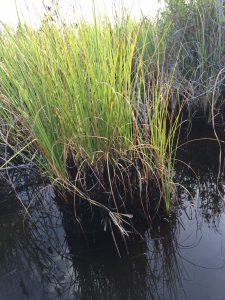
The Arctic, Earth’s region above 66° 33’N latitude, is home to a unique biome, known as tundra. A defining trait of tundra ecosystems is the frozen land. Permafrost is the underground layer of organic matter, soil, rock, and ice that has been frozen for at least 2 full years. Plant material decays slowly in the Arctic because of the cold temperatures. Building up over thousands of years, the plants become frozen into the permafrost. Permafrost represents a very large “sink” of dead plant material, nutrients, and soil that is locked away in a deep freeze.
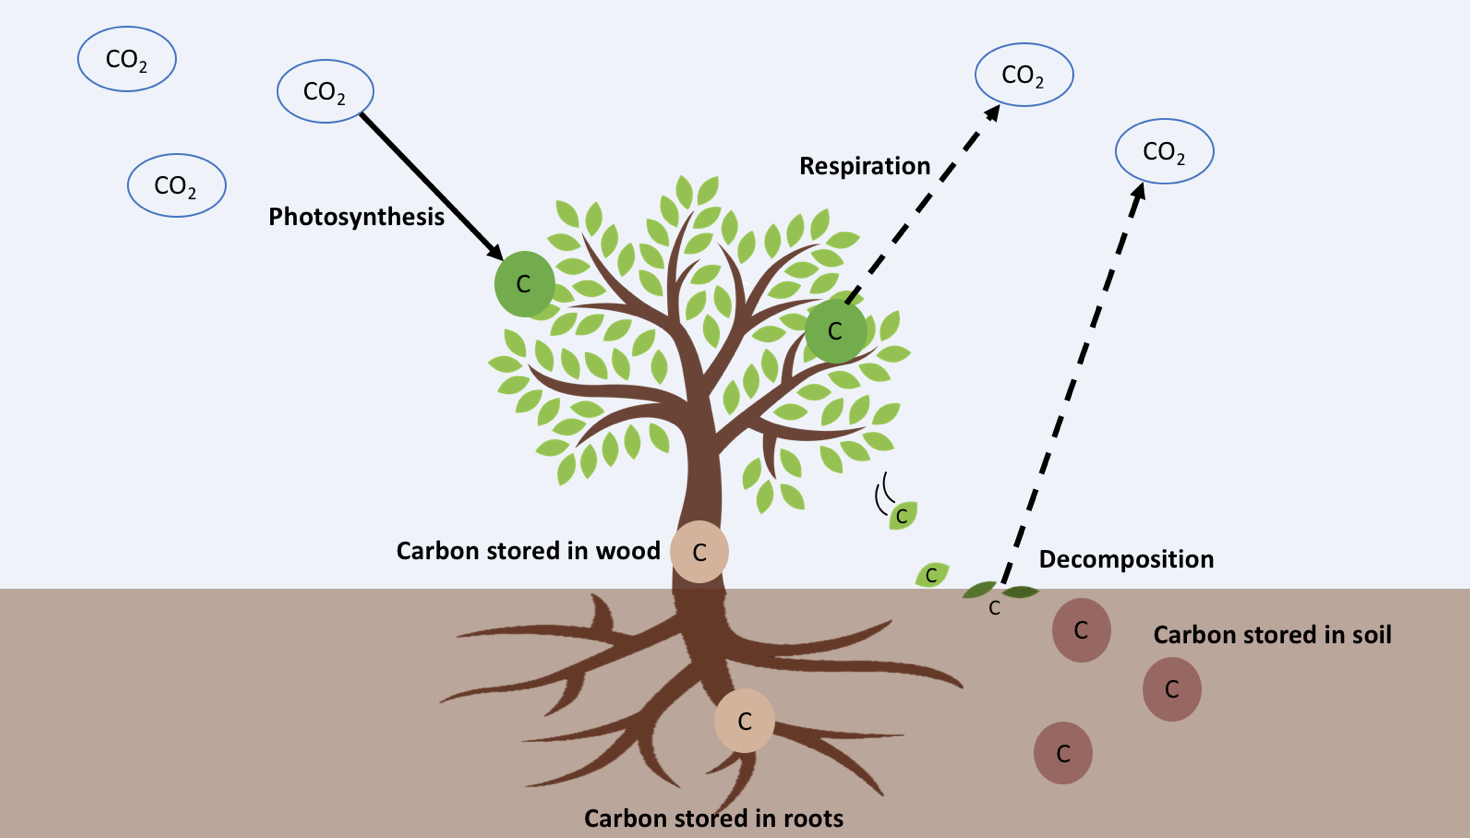
Though the Alaskan Arctic may seem far away from where you live, tundra permafrost is important for the entire globe. During the past few thousand years, Earth’s climate has naturally changed a little over time, but because humans are adding greenhouse gases to the atmosphere, the average global temperature may increase by as much as 2 to 4oC over the next century. As a result of global climate change, permafrost has become less stable. By causing warmer and wetter conditions in the Arctic, thawing permafrost soils release ancient material that was previously frozen and locked away. Two important materials are dissolved nitrogen (N), which is a nutrient critical for plant growth, and carbon (C), which is stored in plant matter during photosynthesis. These released materials can be used again by plants, but some is carried away as melted water flows from the land into rivers and streams. You can imagine N and C in permafrost like a bank account where the landscape is the savings account. The land slowly deposits or withdraws N and C from the savings account, while the water receives any excess N and C that the land does not save.
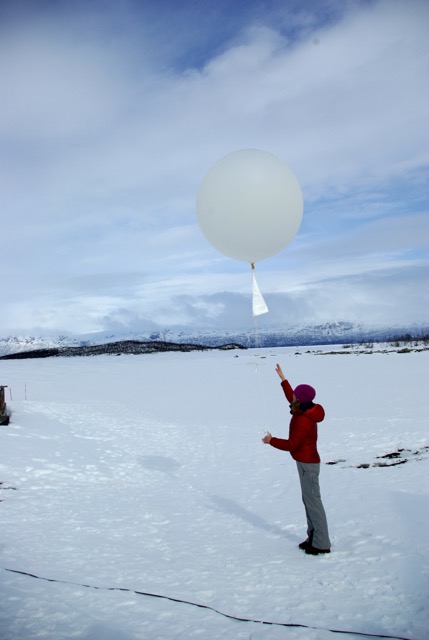
The water that melts as permafrost thaws flows into a stream, ultimately ending up in an ocean. Watersheds are the network of streams and rivers that flow to a single point as they empty out into the ocean. The water at the end of the watershed therefore reflects all the changes that happened across a large area. Scientists use Arctic watersheds as large “sensors” to understand how and when landscapes may be releasing material from thawing permafrost.
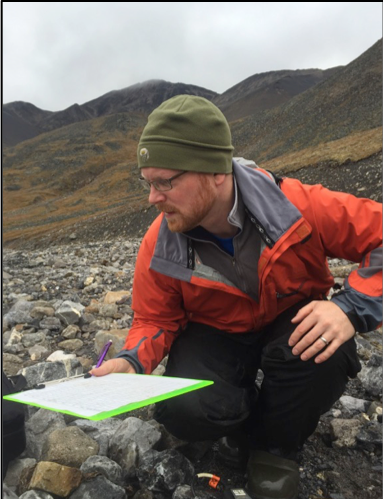
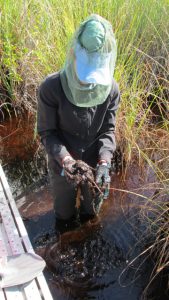
Because the Alaskan Arctic is a vast, sparsely populated area, scientists often rely on established field stations to conduct experiments, collect observational data, and develop new understanding of Arctic ecosystems. One of these field sites is Toolik Field Station. Scientists working at Toolik have been monitoring terrestrial and aquatic Arctic ecosystems since the late 1970s.
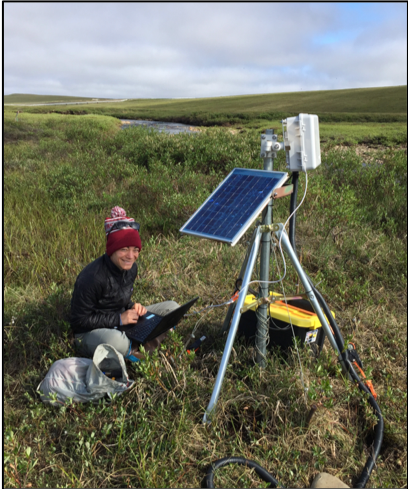
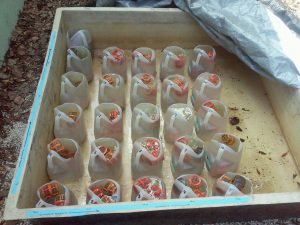
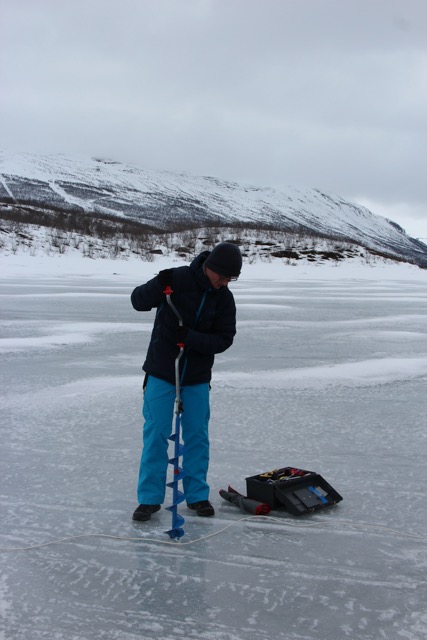
Arial and Jay are aquatic scientists who work at Toolik. They are interested in how Arctic watersheds respond to climate change. Together, Arial and Jay act like ecosystem accountants: they use the chemistry within the water to monitor changes in ecosystem budgets of C and N. Arial and Jay used both historic data and water quality sensors deployed in 2017 and 2018 to monitor the N and C budget in the Kuparuk River. They use this data to calculate how much N and C the river is spending. They measure this as the total export in units of mass per year. This mass per year is determined by multiplying concentration (mass/volume) by flow (volume/day) and adding these values across the whole season (mass/year). These budgets at the watershed outlet help reveal signals of how this tundra landscape may be changing. In this way, they can assess if the landscape savings account for N and C is being depleted due to climate change.
Featured scientists: Arial Shogren and Jay Zarnetske from Michigan State University
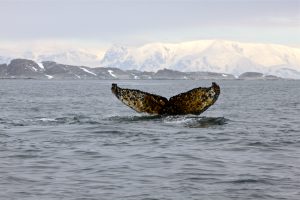
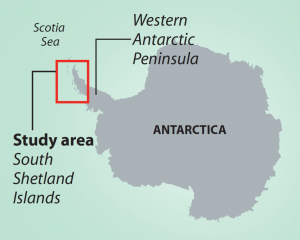 One geographic area that was over-exploited during times of high whaling was the South Shetland Islands along the Western Antarctic Peninsula (WAP). The WAP is in the southern hemisphere in Antarctica. Humpback whales migrate every year from the equator towards the south pole. In summer they travel 25,000 km (16,000 miles) south to WAP’s nutrient-rich polar waters to feed, before traveling back to the equator in the winter to breed or give birth. Today the WAP is experiencing one of the fastest rates of regional climate change with an increase in average temperatures of 6° C (10.8° F) since 1950. Loss of sea ice has been documented in recent years, along with reduced numbers of krill along the WAP.
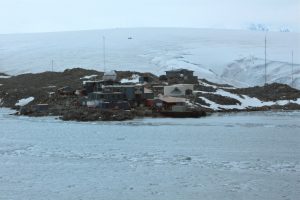

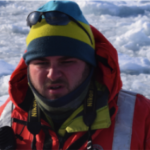
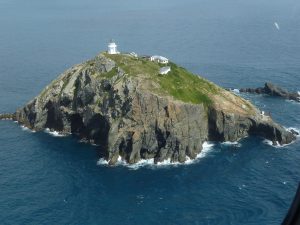
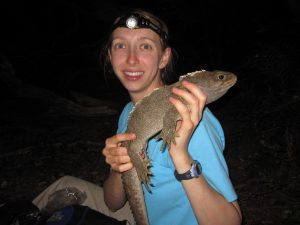
 About Kristine: Kristine L. Grayson is an Associate Professor in the Biology Department at University of Richmond, where she teaches Intro Ecology/Evolution, Field Ecology, Ecophysiology, and
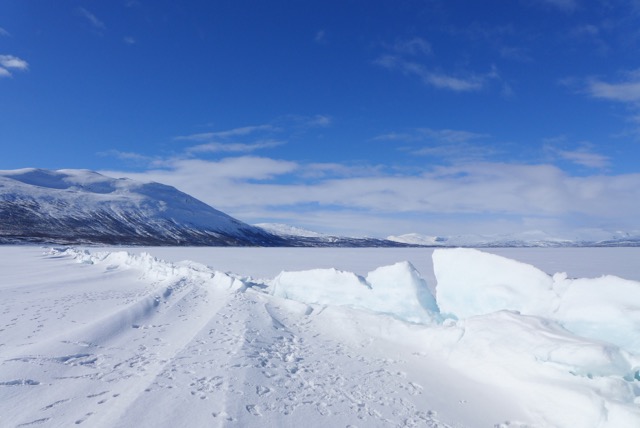


