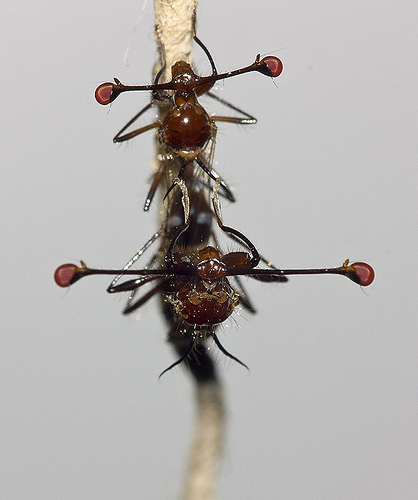
In the wild, animals compete for limited resources. Things like food, water, shelter, and even reproductive mates can be hard to come by. Animals with traits and behaviors that make them more likely to survive and reproduce are said to have higher evolutionary fitness. Some animals have evolved special traits that advertise their fitness to potential mates. Male deer, elk, and moose have large antlers that they use to compete with other males, which demonstrates their fitness to females. Another interesting example is the stalk-eyed flies, in which the males grow long eye stalks to attract a mate. In these cases, females are more likely to choose males with the biggest traits.
Scientists have long predicted that these traits come with both benefits and costs. Large antlers or eyestalks may help a mate notice you, but also come with some costs. Extra weight takes more energy to move around and could make it more difficult to escape from predators. And yet, many studies have failed to find any measurable costs to males having these seemingly impractical traits.
This scientific mystery puzzled Jerry and John, who study stalk-eyed flies. They had failed to identify and document any costs to having longer eyestalks, measured as the distance between the eyes, or eyespan. Common sense told them that having longer eye stalks should make flying more awkward for these flies. However, their data did not support this hypothesis. “When I started collecting data, I focused a lot on the performance costs and got kind of fixated on that,” John says of the team’s initial research. “It was frustrating when we couldn’t identify any actual decline in performance.”

The team began looking for an alternative explanation. They read about research supporting a new idea in a completely different kind of flying animal – barn swallows. Male barn swallows have long, ornate tails. These tails make male barn swallows less aerodynamic during flight. But males have also evolved to have larger wings relative to their body size. This could help them compensate for the extra burden associated with their long tails.
Jerry and John wondered if a similar thing might be at work in stalk-eyed fly wings. Perhaps the male stalk-eyed flies, like male barn swallows, had evolved to have larger wings relative to their body size to help them compensate for long eye stalks when flying. If this were the case, then they expected to see a positive correlation between wing size and eyespan. Could this be why they were unable to measure any disadvantage associated with having longer, more awkward eye stalks? In other words, male stalk-eyed flies with larger wings would be able to support longer eye stalks.
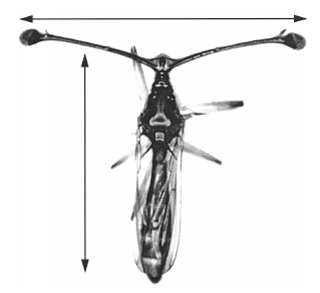
Jerry, John, and their team decided to test their new hypothesis by raising stalk-eyed flies in the lab to maturity, then collecting data about their body length, eyespan, and wing area.
To account for natural variation in body size among stalk-eyed flies, the team needed to use “relative” measurements based on body size. With these kinds of measurements, a value of zero (0) means that wing size or eyespan is exactly what you would predict for a fly of that body size. Negative values mean that wing size or eyespan are smaller than you would predict for that body size, while positive values mean that wing size or eyespan is greater than you would predict for that body size. For example, if a fly has a relative eyespan of -0.010, then the distance between the eyestalks was 0.010 millimeters shorter than expected based on its body size.
Featured scientists: Jerry Husak from the University of St. Thomas and John Swallow from the University of Colorado-Denver. Written by: Sam Holloway
Flesch–Kincaid Reading Grade Level = 8.8
Additional teacher resources related to this Data Nugget include:
You can find lessons to accompany many of John’s studies with insects on the Data Nuggets website! Check out the following Data Nugget activities!
- The triggers that stimulate ant colonies fight with one another
- how brain chemicals influence the outcome of male battles for mates
- how long eye stalks affect the physics of flight
- whether longer eyestalks make the flies more vulnerable to predation
A peer-reviewed journal article: Husak, J. F., Ribak, G., Wilkinson, G. S., & Swallow, J. G. 2011. Compensation for exaggerated eye stalks in stalk‐eyed flies (Diopsidae). Functional Ecology, 25(3), 608-616.
A video of a stalk-eyed fly in flight: