Search Results for: lter

Catching fish with sound

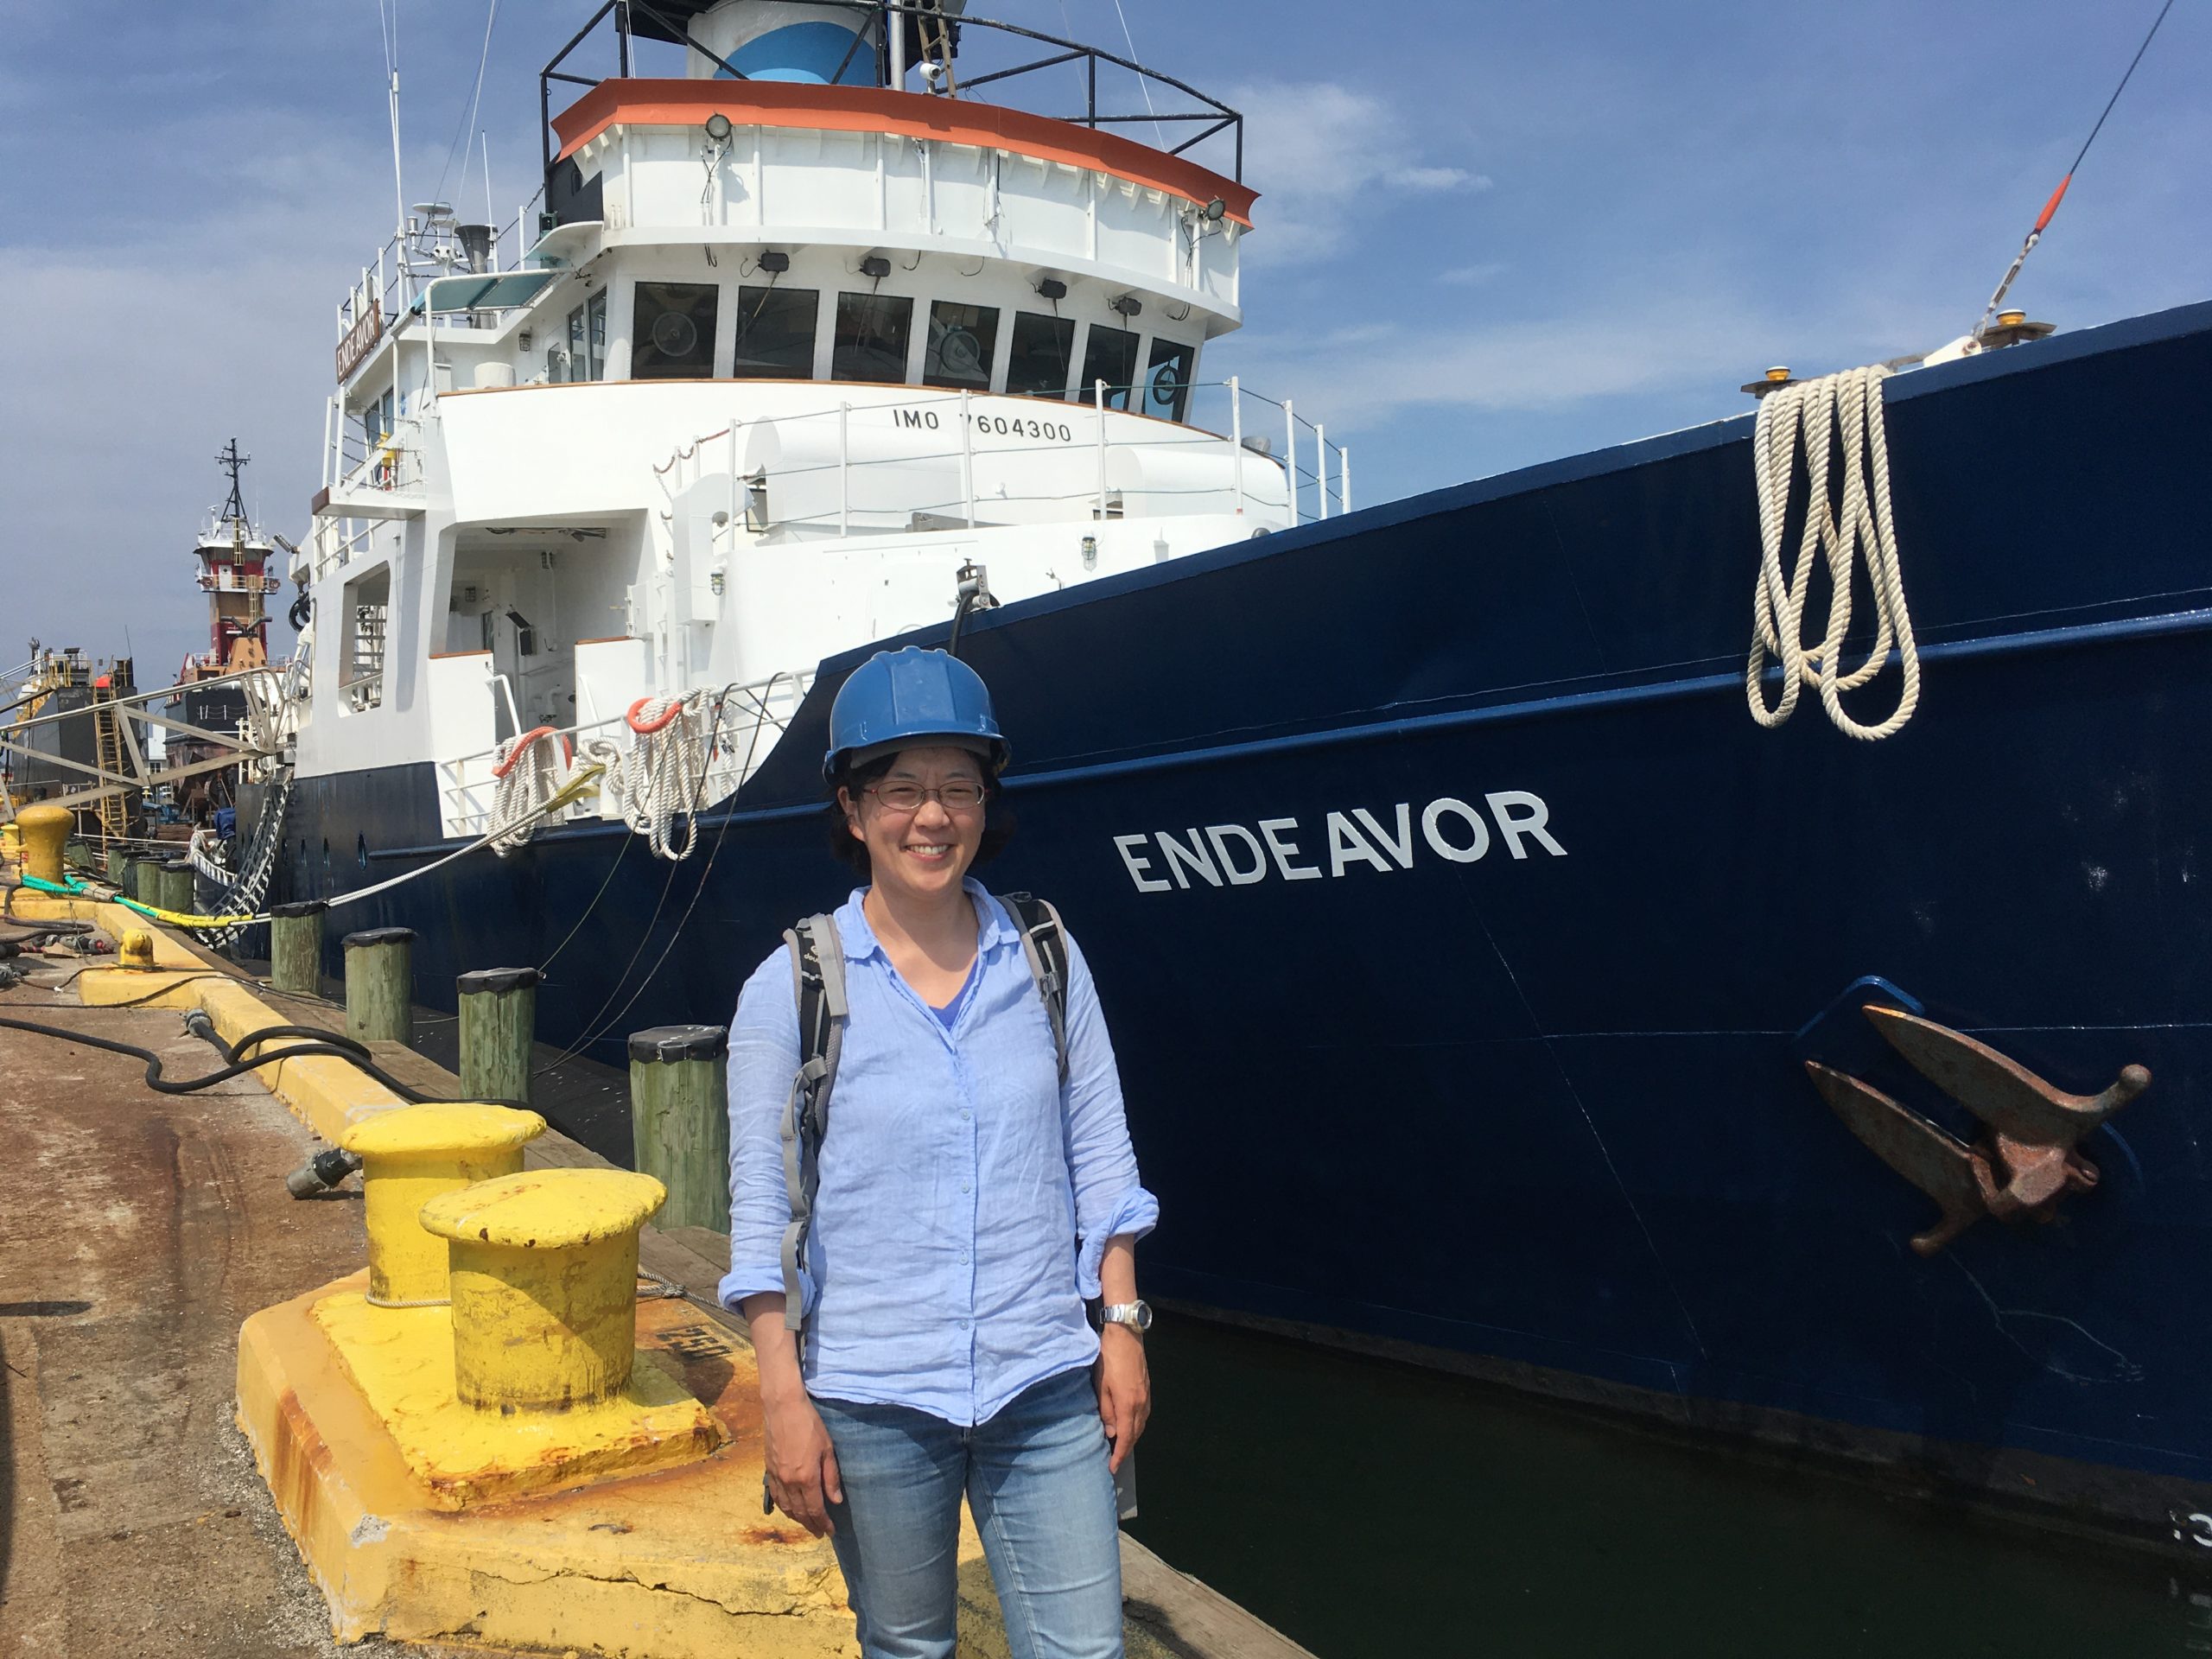
Mei next to the research vessel, Endeavor

The activities are as follows:

In our ocean, the connections between the environment and marine organisms are intricate and complex. The watery surroundings connect each level of the food web – including marine mammals, large fish, schooling fish, phytoplankton, and more. Climate change is causing our ocean to become warmer, and organisms are already starting to respond. When ocean waters change, the effects cascade through different levels of the food web. In order to understand how marine organisms, and their interactions, are affected by changing climate, we need accurate measurements that tell us what populations are like today and continue monitoring into the future.
As a biological oceanographer, Mei’s research focuses on organisms in the middle of marine food webs. These are the small schooling fish, like anchovies and herring, that consume other organisms, but are also vulnerable to predation. Growing up in Japan, the ocean was always a part of Mei’s life through hobbies such as swimming, fishing, and also from knowing the cultural importance of eating seafood and learning to prepare for tsunamis. She was first introduced to ocean science through a local fisher who had an oyster farm near her hometown. Since then, she has pursued her career as an oceanographer across three different countries – Japan, Canada, and the United States – both in academia and industry.

Mei now does research as part of a Long-Term Ecological Research project out of Massachusetts. This means that Mei is part of a scientist team working together to study long-term patterns in the ocean.
Looking at data over time allows Mei and others to better identify and understand the consequences of climate change. This information Mei next to the research vessel, Endeavor will help fishers and fisheries managers make decisions and prepare for the future.

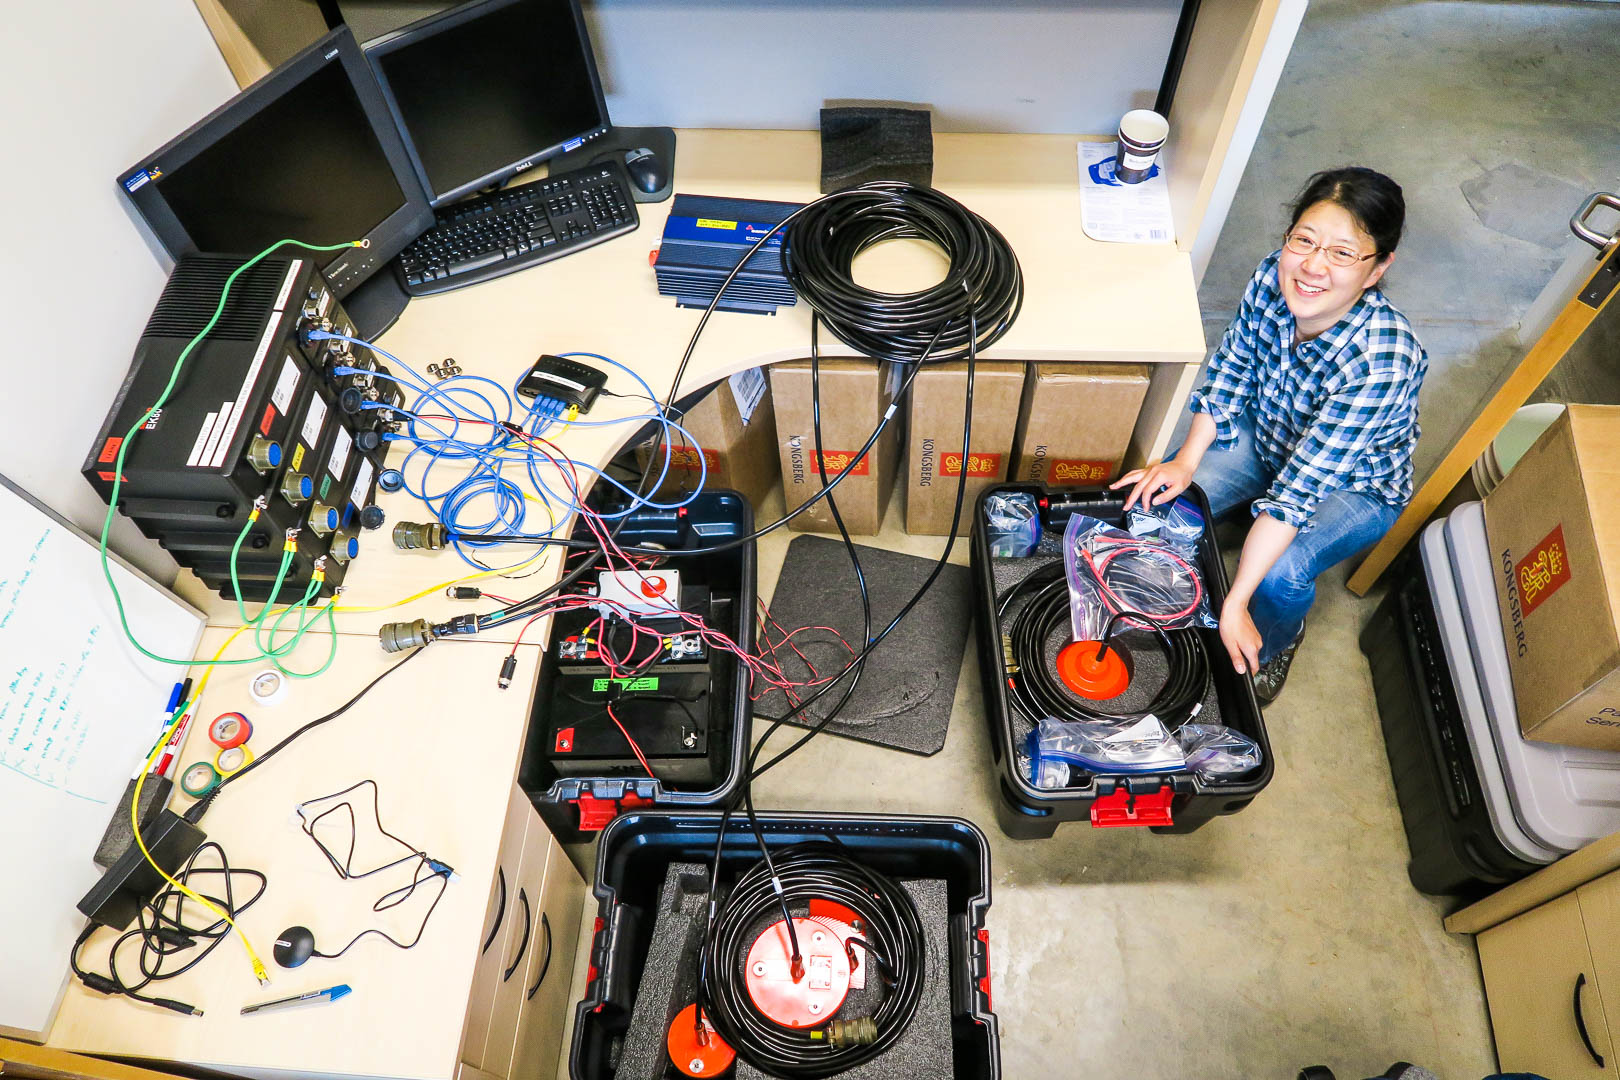
Mei testing equipment before a research cruise

In August 2023, Mei went to sea on one of the project’s research cruises. She wanted to take a closer look at one of the fastest-warming ocean areas and richest fisheries in the world – the continental shelf of the Northeast U.S. She boarded a large research ship for 6 days with a team of 14 other scientists who specialize in different areas of oceanographic research. To more accurately collect these data, Mei used sound! Echosounders bounce sound off marine organisms, such as fish. This tool is similar to fish finders that are used by most fishing boats. However, the technology used by Mei is more sensitive and provides more detailed data.
The amount of sound that comes back to the ship after bouncing off fish or anything in the water is called volume backscattering strength, and is measured in decibels (dB). The intensity of what comes back can serve as a measure of fish abundance. If there are more fish, the number becomes larger (less negative).
While the echosounder is operating, other members of the research team measure water temperature and other parameters from the surface to near the bottom. Temperature is measured in degrees Celsius (ºC), and depth is recorded in meters (m). Mei wanted to use these data to give her a snapshot in time of where fish are located.

Featured scientist: Mei Sato (she/her) from Woods Hole Oceanographic Institution and
Northeast U.S. Shelf LTER (NES-LTER)

Flesch–Kincaid Reading Grade Level = 9.8

What grows when the forest goes?

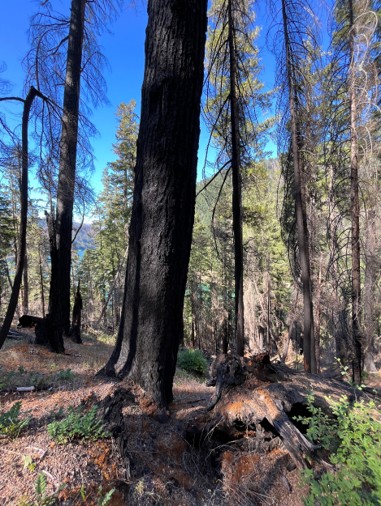
Area of the H.J. Andrews Experimental Forest in Oregon, a few years after a fire.

The activities are as follows:

The H.J. Andrews Experimental Forest, or Andrews for short, is a long-term ecological research site in the Cascade Mountains of Oregon. The forest is a temperate old-growth rainforest. It is known for its lush and green understory of flowering plants, ferns, mosses and a towering canopy of Douglas fir, Western hemlock, Red cedar, and other trees. Scientists have spent decades studying how plants, animals, land use, and climate are all connected in this ecosystem.

Matt is a biology teacher who has spent two summers in the field working with scientists at the Andrews. These experiences have been valuable ways to bring real data and research back to his students! When he visits, Matt works closely with Joe and Cole. Joe is a scientist who has spent many years working in the forest studying the impact of disturbances on plants. Cole is in Joe’s lab and has been focusing on fire’s effects on the forest during graduate school.

Historically, large, severe fires have been a part of the ecology of forests in Oregon. They typically occur every 200-500 years. Many of the plants at the Andrews Forest are those that can deal with fire. Fires clear out dead plants, return nutrients to the soil, and promote new growth of understory and canopy plants. With climate change impacting temperature and rainfall across the globe, forests in Oregon are increasingly experiencing longer periods of dry and hot weather. These changes are causing an increase in the frequency and severity of wildfires.  

On Matt’s last day at the Andrews in 2023, a lightning strike started a wildfire in a far corner of the forest. With hundreds of firefighters on the ground and several helicopters in the air, the “Lookout Fire” burned for several months, consuming about 70% of the Andrews forest! 

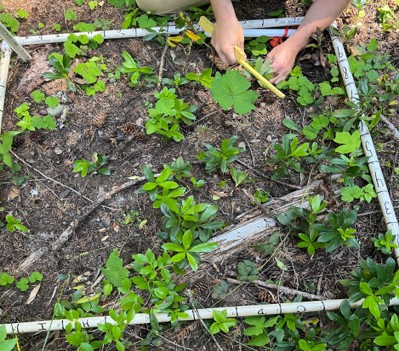
Plots in 2023 being surveyed for native and invasive plants to calculate the proportion that are invasive after a burn.

When Matt returned in the summer of 2024, it looked nothing like the forest he had left. The fire completely changed the course of his research experience. When he saw the scorched forest, he began to wonder how it would recover. He also observed that the fire had not burned at the same intensity throughout the forest. Some areas of Andrews were burned more, and in some spots, the fire had been less intense.  

Matt thought that some plants may do better after a severe burn, while other species might do worse. Specifically, Matt wanted to see whether native and invasive plants would show differences after a fire. Plants that have historically grown in an area without human interference are called native plants. These plants have a long history of adapting to the specific conditions in an area. When a plant species is moved by humans to a new area and grows outside of its natural range, it is called an invasive plant. Invasives often grow large and fast, taking over habitats, and pushing out native species. Invasive plants tend to be the ones that can grow fast and handle disturbances, so the team expected that invasive species would recover more quickly than native plants after high severity fires.  

It was still too early to re-enter the areas burned by the Lookout Fire, so Matt and Joe chose another recent fire. They used data collected from a section of the forest that had burned in 2020. In 2021, a year after the fire, scientists put out 80 plots that were 1m2 in size to collect data on the understory plants. 

Each section was given a burn severity value based on the amount the canopy trees had burned directly over the plot. Scientists would look up at the tree canopy and see how much was missing, and the more that was gone, they knew the burn severity had been higher. Scientists then identified every species of plant in the plots and counted the number of individual plants of each species. This was repeated every year after 2021 to observe changes over time. Matt and Joe decided to analyze data from 2023, which Matt helped collect with Cole. To answer their question, they calculated the proportion of invasive plants in each plot. 

Featured scientists: Joe LaManna (he/him) and Cole Doolittle (he/him) from Marquette University and
Matt Retterath (he/him) from Fridley Public Schools.

Flesch–Kincaid Reading Grade Level = 8.9

Additional teacher resources related to this Data Nugget:

There are two blog posts written about the Andrews LTER research featured in this activity.

  • https://lternet.edu/stories/fire-brings-new-perspectives-on-disturbance-at-h-j-andrews-experimental-forest/
  • https://lternet.edu/stories/burned-forest-bleached-reef-lter-sites-adapt-to-learn-from-disturbance/

CO2 and trees, too much of a good thing?

The activities are as follows:

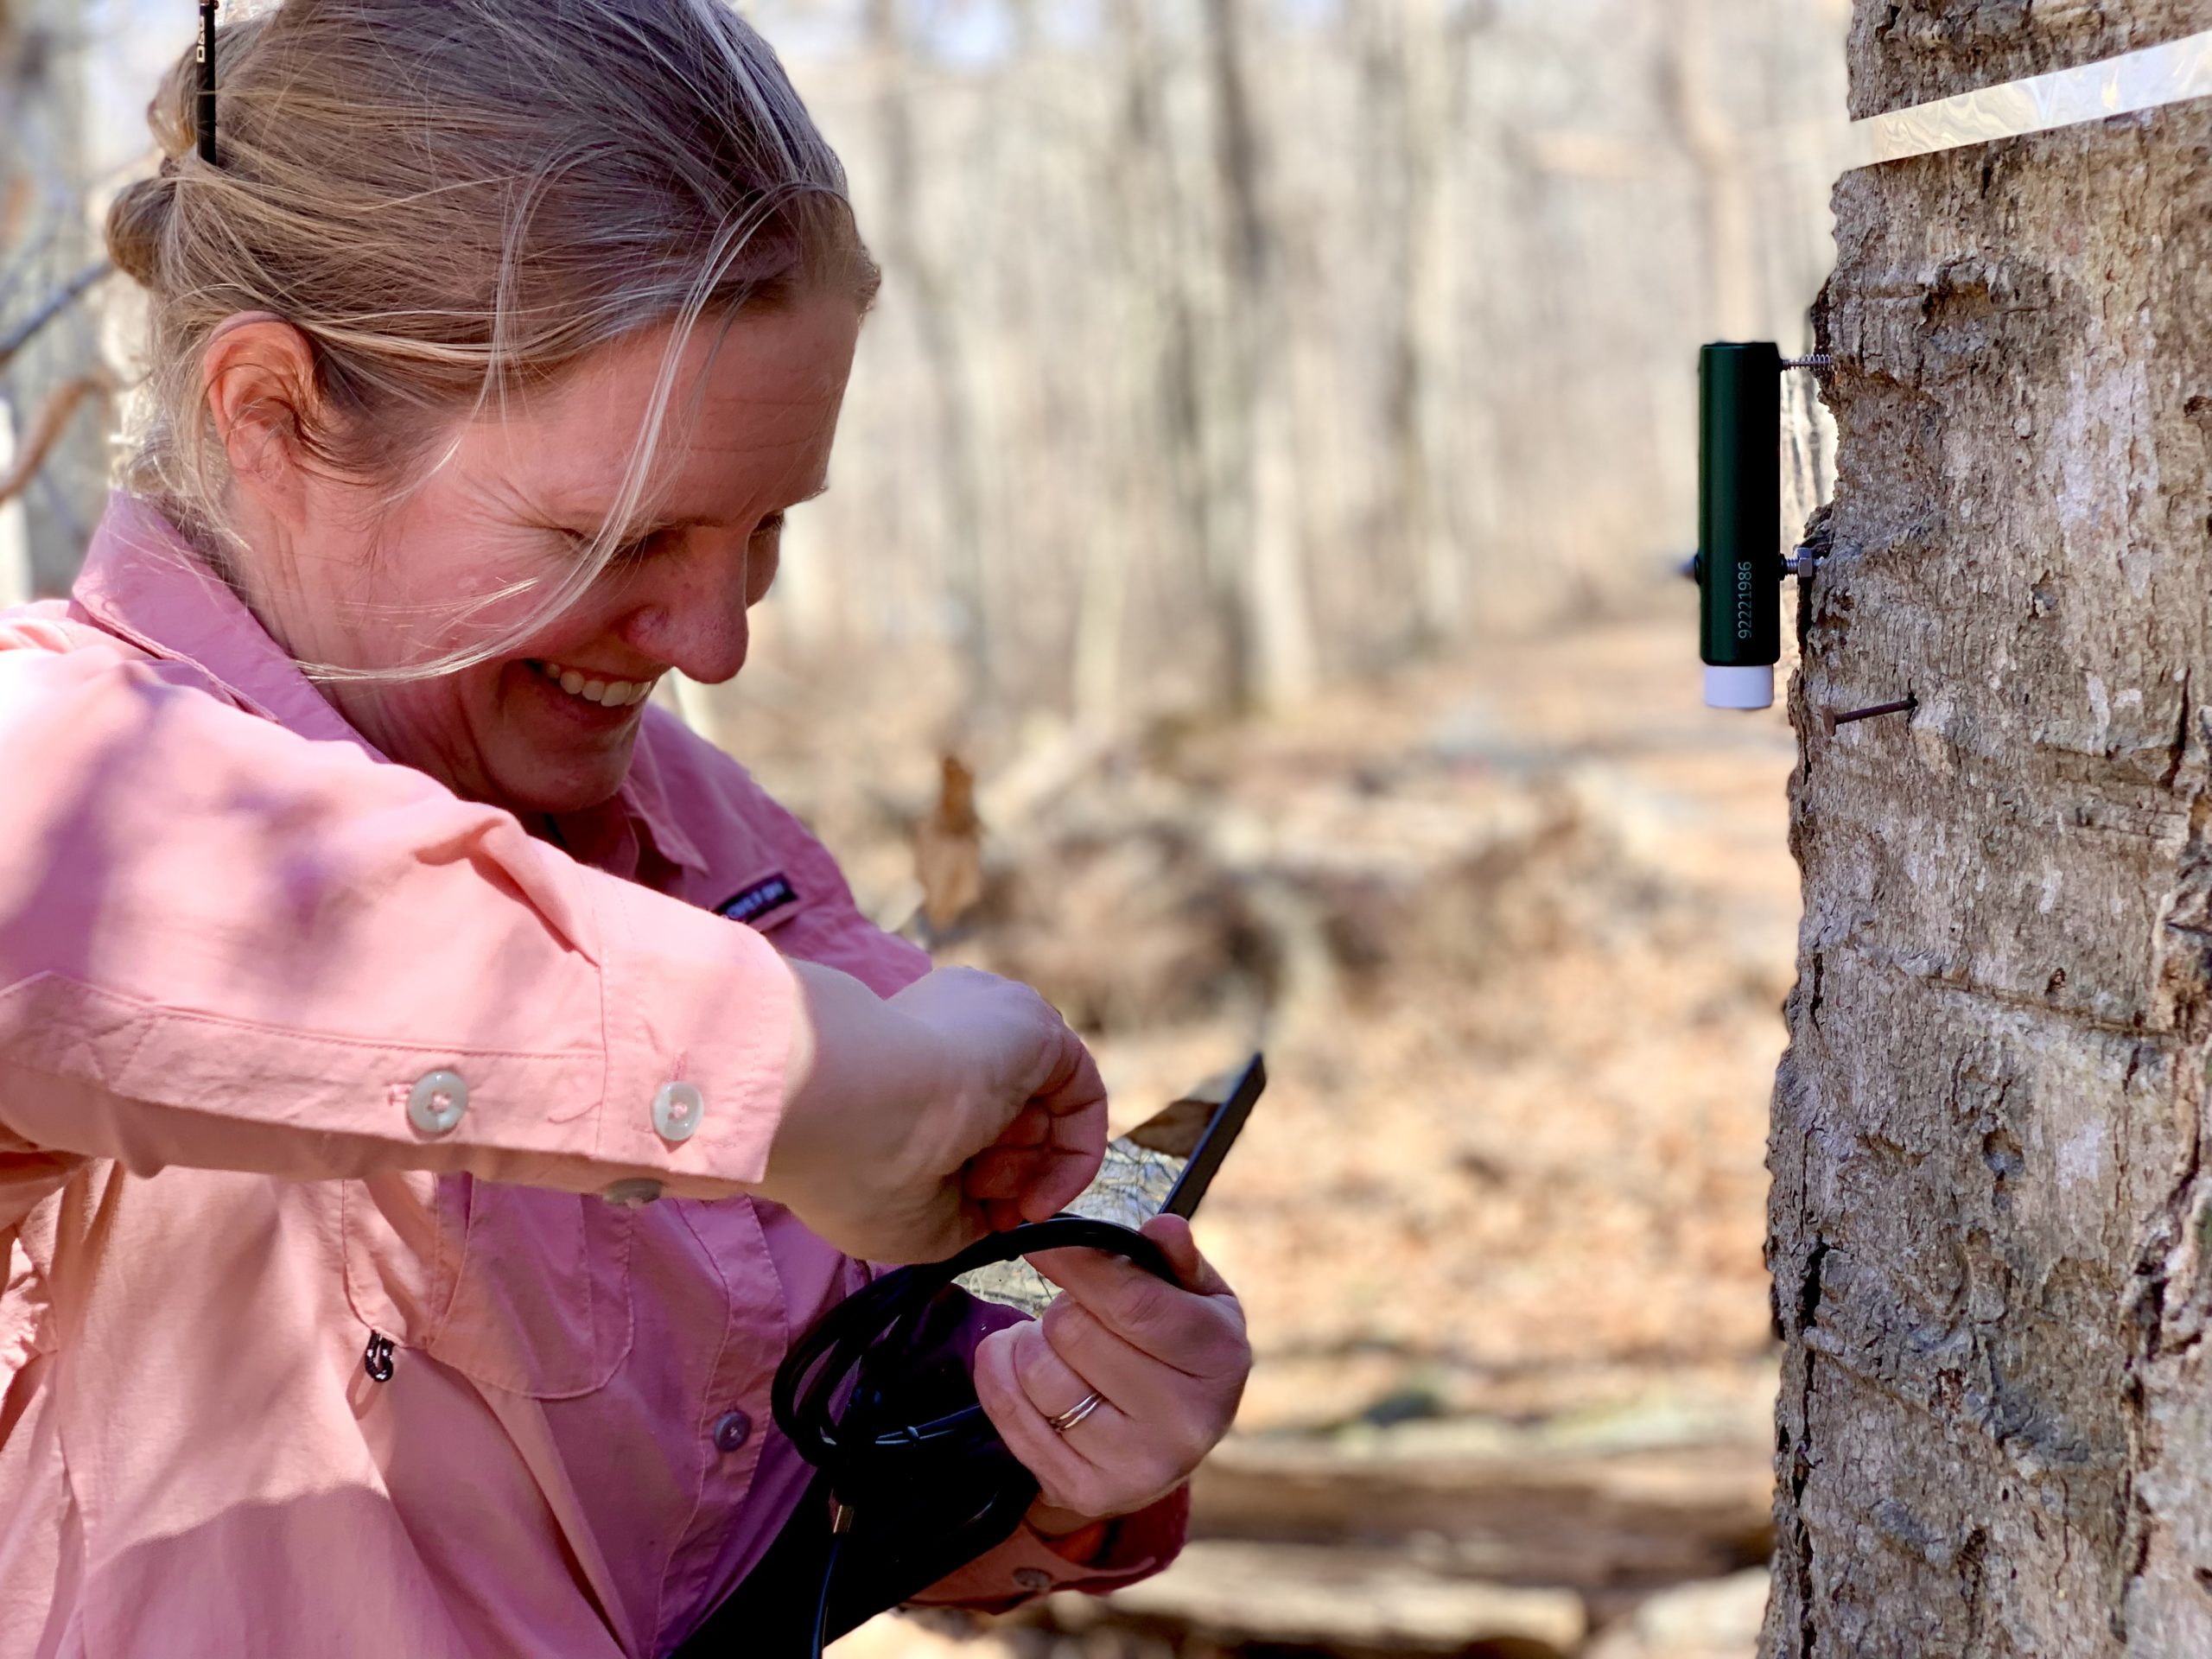
Kristina conducting the tree survey, measuring the size of a tree, which will later be used to calculate the mass of carbon in that tree.

The amount of carbon dioxide (CO2) in the atmosphere has steadily increased since the start of the Industrial Revolution in 1750. This extra CO2 traps heat like a blanket, causing the global climate to warm. The resulting climate change effect is known and widely accepted in science. While scientists are certain that climate change is happening, they still have many questions about its impacts.

For example, scientists today are exploring whether climate change will help or hurt trees and forests. Many scientists think that elevated CO2 in the atmosphere can actually help trees. We can see why in the formula for photosynthesis:

6𝐶𝑂2+6𝐻2𝑂+𝐸𝑛𝑒𝑟𝑔𝑦→𝐶6𝐻12𝑂6 +6𝑂2

Carbon Dioxide + Water + Energy (sunlight) → Glucose + Oxygen

If you add more CO2 to the atmosphere, trees will have more resources for photosynthesis and can make more glucose. Glucose is food for the trees. Trees can use their glucose for growth, using it to make wood. However, trees sometimes have to put glucose towards other things. Just like us, plants break down glucose for energy through cellular respiration:

C6𝐻12𝑂6 +62→ 6𝐶𝑂2+6𝐻2𝑂+𝐸𝑛𝑒𝑟𝑔𝑦
Glucose + Oxygen → Carbon Dioxide + Water + Energy (ATP)

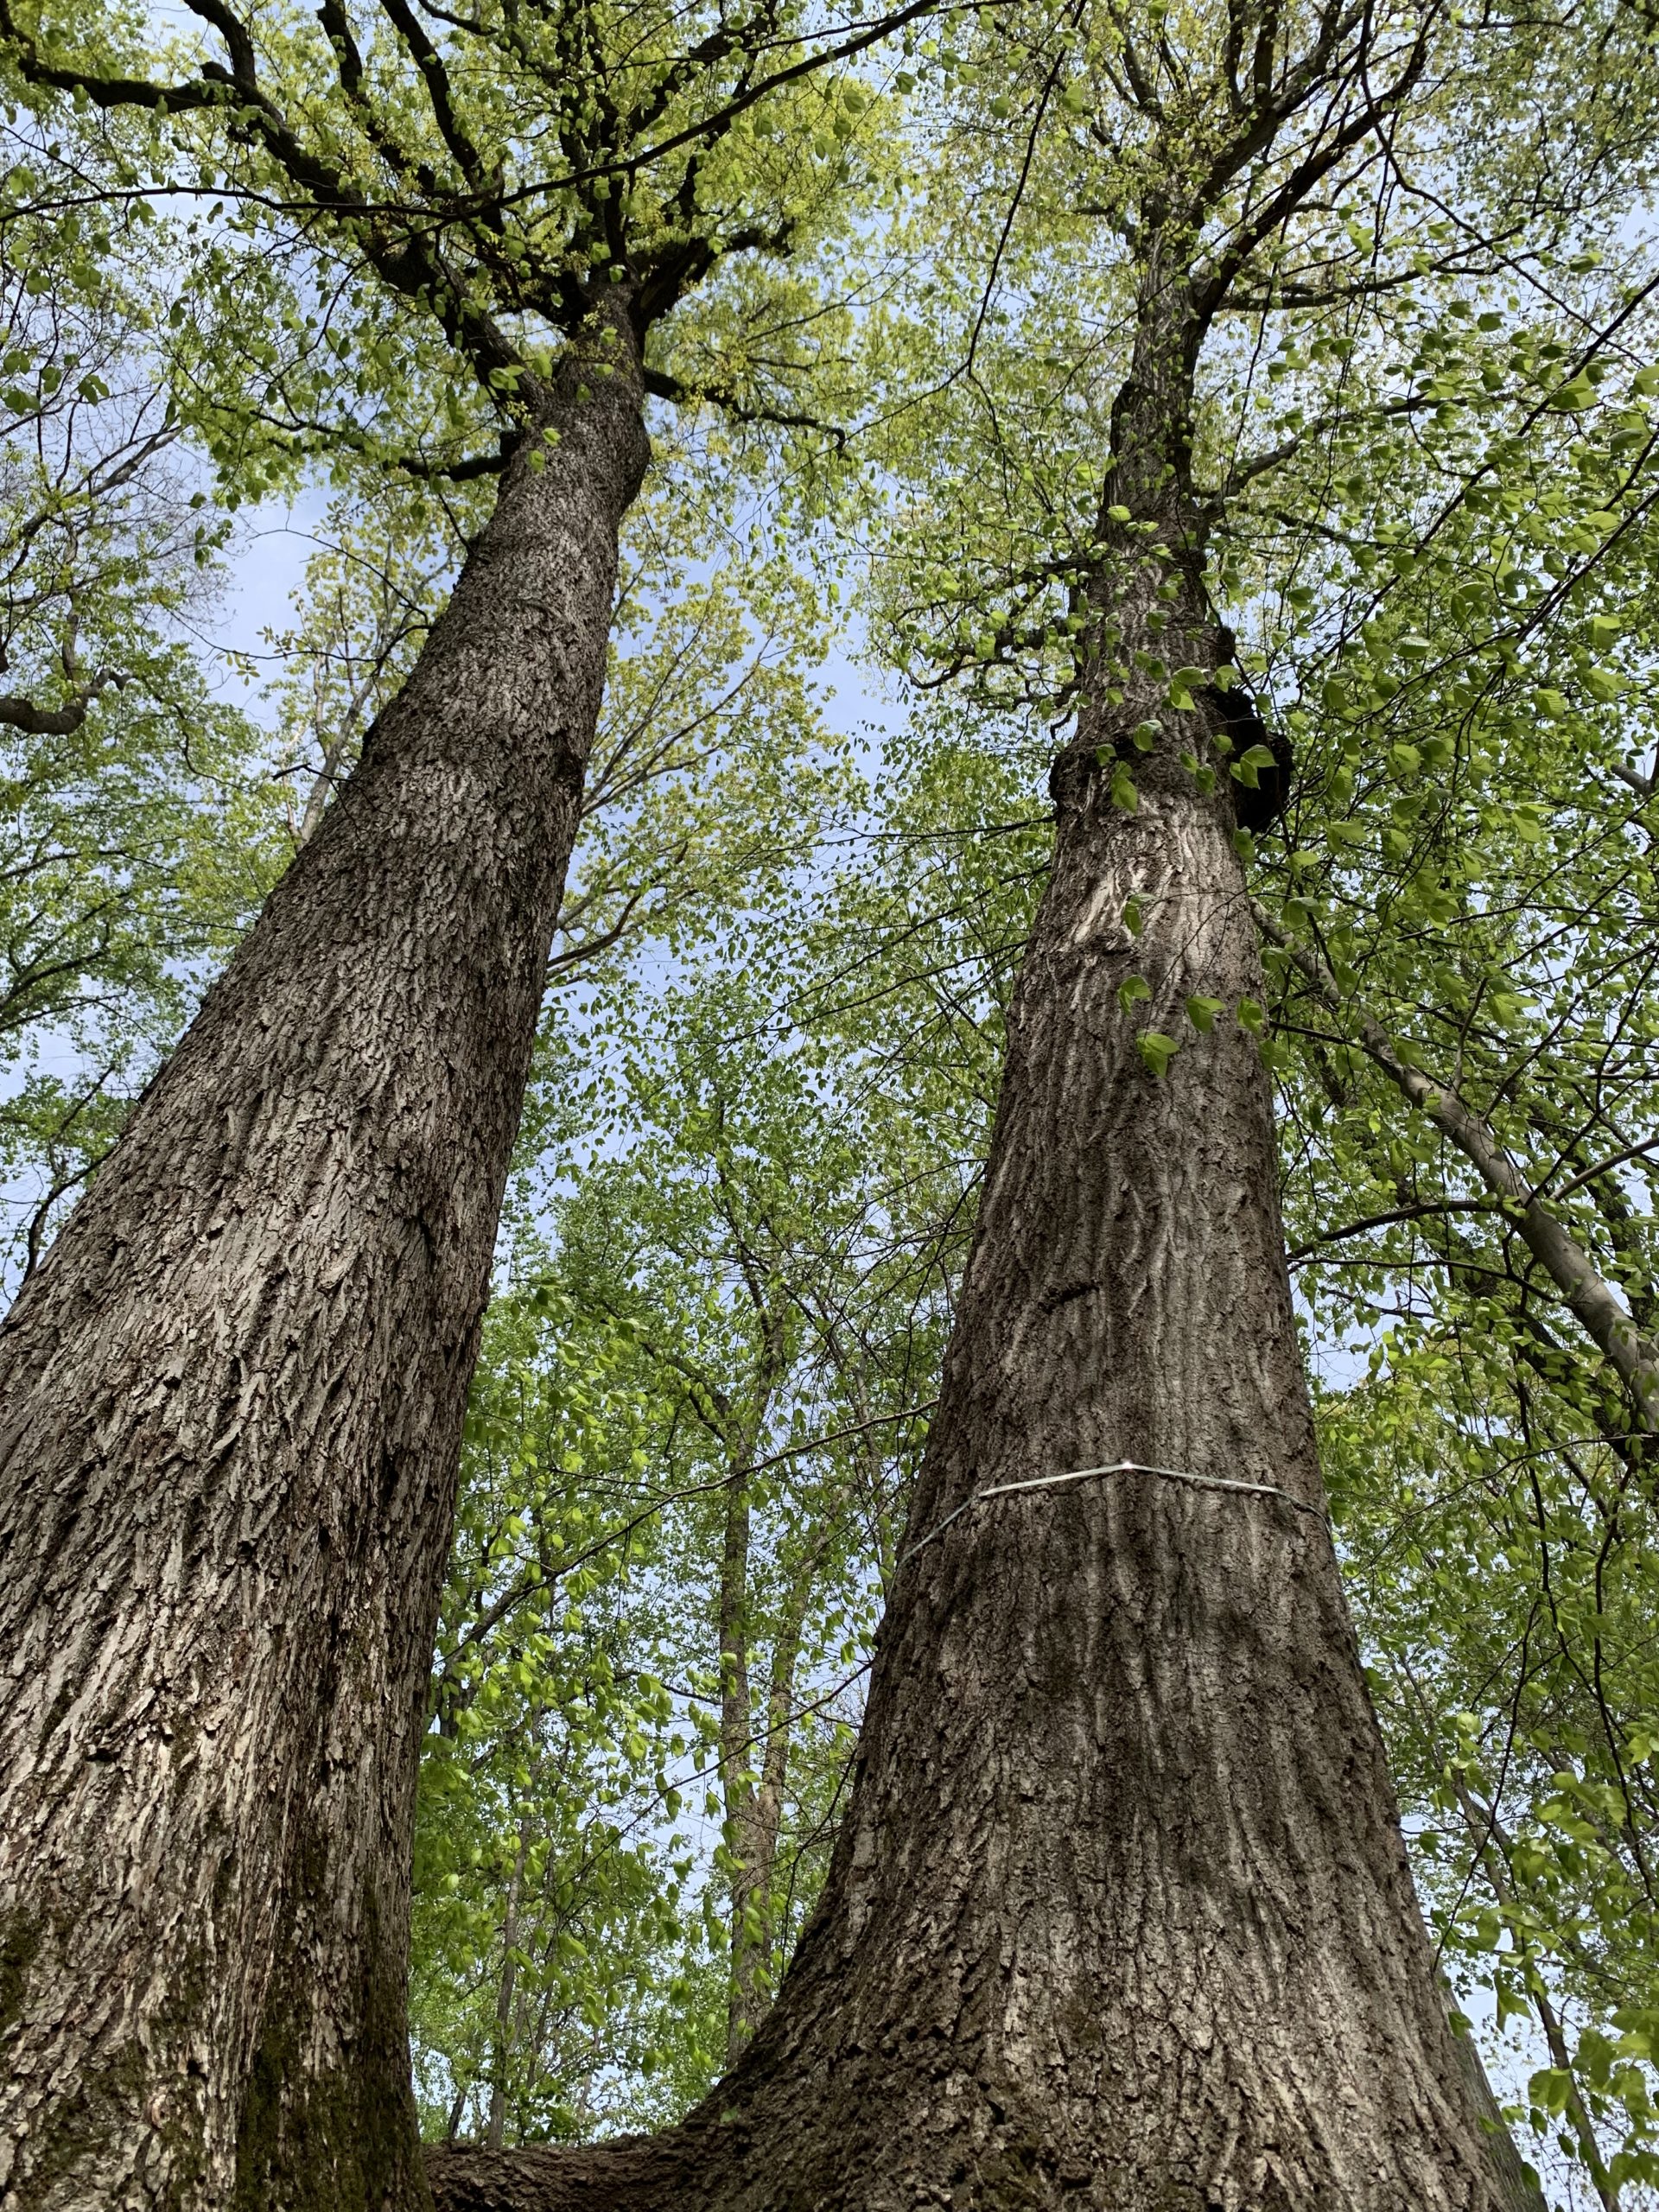
Two large trees stand in the experimental plot after a survey. The tree to the right has been banded to measure its growth.

Trees need energy for everyday functioning, or to respond to stress. Under climate change, trees might experience more stress. Stress for trees might increase if summer temperatures get too hot, or they don’t have enough water. More stress means more respiration and less growth. Or, even worse, the trees could die. Dead trees can’t photosynthesize, and they also decompose, which releases CO2 into the atmosphere
as microbes break down wood and other materials.

Kristina and Luca are scientists looking at the effects of climate change on trees. They wanted to test whether climate change was benefitting or hurting trees. They set out to find some data that would allow them to test these alternative hypotheses.

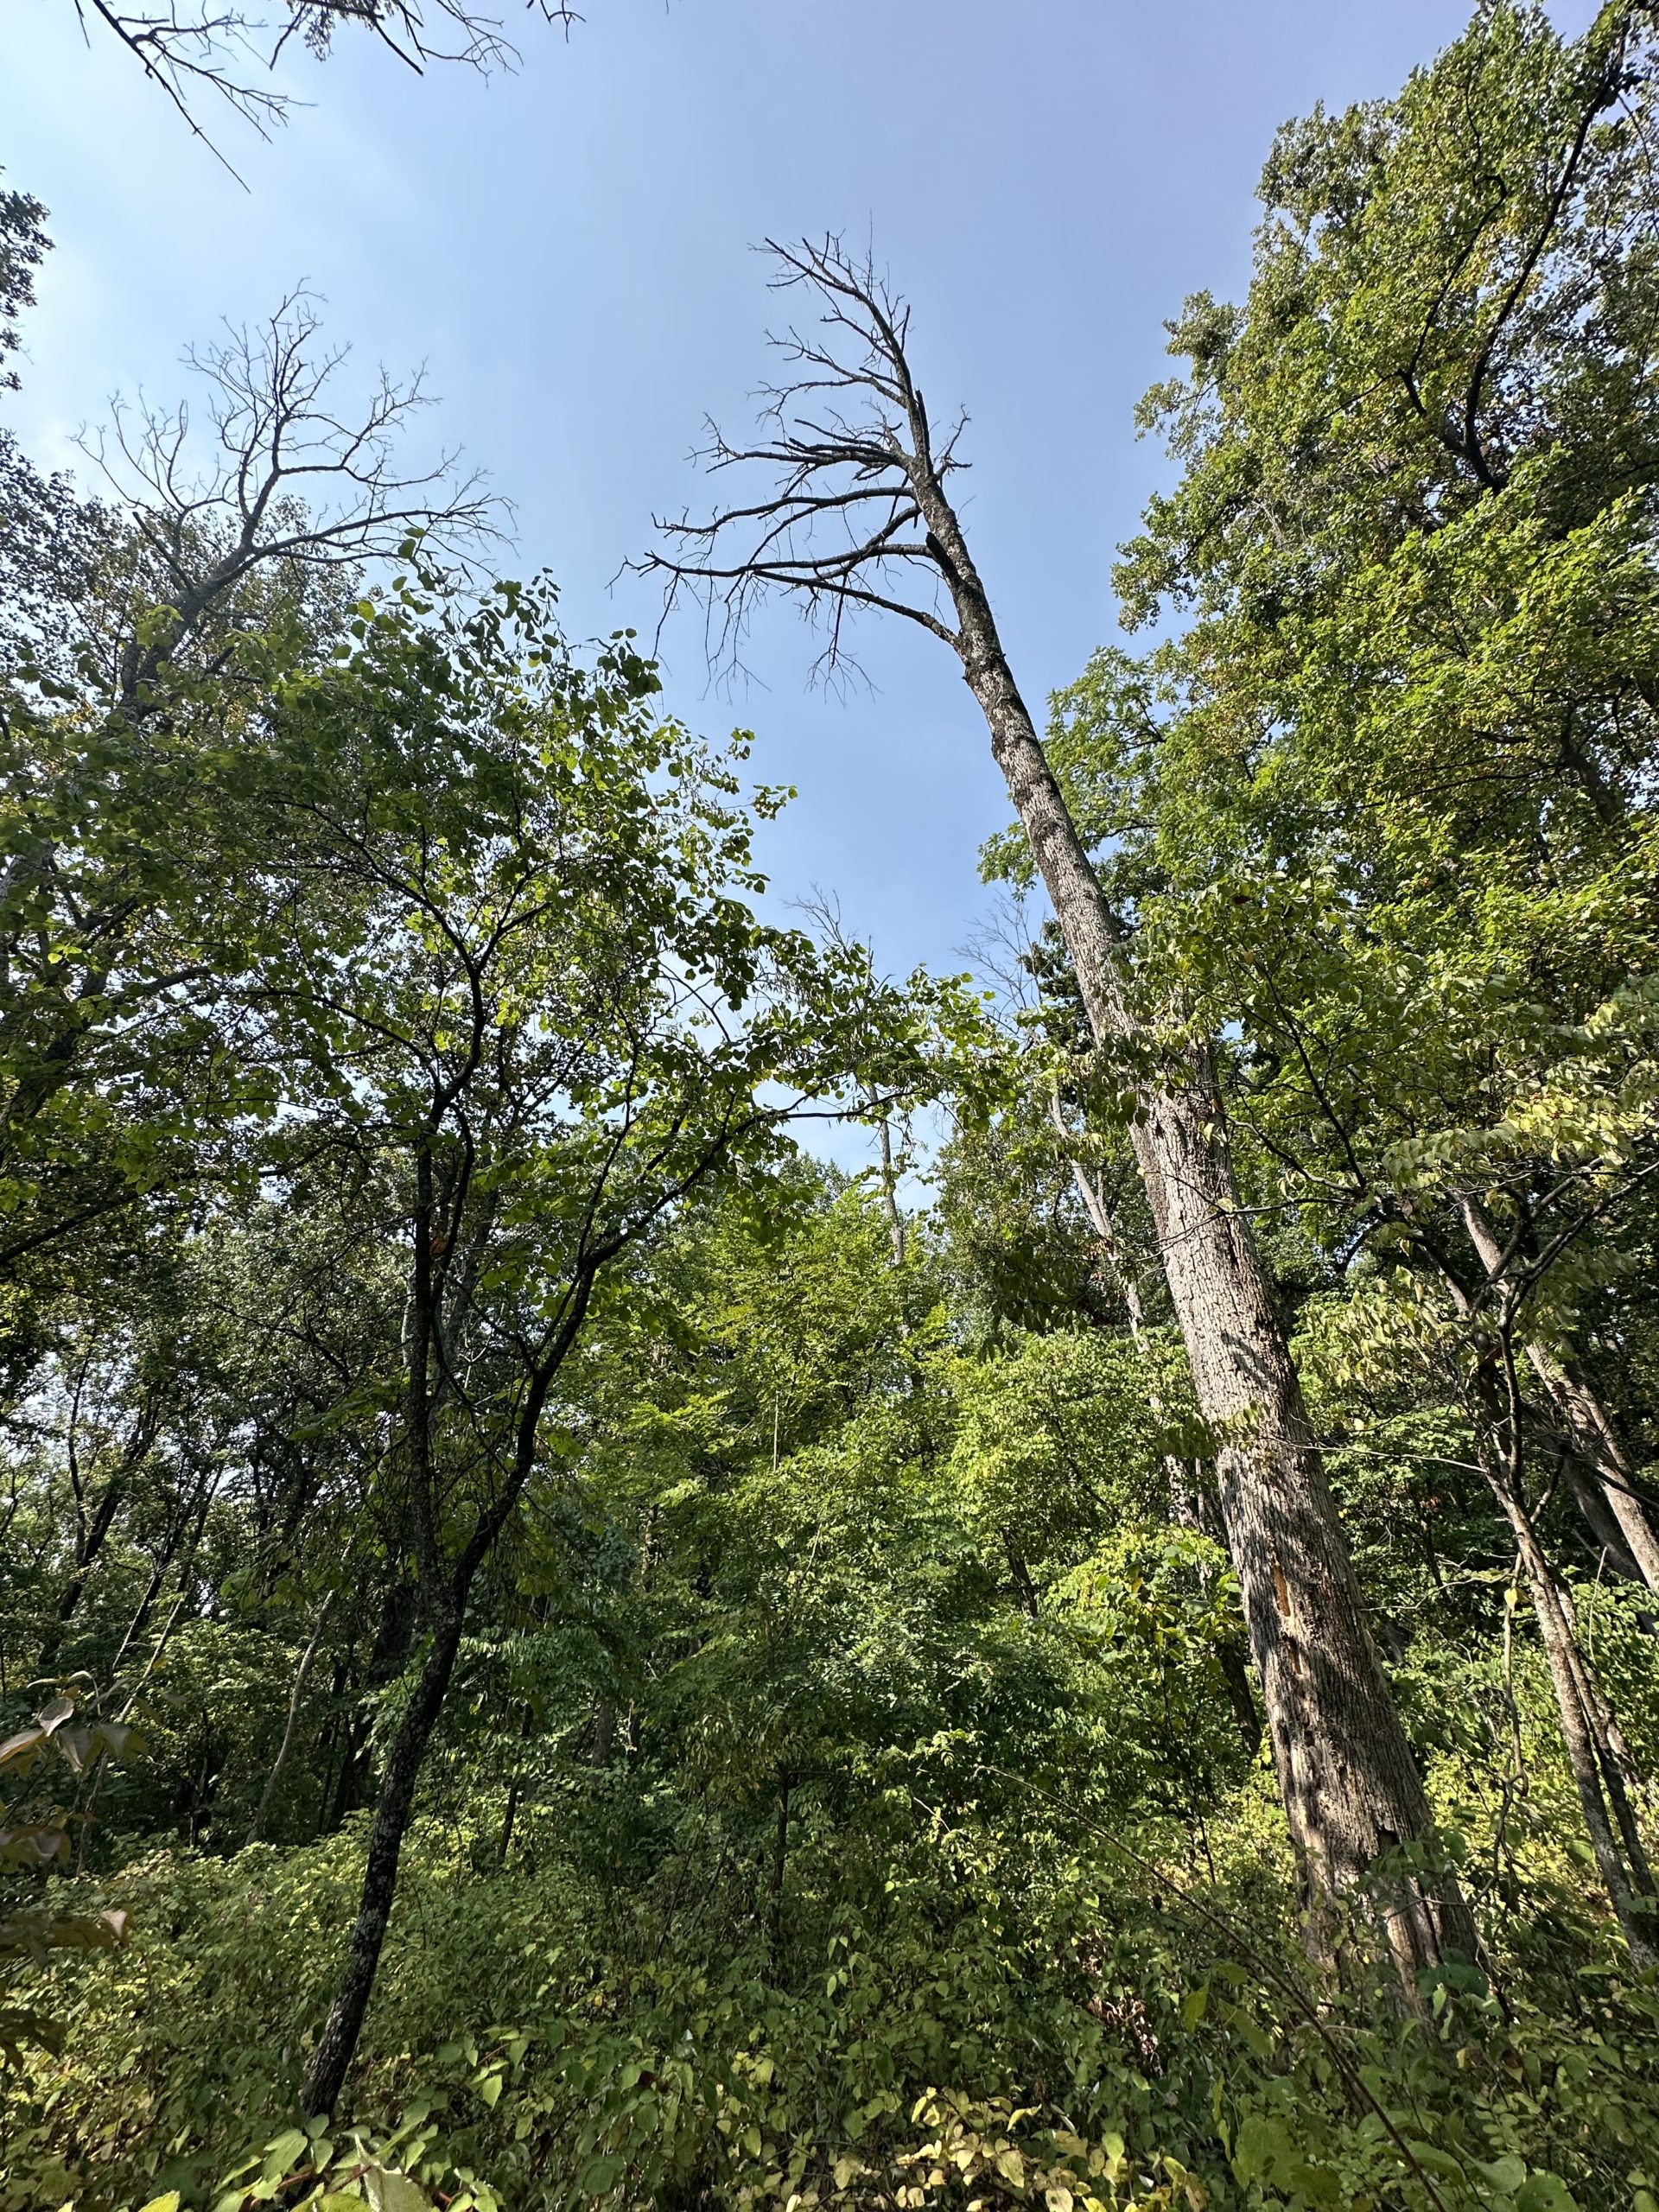
A dead ash tree stands in the experimental plot after a survey. The carbon in this tree
will return to the atmosphere through decomposition.

Kristina runs a tree census in a forest at the Smithsonian Conservation Biology Center in Virginia. Since 2008, she and many other scientists have surveyed every tree in their 26-hectare plot. Every five years, they count up how many trees are alive, how much they’ve grown, and how many have died. Luca joined Kristina’s lab in 2022. He and Kristina worked together with many other scientists to collect and process data on tree growth and mortality in 2023.

They used this growth and mortality data for individual trees to calculate levels of carbon gained and lost by the whole forest. The amount of carbon used for growth across the whole forest was measured as the mass of carbon gained. They also calculated the weight of the trees that died, which was measured as the mass of carbon lost. Both of these measurements were calculated in megagrams (Mg, that’s one million grams) of carbon (C) per hectare (ha) of forest per year (yr), or (MgC/ha/yr). The difference between these
two values is the change in carbon. This value gives the balance between carbon gained and lost. A positive value means there is more carbon being taken in by the forest than lost, and a negative value means that more carbon is being lost back to the atmosphere.

Featured scientists: Kristina J. Anderson-Teixeira (she/her) & Luca Morreale (he/him) at Smithsonian’s National Zoo & Conservation Biology Institute. Written by Ryan Helcoski

Flesch–Kincaid Reading Grade Level = 7.8

Farms in the fight against climate change

Caro working in the labs at the Kellogg Biological Station to confirm the % soil carbon measurements used in the study.

The activities are as follows:

Carbon, when it is found in the soil, has a lot of benefits. Soil carbon makes water more available to plant roots, supports microbes and insects, helps water move through the soil and not flood at the surface, and holds on to critical nutrients for plants, like nitrogen and phosphorus. It is a key measure of soil health used by farmers.

The more carbon stored in soils, the less that ends up in our atmosphere as greenhouse gas, which contributes to climate change. Farming practices that increase soil carbon are a double benefit – they help crop plants grow and produce more return for farmers, while also helping to fight climate change.

Yet, accumulating carbon in the soil is a slow and mysterious process. It can take decades to see greater levels of carbon in most agricultural soils. Farmers need information about which farming practices reliably and continually increase soil carbon.

View of the Long-Term Ecological Research experiment at the Kellogg Biological Station where plots have been growing with different agricultural and plant community treatments since 1989.

Caro is a soil scientist working with farmers to figure out how they can increase carbon in their soils. Her passion for soils brought her to the Kellogg Biological Station. This site is very special because it houses the Long-Term Ecological Research Program, which has been running the same experiment since 1989! When the study began, the soils were the same across the site. But, after decades of different treatments taking place in research plots, a lot has changed above and below ground.

In 2013, a team of scientists worked to sample soil carbon at this site, 25 years after the experiment began. The team processed the samples to determine the percent, by weight, of each soil sample that is made up of carbon. This is called % soil carbon. They collected samples from 4 different treatments, each with 6 replicate plots:
(1) Conventional: plots grown in a corn soybean-wheat crop rotation. The soil in these plots is tilled during spring, meaning they are disturbed and turned over. These plots represent how agriculture is conventionally done in the area with standard chemical inputs of fertilizer, herbicides, and pesticides.
(2) No-till: plots that are grown in the same way as conventional, but with one key difference. The soil in these plots is not tilled, meaning it has been undisturbed for 25 years at the time of sampling.
(3) Cover crops: plots grown similarly to conventional, with a few key differences. First, cover crops were added. Cover crops are plants that are planted alongside crops or at times of the year when the main crop is not growing. This means the soil has living plant roots year-round, not just during the season with crops. Second, this treatment had no chemicals added; all nutrients came from the addition of manure. These plots were tilled.
(4) Not farmed: non-agricultural plots growing in a diverse mix of plant species. Plots are unmanaged, but are sometimes burned to keep out woody species.

These 4 treatments represent different ways that land can be managed. The goal of the study was to see how different types of land management had changed % soil carbon over time. When Caro came to KBS in 2018, she was excited to see such a cool dataset waiting to be analyzed! She thought that keeping the soil undisturbed and having living roots in the soil for more of the year would increase soil carbon over time. This led her to predict that she would see higher % spoil carbon in the cover crop and no-till treatments, compared to conventional.

Featured scientist: Caro Córdova from University of Nebraska-Lincoln and the W. K.
Kellogg Biological Station Long Term Ecological Research Program.

Flesch–Kincaid Reading Grade Level = 4.1

Additional teacher resources related to this Data Nugget:

The results from this study are published and the article is available online.
Table 2 in the paper matches the dataset that students are working with in this activity.

If students want to read more about this paper, there is a blog post summarizing the study.

The full dataset is also available online in the Dryad Digital Repository. The file has lots of details about the variables measured and the different cropping systems studied. The first tab of the spreadsheet contains the data used in this activity, plus many more variables and treatments that students can explore to ask new questions!

More information on Regenerative Agriculture from MSU here.

These data are part of the Kellogg Biological Station Long Term Ecological Research Program (KBS LTER). To learn more about the KBS LTER, visit their website.

Data Nuggets awarded the Huxley from the Society for the Study of Evolution

The SSE T. H. Huxley Award Committee has announced the winner of the 2025 T. H. Huxley Award, Dr. Elizabeth Schultheis, Education and Outreach Coordinator for the Kellogg Biological Station Long-Term Ecological Research Program at Michigan State University, for her collection of educational resources called “Data Nuggets”. Data Nuggets, which are developed in collaboration with Dr. Melissa Kjelvik, bring real data and scientific role models into the classroom to build quantitative and critical thinking skills.

As part of the award, Dr. Schultheis will receive funding to present her work at the National Association of Biology Teachers (NABT) conference in October. 

The T. H. Huxley Award is administered by the T. H. Huxley Award Committee, a subset of the SSE Education and Outreach Committee.

Science Doesn’t Stop in the Winter!

When the days grow shorter and the landscape is blanketed in snow, it might seem like nature has gone dormant. Trees stand bare, ponds freeze over, and many animals disappear from sight. But winter is a critical time for many species. Researchers brave the cold to study how organisms survive and even thrive in winter’s harsh conditions.

For many species, winter isn’t an obstacle—it’s a necessity. Some organisms have evolved incredible adaptations to endure the cold. Insects use snow as an insulating blanket and even plants rely on winter conditions, with some seeds requiring a cold period before they can sprout.

Rosemary Martin in the lab with tanks of dragonfly larvae.

But winter isn’t what it used to be; Climate change is altering seasonal patterns, leading to shorter, warmer winters. These changes disrupt the delicate balance that many species depend on. Snow cover is disappearing earlier, and fluctuating temperatures cause unpredictable freeze-thaw cycles, which can be harmful to plants and animals alike.

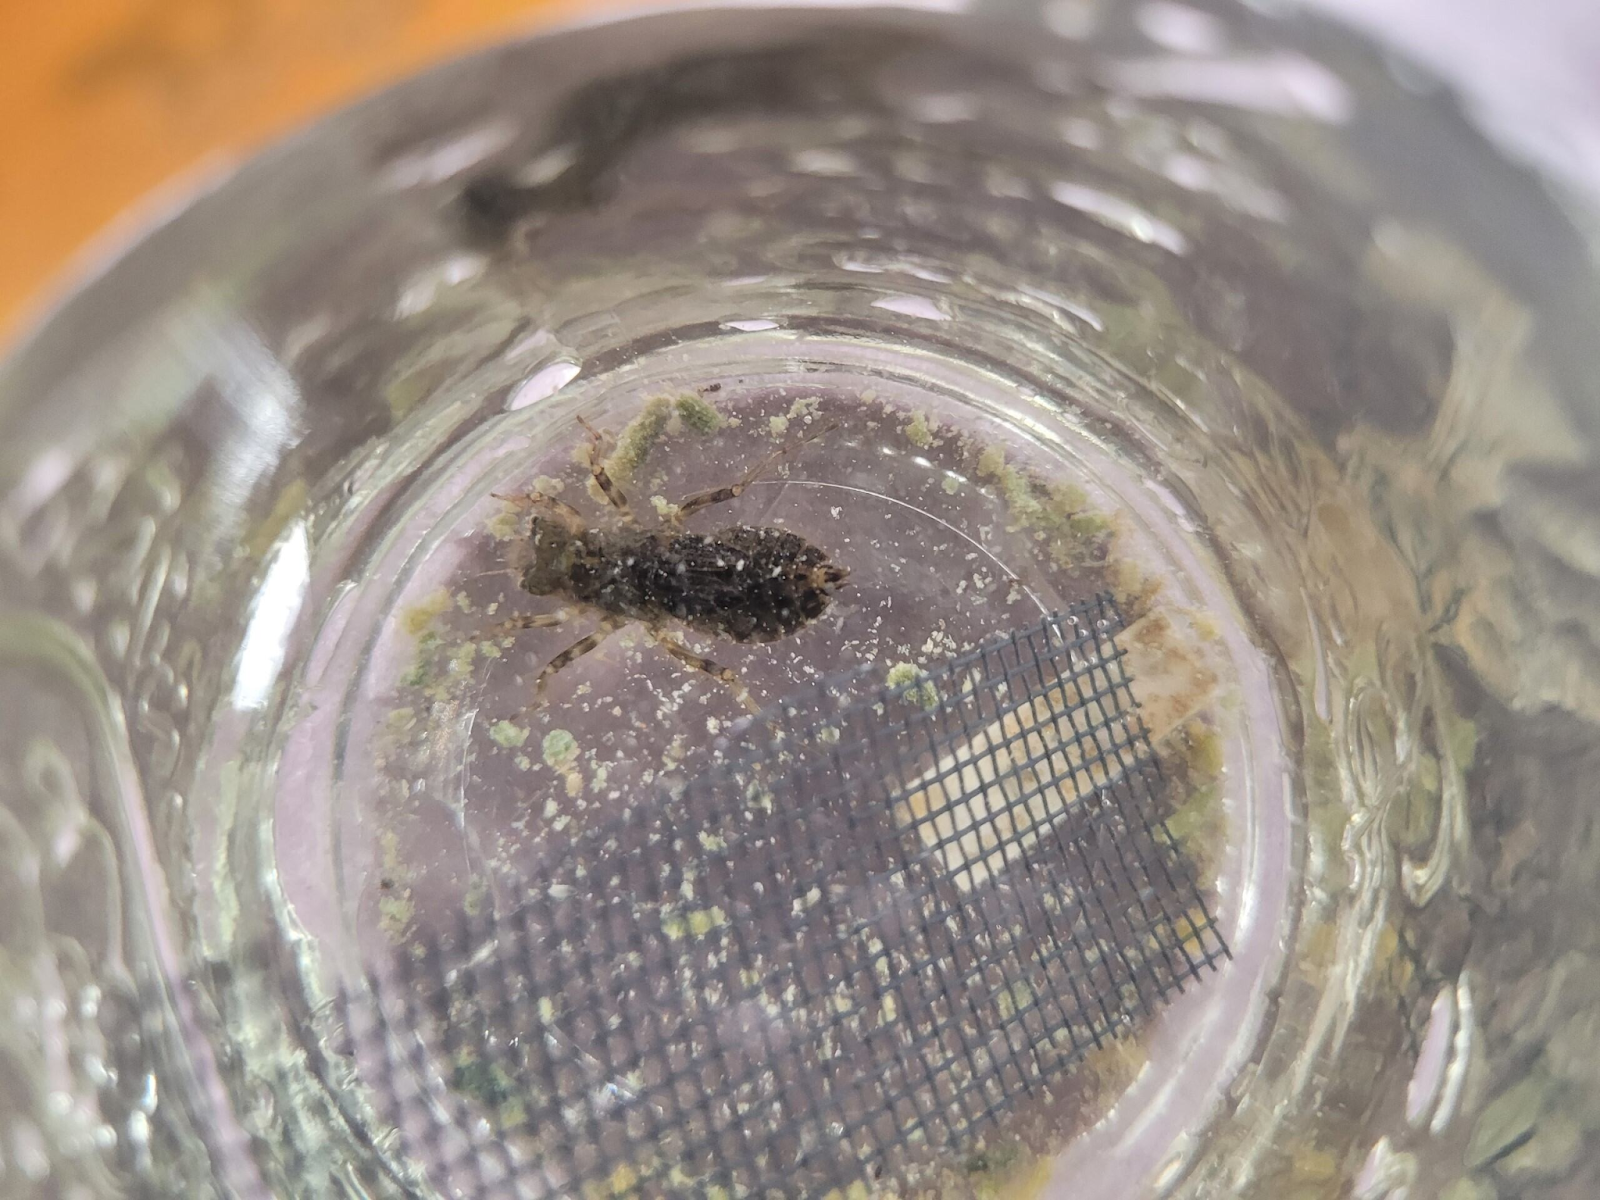
Postdoctoral researcher associate Rosemary Martin (Rosie) studies how cold temperatures affect the development of organisms, particularly dragonfly larvae. These larvae spend their early lives underwater before emerging as winged adults, and rather than hibernating in winter, they remain active. Understanding how temperatures shape their development is crucial, especially as climate change alters seasonal temperature patterns.

To investigate this, Rosie and her colleagues conduct lab experiments with six species of dragonflies. They expose them to different pre-winter temperatures before placing them in bio chambers at 4°C—mimicking the temperature of water beneath the ice. By measuring metabolic rates and analyzing fat and protein levels, they aim to uncover how different pre-winter conditions influence their health and survival. If larvae grow faster or slower due to higher pre-winter temperatures, it could impact the entire food web, from the predators that rely on dragonflies to the insects they eat.

“They actually stay active through the winter,” Rosie explains. “You can imagine how having built up resources—and still burning through them during the winter—affects their body condition in the spring. That’s what we’re trying to understand.”

Dragonfly larvae (photo credit: Rosemary Martin)

Despite the cold temperatures, Rosie notes that “this is the part that I enjoy the most. […] Part of the reason I got into winter ecology is because I wanted an excuse to get outside into the field all year round.” Winter ecology does come with its unique challenges though. It is often understudied as it doesn’t line up with the usual academic schedule. “There’s also the danger of working on ice,” Rosie mentioned, “especially during the shoulder seasons when it’s less stable. And, of course, a lot of people just don’t think about winter as a biologically active season. […] But in these mid-latitude to high-latitude environments it is obviously a really impactful environmental filter.”

One surprising fact Rosie often shares is that many people don’t realize dragonflies have an aquatic stage at all. “First, I have to explain that, and then I get to the fact that they’re active through the winter—which surprises not just the general public but even some ecologists.”

A Data Nugget on Rosie’s research will be published shortly! 

Getting Students Involved in Winter Science

For educators or students interested in exploring winter science, Rosie offers creative ideas. “If you have access to a refrigerator—and don’t mind keeping live insects in there—it can serve as a great proxy for an aquatic winter environment at 4°C,” she suggests. A mini bio chamber with LED lights and a timer can simulate winter conditions.

For those exploring the outdoors, Rosie recommends digging under the snow to examine leaf litter insects. “Try warming them up and see how long it takes for them to resume activity—that can give you insights into their overwintering strategies!” Other ideas include observing animal tracks, studying winter-active birds, and comparing how different types of trees handle the cold.

Dragonfly adult (photo credit: Rosemary Martin)

Bringing Winter Science to Your Classroom With Data Nuggets

Winter offers countless opportunities to engage students in real-world science. Data Nuggets provides resources to explore seasonal changes, including lessons on:

These lessons use real data collected by scientists, allowing students to analyze patterns and draw their own conclusions. By bringing winter science into the classroom, you can help students see that research doesn’t stop when the temperature drops—it simply takes on a new form.

So, this winter, bundle up and explore the science happening all around you! Whether it’s tracking animal footprints in the snow, investigating how ice forms, or analyzing real-world data, there’s no shortage of discoveries waiting to be made.

External Links: 

Life under the Ice

Dragonfly larvae

Microbes facing tough times

Jennifer sampling soil before the shelters were set up. Here you can see the control (left) and carbon addition (right) plots.

The activities are as follows:

As the climate changes, Michigan is expected to experience more drought. Droughts are periods of low rainfall when water becomes limiting to organisms. This is a challenge for our agricultural food system. Farmers in Michigan will be planting crops into conditions that make it harder for corn, soybean, and wheat to grow and survive.

Scientists are looking into how crop interactions with other organisms may help. Microbes are microscopic organisms that live in soils everywhere. Some microbes can help crops get through time times. These beneficial microbes are called mutualists. They give plants nutrients and water in exchange for carbon from the plant. Microbes use the carbon they get from plants as food. If plants are stressed and don’t have any carbon to give, microbes get carbon from dead plant material in the soil.

Jennifer is a biologist studying the role of microbes in agriculture. She has always been interested in a career that would help people. As a student, Jennifer thought she would have a career in politics. Along the way, she learned that a career in science is a great way to study questions that may lead to solutions for the challenges we are facing today. Jennifer was drawn to the Kellogg Biological Station, where she joined a team of scientists studying the impacts of climate change and drought on agriculture.

Jennifer and other scientists set out to test ways that we can give mutualists in the soil a boost. She thought, perhaps if we were to give microbes more food, they would be less stressed during a drought and would be able to help out crops growing in these stressful conditions.

To test this idea, Jennifer needed to test how well microbes were doing under different carbon and drought conditions. First, she set up treatments in soybean fields to manipulate the amount of carbon in the soil. She set up control plots where she left the soil alone. She also set up carbon treatment plots where dead plant litter was added to the soil to increase the carbon available to microbes.

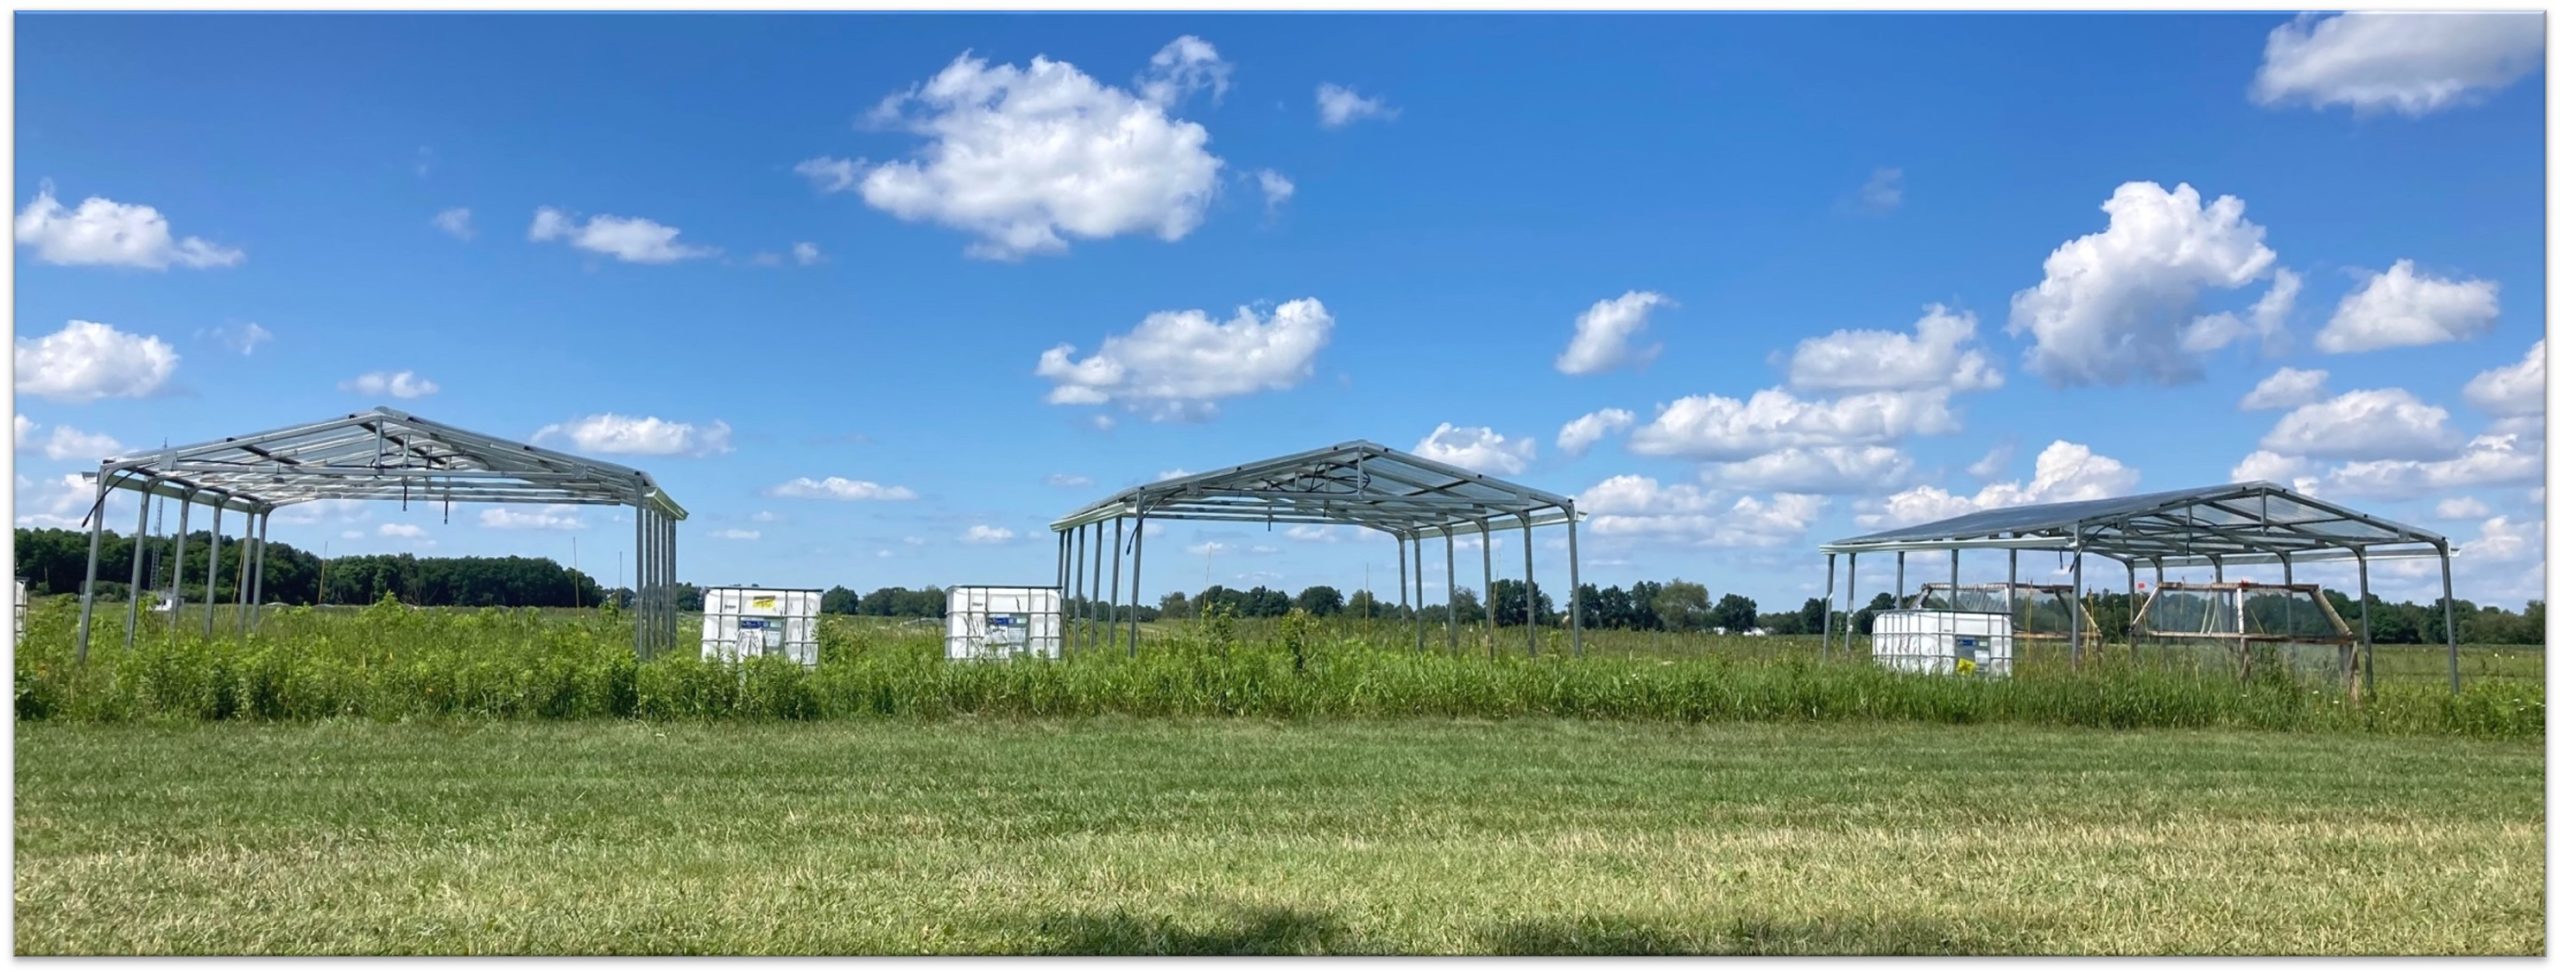
Next, Jennifer manipulated the availability of water in her plots to test the microbes under stress. To do this, she set up her plots under shelters that kept out rain. The shelters had sprinklers, which were automated to add specific amounts of water to the plots. This design allowed Jennifer to control the watering schedule for each plot. One shelter treatment was a control, where water was added to the plots every week. This is similar to the schedules of local farmers who add water through irrigation. The other shelter treatment was drought, where plots received no water for six weeks. This experiment was replicated 4 times, meaning there were 4 shelters on the control watering schedule and 4 shelters that were under drought conditions.

A view of one of the shelters used in Jennifer’s experiment.

Finally, Jennifer had to measure how the microbes were doing in each treatment. She did this by measuring their enzyme activity. Enzyme activity is a measure of how active the microbes are. The higher the enzyme activity, the happier the microbes are. To measure this, Jennifer collected soil samples from each plot throughout the growing season and took them to the lab to measure enzyme levels in the soil samples. These enzymes are made by microbes when they are active. She then calculated the mean of all her samples for each treatment combination.

Jennifer predicted two things. First, if drought is harmful to microbes, then she would expect to see lower enzyme activity in the drought treatment compared to the irrigated treatment. Second, if adding carbon to the soil is a way to help microbes overcome the challenge of drought, she expected higher enzyme activity in the plots with plant litter added compared to the control treatment. Both of these taken together would indicate that drought is stressful for microbes, but we can help them out by adding resources like plant litter to soils.

Featured scientist: Jennifer Jones (she/her) from the Kellogg Biological Station Long Term Ecological Research Site. Written with Melissa Frost and Liz Schultheis.

Flesch–Kincaid Reading Grade Level = 8.2

Additional teacher resources related to this Data Nugget:

To introduce this Data Nuggets activity, students can watch a talk by Jennifer when she made a classroom visit to share her background and research interests. This video is a great way to introduce students to scientist role models and learn more about what a career in science looks like, as well as get an introduction to the themes in the research.

There is also a video of Jennifer and her scientist colleague, Grant Falvo, out in the field talking about their research under the rainout shelters.

For more information about the rainout shelter experiment, students can watch this short video featuring Jennifer Jones and another scientist on the team, Grant Falvo:

These data are part of the Kellogg Biological Station Long Term Ecological Research Program (KBS LTER). To learn more about the KBS LTER, visit their website.

Do you feel the urban heat?

Attaching a heat sensor to a street sign in Miami to monitor urban temperatures.

The activities are as follows:

Record-breaking temperatures climb higher every year, and Florida is no exception. In Florida, the impact of climate change is felt mostly during the hurricane season. Storms are becoming more violent and show up earlier in the season. These extreme temperatures and weather events affect living organisms of all types, including humans. Outdoor workers, the elderly, and all people who lack adequate housing are susceptible to temperature changes in the environment.

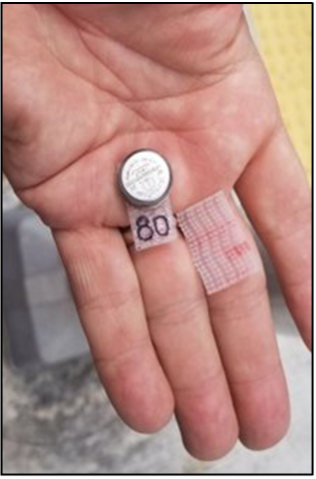
Heat sensor ready to be put out into the city.

Irvin teaches science at a high school in Miami, Florida. On his way to work, he listens to a local radio station to catch up on the news. One day the radio hosts were talking about an increase in homelessness in Miami and other cities. They also brought up the record heat that the U.S. was experiencing and how this may affect those without homes. This conversation on the radio made Irvin think. He reflected on the impact that such high heat could have on individuals who sleep without air conditioning.

This inspired Irvin to learn more about what could be done to mitigate the impact of climate change in his city. Irvin joined a program that invites teachers to work in scientists’ labs in the summer to gain research experience. Irvin was matched with Tiffany, a scientist interested in how urban heat can change based on structures like concrete buildings, urban dwellings, and unshaded places. Irvin took this opportunity to explore how high temperatures in Miami affect the daily lives of people living there. First, Irvin started looking into how temperatures are reported in Miami. He learned that there was just a single sensor stationed at the nearby airport. The heat and humidity readings from this one sensor are used by local officials to alert the entire city about dangerous heat levels. Alerts are issued when the heat index reaches 108 degrees Fahrenheit or higher. Heat index is a value that represents how the body feels temperature when humidity is factored in. With these alerts, people can take action by spending less time outside.

Teachers visiting the mangroves in Miami on a record heat day.

Irvin realized that no matter how reliable the sensor at the airport is, there is likely a larger range of temperatures within the city. He wanted to know whether the temperatures at the airport were similar to the heat felt at places where people spend time outside.

Tiffany’s research team had already started to collect temperature data in urban places where they hadn’t been recorded before. Since 2018, her lab placed hundreds of small heat sensors around the city. The sensors go out for 3 months and then the team collects them, records their data, and places them back out into new areas of the city.

Irvin wanted to compare areas that varied in coverage from the sun. He focused on sites where people gathered and spent long periods of time outside – bus stops. Some of the sites he chose had shade from trees, some had a roof providing partial sun cover, and other sites were totally exposed with no shade. Irvin took photos of each bus stop and used them to classify all sites as either full coverage, partial coverage, or no coverage. He used data from the airport as a control comparison to his bus stop sites.

Featured scientists: Irvin E. Arce (he/him) and Tiffany Troxler (she/her) from Florida International University

Flesch–Kincaid Reading Grade Level = 9.6

Little butterflies on the prairie

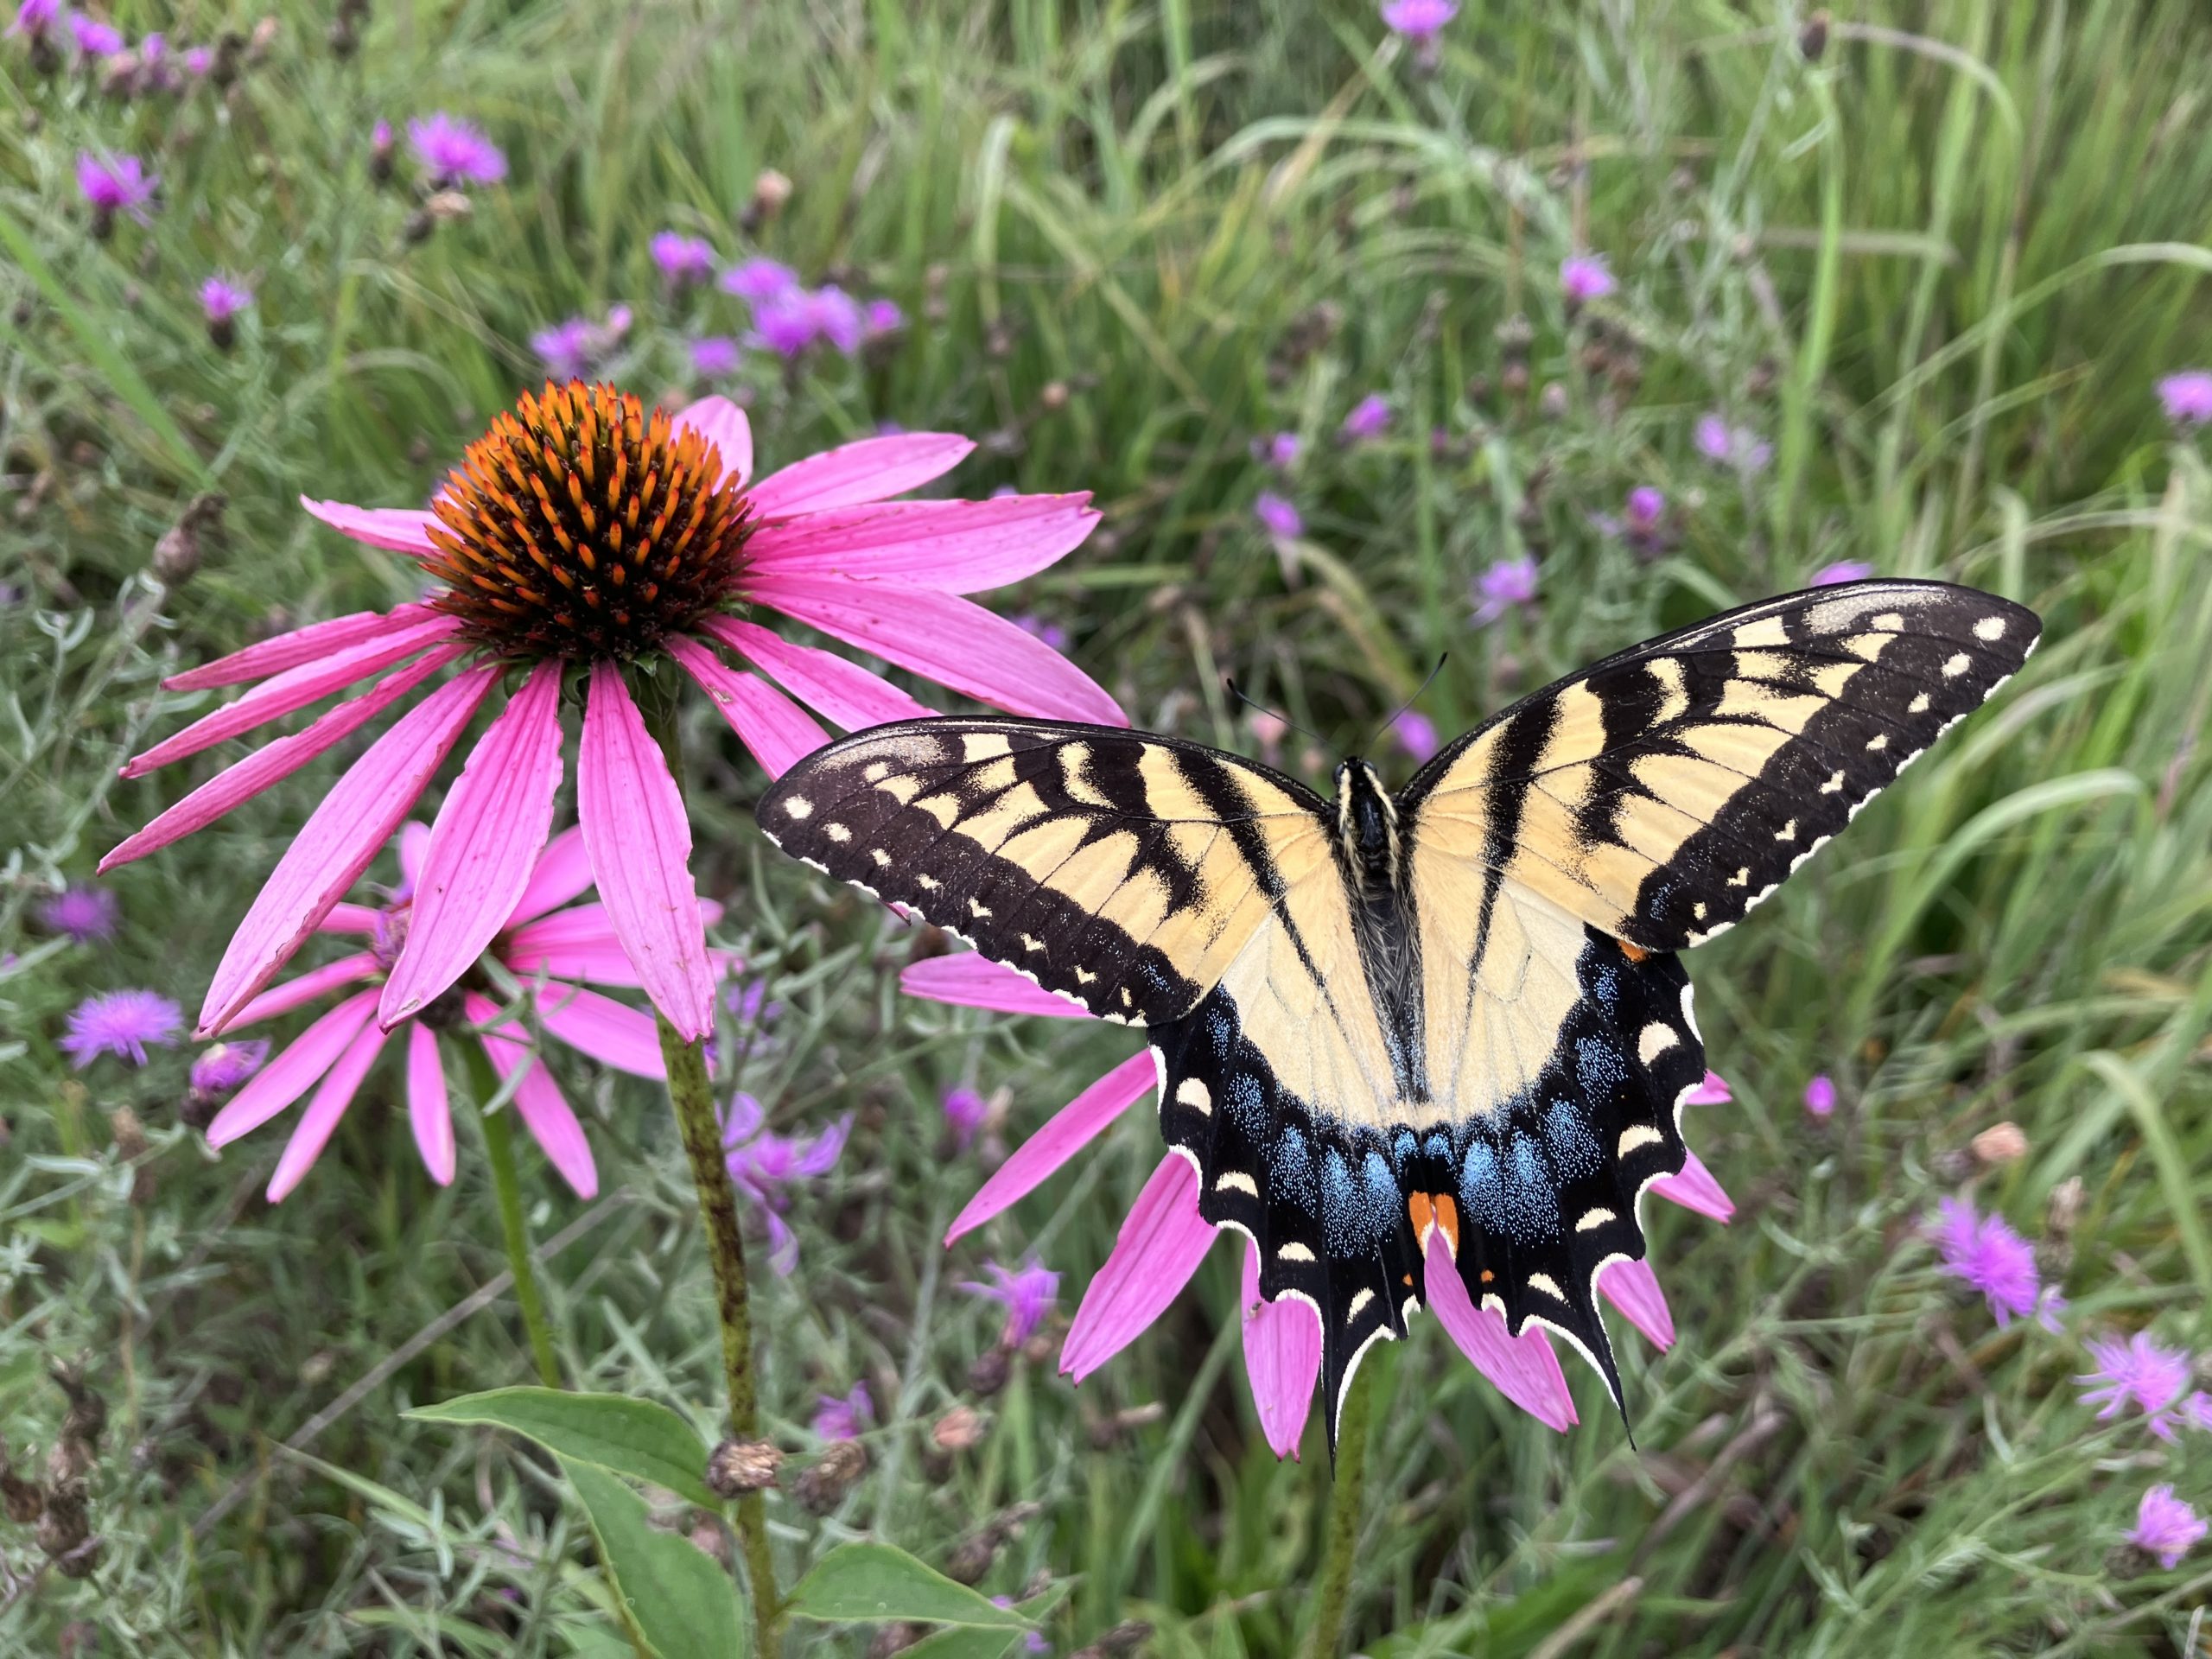
Butterfly on prairie flower.
A Tiger Swallowtail butterfly visiting a prairie flower to drink nectar.

The activities are as follows:

Butterflies are insects with colorful wings. You will often see them in a field, flying from flower to flower. Butterflies eat a sugary food made by flowers, called nectar. In return, the butterflies help the plants make seeds by moving pollen. As they travel from flower to flower, pollen is dropped off. This helps plants reproduce and make seeds. This is called pollination, and butterflies are pollinators. We need pollinators to grow many of the fruits and vegetables that we eat!

Prairies are habitats filled with many types of flowers. The Midwestern United States used to be covered in prairies. Today, most have been replaced by farm fields. Crops like corn and soybeans are commonly planted in the Midwest. Farm fields are important because we need land to grow our food. But this also means there is less food and habitat for butterflies.

Many farmers are concerned with growing our food while still protecting habitat for butterflies and other species. They want to know – how can we grow food for ourselves while still growing flowers for butterflies? A group of scientists in Michigan is working with farmers to think of solutions. The team is made of people from many different backgrounds and work experiences. The members of the team change over time, but typically 8 scientists are working together at a time. They all come together to brainstorm and do their research at the Kellogg Biological Station in Michigan.

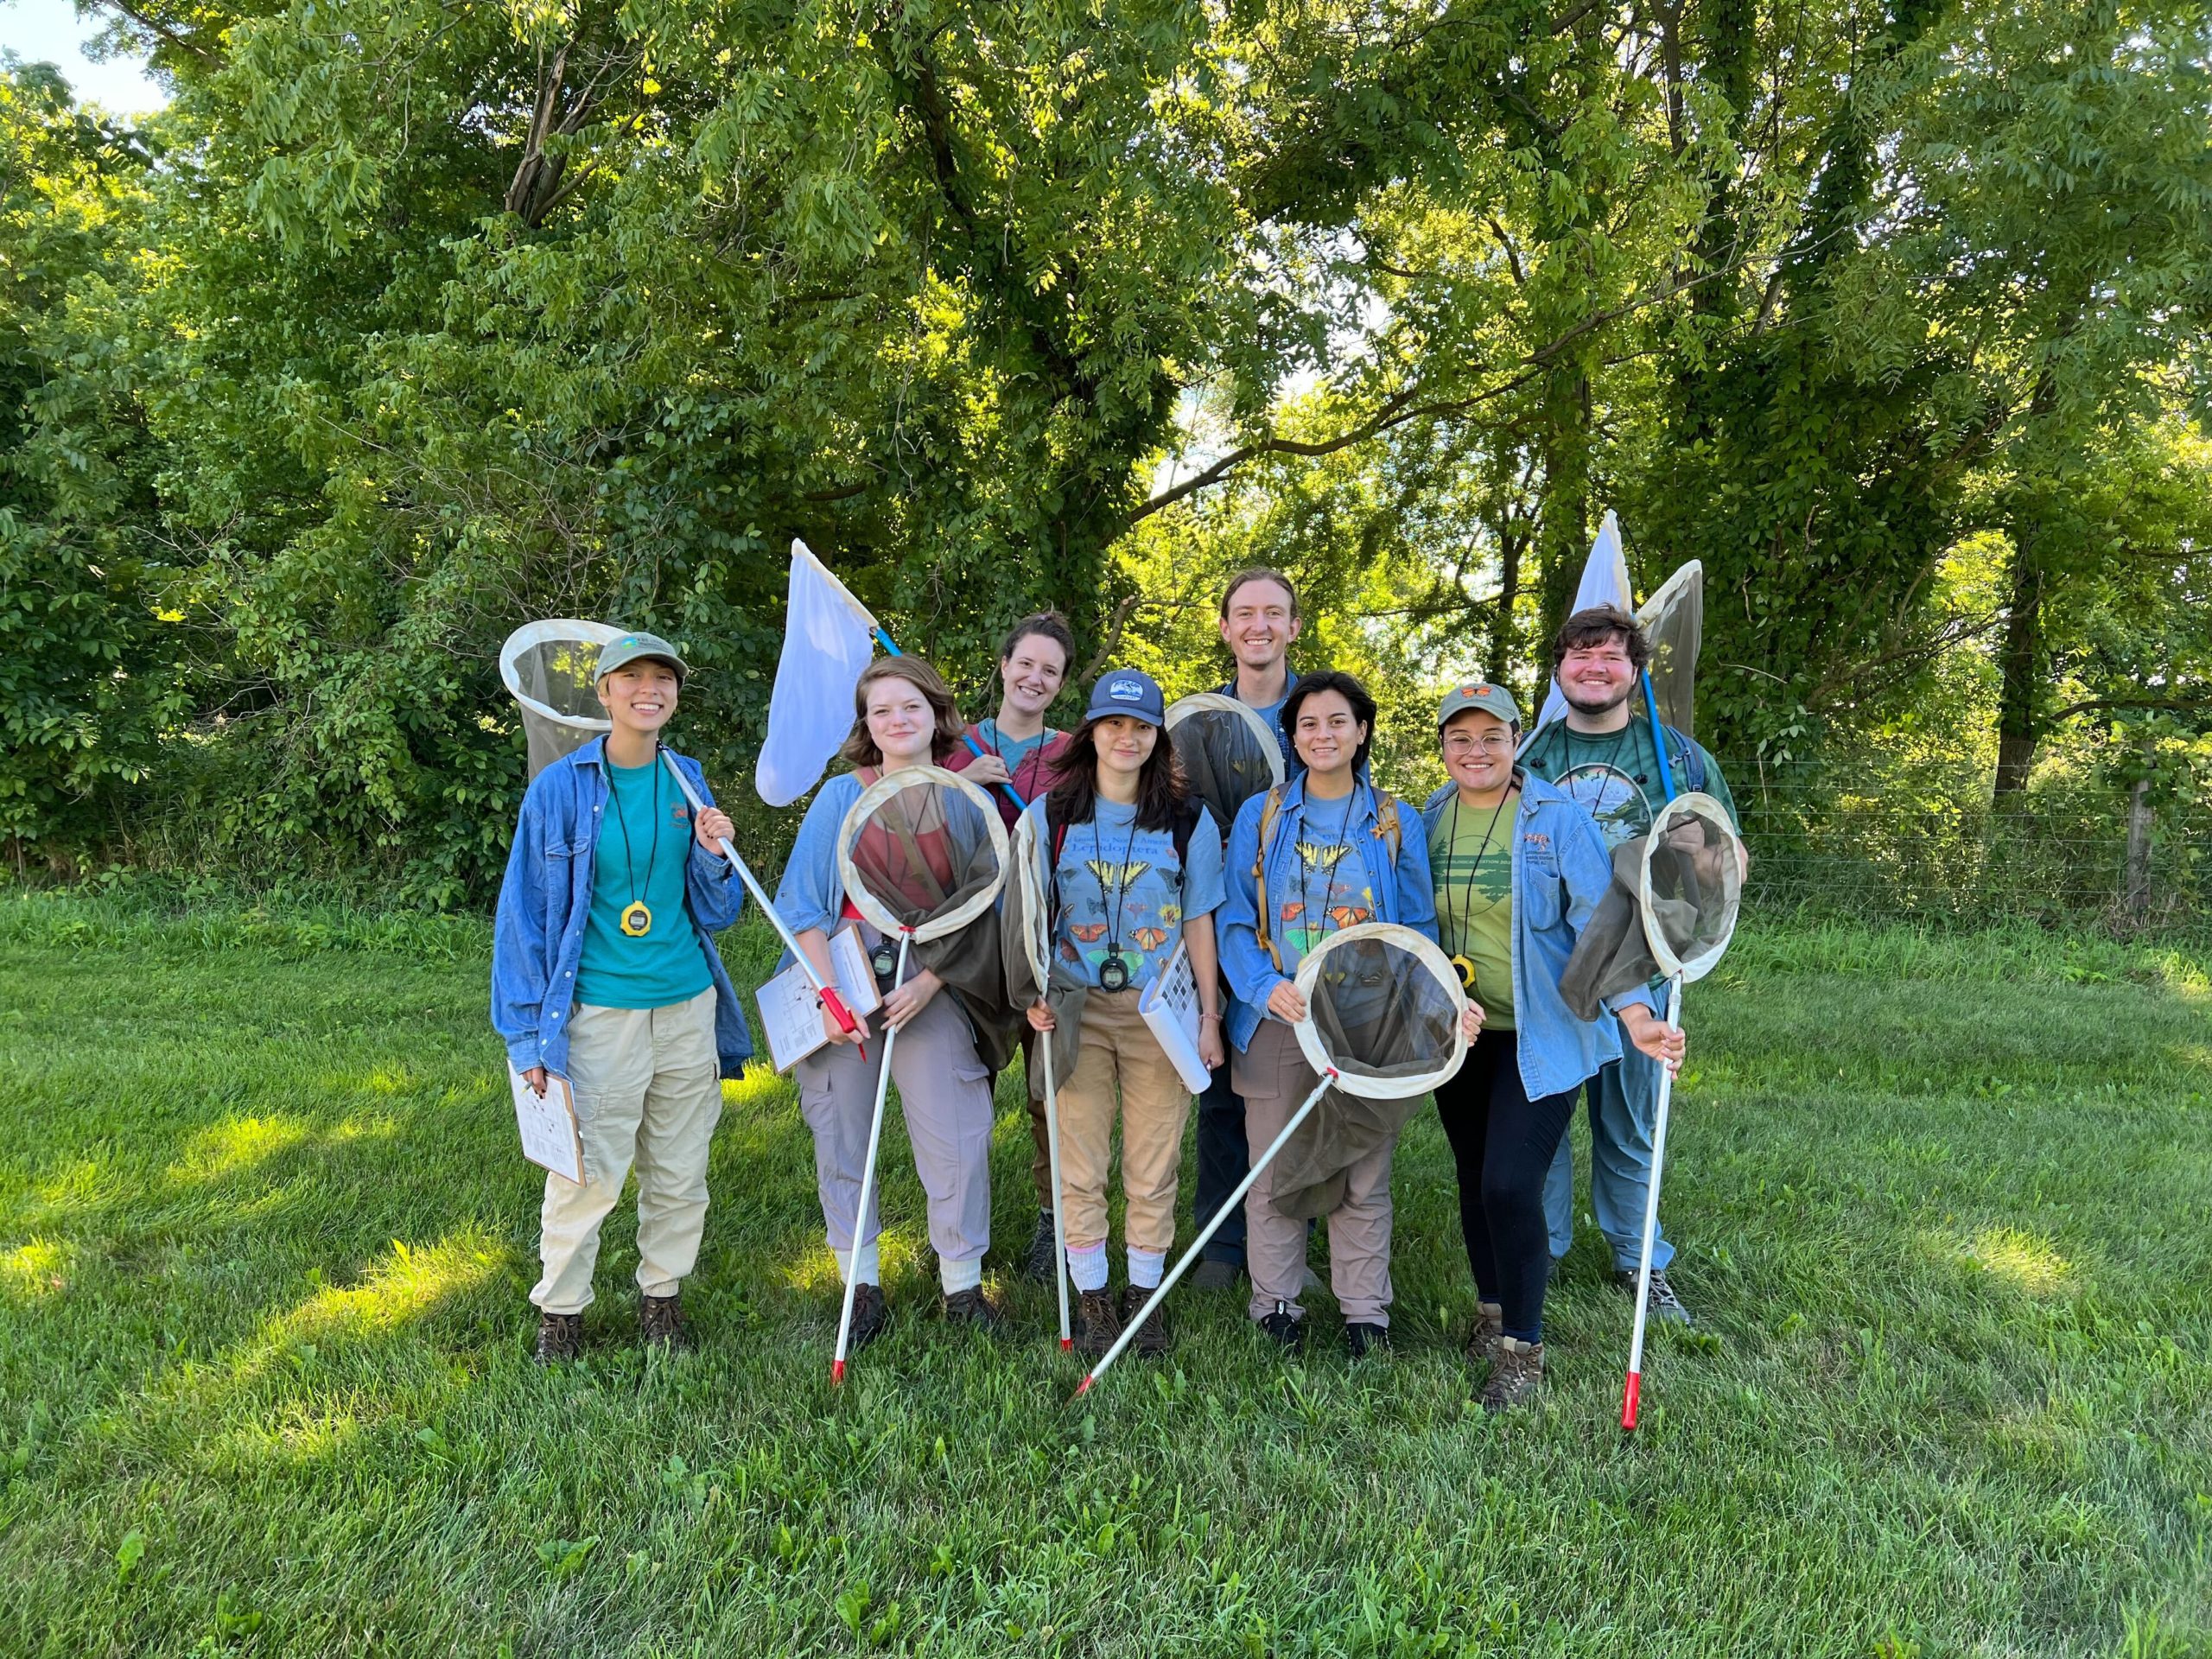
Group of researchers ready to go out into field to butterfly survey.
Members of the Haddad Lab, ready to go out for a day of butterfly sampling in the prairie strips!

Prairie strips are a new idea that might help both farmers and the environment. These strips are small areas of prairie that can be added to farm fields. They look like rows of flowers and grasses within a field. They create habitat for many species, like butterflies, birds, ants, and even microscopic fungi and bacteria! Prairie strips may also help our food grow better by providing habitat for pollinators.

To figure out if prairie strips are able to draw in butterflies, the research team needed to collect data. They visited a large experiment that had many different kinds of farm fields. Some of the fields had prairie strips, while others did not. They thought prairie strips would help butterflies by adding habitat for them in farm fields that usually don’t have many flowers. They predicted they would see more butterflies in fields that have prairie strips and fewer in fields without these strips.

To count the butterflies in each type of field, the team went out on sunny spring and summer mornings when butterflies were flying around and eating nectar. They walked along the same paths in the same fields at the same time every week. Each time, they counted all the butterflies they saw within 5 meters. Each walk was 12 minutes long and followed a 150-meter path. They did these counts in 6 farm fields without prairie strips and 6 farm fields with prairie strips. The team counted butterflies like this 20 times over the summer. At the end of the summer, they added up all of the butterflies observed in each field. This number is called butterfly abundance.

Featured scientists: The Haddad Lab from Kellogg Biological Station Long Term Ecological Research Program – KBS LTER

Flesch–Kincaid Reading Grade Level = 7.3

Sink or source? How grazing geese impact the carbon cycle

Tricia (left) installing carbon dioxide plots in the field.

The activities are as follows:

“If it wasn’t for the geese, you and I would not be here today because our ancestors would not have made it. When long, hard winters emptied people’s food caches early, starvation loomed. Return of geese in April saved us.” – Chuck Hunt, born and raised on the Yukon-Kuskokwim Delta

Spring geese are an essential food source for subsistence communities like Chevak, Alaska. Elders in western Alaska Native communities have observed a decrease in geese returning to their villages over time. These changes affect the local communities and could also affect the local ecosystem.

One way geese change their environment is by eating grass. In the Yukon-Kuskokwim Delta in western Alaska, birds from every continent on Earth migrate to this sub-Arctic habitat to lay their eggs and raise their young. Once they arrive, geese eat a ton of grass. They graze only in specific areas, called grazing lawns, leaving the rest of the vegetation alone.

When geese graze on wetland plants, they remove plant matter, potentially decreasing the amount of carbon dioxide, or CO2, that is absorbed during photosynthesis. As plants photosynthesize, they take CO2 from the atmosphere and turn it into glucose (a sugar) and oxygen. Gross primary production is the total amount of energy that plants capture from sunlight to grow and live before they use up some of that energy for themselves. Plants can slow climate change by removing CO2 from the atmosphere and turning it into plant matter, like leaves and roots.

A scientist mimics geese grazing by clipping the grass.

Trisha is a scientist who became interested in ways that animals can affect the carbon cycle through their interactions with the environment. She wondered whether fewer geese returning to western Alaska could have global consequences that extend beyond remote communities. She thought that if geese ate enough grass, they may limit photosynthesis. This is important because it could change whether this ecosystem is a carbon sink or a carbon source. An ecosystem is called a carbon sink if it absorbs more CO2 through photosynthesis than it releases through respiration. Alternatively, an ecosystem can be a carbon source if more CO2 is released than absorbed. We want ecosystems to be carbon sinks because then they keep CO2 out of the atmosphere, where it contributes to global warming.

To test her idea, Trisha teamed up with fellow scientists Bonnie, Karen, and Jaron to take a closer look at how grazing grass influences whether the Y-K Delta ecosystem is releasing or absorbing CO2. To do their experiment they had to get creative. They considered getting a lot of geese, bringing them to an ungrazed area, and letting them chow down. However, it’s hard to capture geese and get them to graze exactly where you want. So instead, the research team simulated the effects of geese by cutting the grass to mimic nibbling and then gently vacuuming the pieces of grass to remove them.

The “Carbon and Geese” scientist team.

The team set up six different experimental areas. Inside each area were two plots: one that was left ungrazed, and the other which was artificially grazed. The research team then used a piece of equipment called a LI-COR to measure the quantity of CO2 in the air above each plot. They recorded the CO2 levels during the day and night. The comparison from day to night is one way to look at gross primary production and respiration in a system. At night, when there is no light, plants can’t photosynthesize, so the detected CO2 will be from respiration. The levels during the day represent a combination of CO2 absorption by plants and release from respiration.

To assess whether the ecosystem is a carbon sink or source, we need to determine the difference between respiration and gross primary production, or net ecosystem exchange (NEE). A negative NEE means the ecosystem absorbs more CO2 than it emits. A positive NEE means the ecosystem is releasing more CO2 than it is absorbing. In this way, scientists classify an ecosystem as either a carbon sink that is storing carbon or a carbon source that is releasing carbon into the atmosphere.

Featured scientists: Trisha Atwood, Karen Beard, and Jaron Adkins from Utah State University and Bonnie Waring from Imperial College. Written by Andrea Pokrzywinski.

Flesch–Kincaid Reading Grade Level: 8.9

Additional teacher resources related to this Data Nugget:

Check out this website created by teacher Andrea who participated in the research and wrote this Data Nugget. You will find additional lesson plans, videos, slides, and articles to use in the classroom!