Article Highlights

- Michigan State University’s Data Nuggets program is starting its third round of funding from the National Science Foundation to improve data literacy in K-16 students.
- The program, operated by the Kellogg Biological Station, also introduces real STEM professionals through storytelling, helping students better relate to their projects and engage more deeply with the program’s content.
- In collaboration with Auburn University, the newest NSF grant will help Data Nuggets further that engagement and introduce students to a greater diversity of scientists.
A data literacy program that’s also changing students’ relationships with science and scientists is entering its third round of funding with a new $1.5 million grant from the National Science Foundation.
In collaboration with Auburn University, the Data Nuggets program at the W.K. Kellogg Biological Station, or KBS, will work to identify factors that improve equity and success in undergraduate STEM education.
Launched by Michigan State University in 2011, Data Nuggets is a curriculum development project designed to help students better understand and use data. The program shows how professionals in science, technology, engineering and math really work with data by sharing their stories, which also enables students to relate on a much more personal level.
Data Nuggets challenges students from kindergarten through undergraduate levels to answer scientific questions using data to support their claims. The questions and data originate from real research provided by scientists whose studies range from physics to ecology to animal behavior.
To add the personal element, Data Nuggets is collaborating with Project Biodiversify — another education program started at MSU — to add the scientists’ bios, which include information like hobbies and their lives outside of science. This helps students relate to the researchers and see them less as strangers in lab coats and more as scientific role models.
“We’ve found that it’s the scientists that are engaging students in the activities,” said Elizabeth Schultheis, co-leader of the Data Nuggets program. “If they connect to the role model, then you can get students to do the data literacy activities because they know, ‘Oh, this is a real person. I relate to this person. And I’m working with authentic, real data. I’m not just doing busy work.’”
Schultheis, who earned her doctorate in plant biology from MSU, is also the education and outreach coordinator for the Long-Term Ecological Research, or LTER, program at KBS, which supports Data Nuggets. Schultheis and co-leader, Melissa Kjelvik, developed and run the program, forming partnerships to research and fund the program.
“With our current research, we’re trying to figure out what is the special thing that’s really resonating with students in terms of the role models,” Kjelvik said.
“Our research will investigate how and why role models are critically important for students,” said Cissy Ballen. Ballen is an associate professor in the Department of Biological Sciences at Auburn, the lead institution on the NSF grant, which builds on the past success of Data Nuggets and will help ensure its future impact.
“The theory behind this is that students must be able to see a scientist’s success as attainable to relate to that scientist,” Ballen said. “My prediction is that students will find success most relatable when they see some scientists, like them, have struggled with science, but then were able to overcome that struggle.”
Making data talk
Many students’ eyes gloss over when they hear terms like “data” or “science.”
Even Schultheis admits she didn’t appreciate the significance of data until she was a grad student collecting her own. The problem, she said, is that kids are often taught how to make a graph, for example, but not why.
“I never really learned to care until I understood the reason I make a graph is because I want to answer a question,” Schultheis explained. “I need to see the data, what it looks like. And that’s why I make a graph.”
Data Nuggets doesn’t change the skills that are taught in conventional curricula. Students still learn how to make and label axes, for example, and then how to plot data to create graphs. But they also get a more immersive introduction into why real people use these skills.
“Our purpose with these Data Nuggets modules is that everything is always given real context and always in service of a scientific question,” Schultheis said. “It’s always: Here’s a scientist. Here’s the question that they really care about and the reason they collected this data is because they want to answer this question. And you make the graph to visualize it so that you can see what the data is telling you.”
Data Nugget activities come in four levels, so instructors can use the ones best suited for their specific classes. Level 4 activities are designed for high schoolers and undergraduates, while level 1 activities are appropriate for elementary schools and higher grades looking for a refresher after a summer break, for example.
Teachers also have flexibility with how to present an activity based on their goals. For example, instructors can choose activities with completed graphs so students can focus on interpreting what they see to answer questions.
Or students can be given blank grids to give them experience in creating useful representations of data from scratch.
Connie High, a science teacher at Delton Kellogg High School about five miles from KBS, calls Data Nuggets “a game changer.”
She said that her students, when they’re new to Data Nuggets, can usually make claims and find supporting evidence. The challenge is learning how to articulate the connection between the two.
“They really struggle with how to link claim, evidence and reasoning. They tend to just restate the evidence again,” High said.
“With Data Nuggets, we definitely see an improvement from the beginning of the year to the end.”
Humanizing data
The Data Nuggets program started 13 years ago as a grassroots collaboration between KBS researchers — including Schultheis and Kjelvik, who were then grad students at KBS — and K-12 teachers, including High.
More than 120 scientists have contributed more than 120 data literacy activities since then. Tens of thousands of people regularly use the Data Nuggets website. Links to various Data Nuggets stories can even be found in science textbooks.
“Long-term relationship building is why we got such good insights from teachers about what their students needed, because they already had trust with us, and we went into their classrooms and learned from them,” Schultheis said. “And building relationships with scientists who trust us to tell their stories correctly, who are giving their own stories for students to read and learn about, continues to be critical to our success.”
But exactly how to best package and present the data stories falls to Schultheis and her colleagues. Previous research has supported the idea that focusing on the scientist and why they collected the data is essential. After all, data is just numbers. It’s human interaction that puts numbers in perspective, gives the scientific question context and engages students in the activity.
“Humanizing the data is at the crux of this work,” Ballen said. “Data Nuggets is such a successful resource because of the way they humanize the data component and contextualize it within the science itself and show that it’s being done by relatable scientists. They do that really well.”
With its third round of NSF funding, Data Nuggets is attempting to fine-tune how to best present the scientist role models and the stories to improve student engagement with science even more.
The goal is not only to increase the portrayal of under-represented groups among scientist contributors, but also for students to see that they share some things in common with the scientists they see.
“We used to ask students to draw what a scientist looks like, and they all would draw someone who looks like Albert Einstein,” High said. “It’s incredibly important that they see there are scientists who look like them.”
“You can imagine if you were a student sitting in a classroom you might get an activity that features a scientist from a prestigious university with awards and that sort of thing, and that might not be very relatable,” Ballen said. “Success might not be perceived as attainable.”
Data Nuggets is working to combat that perception.
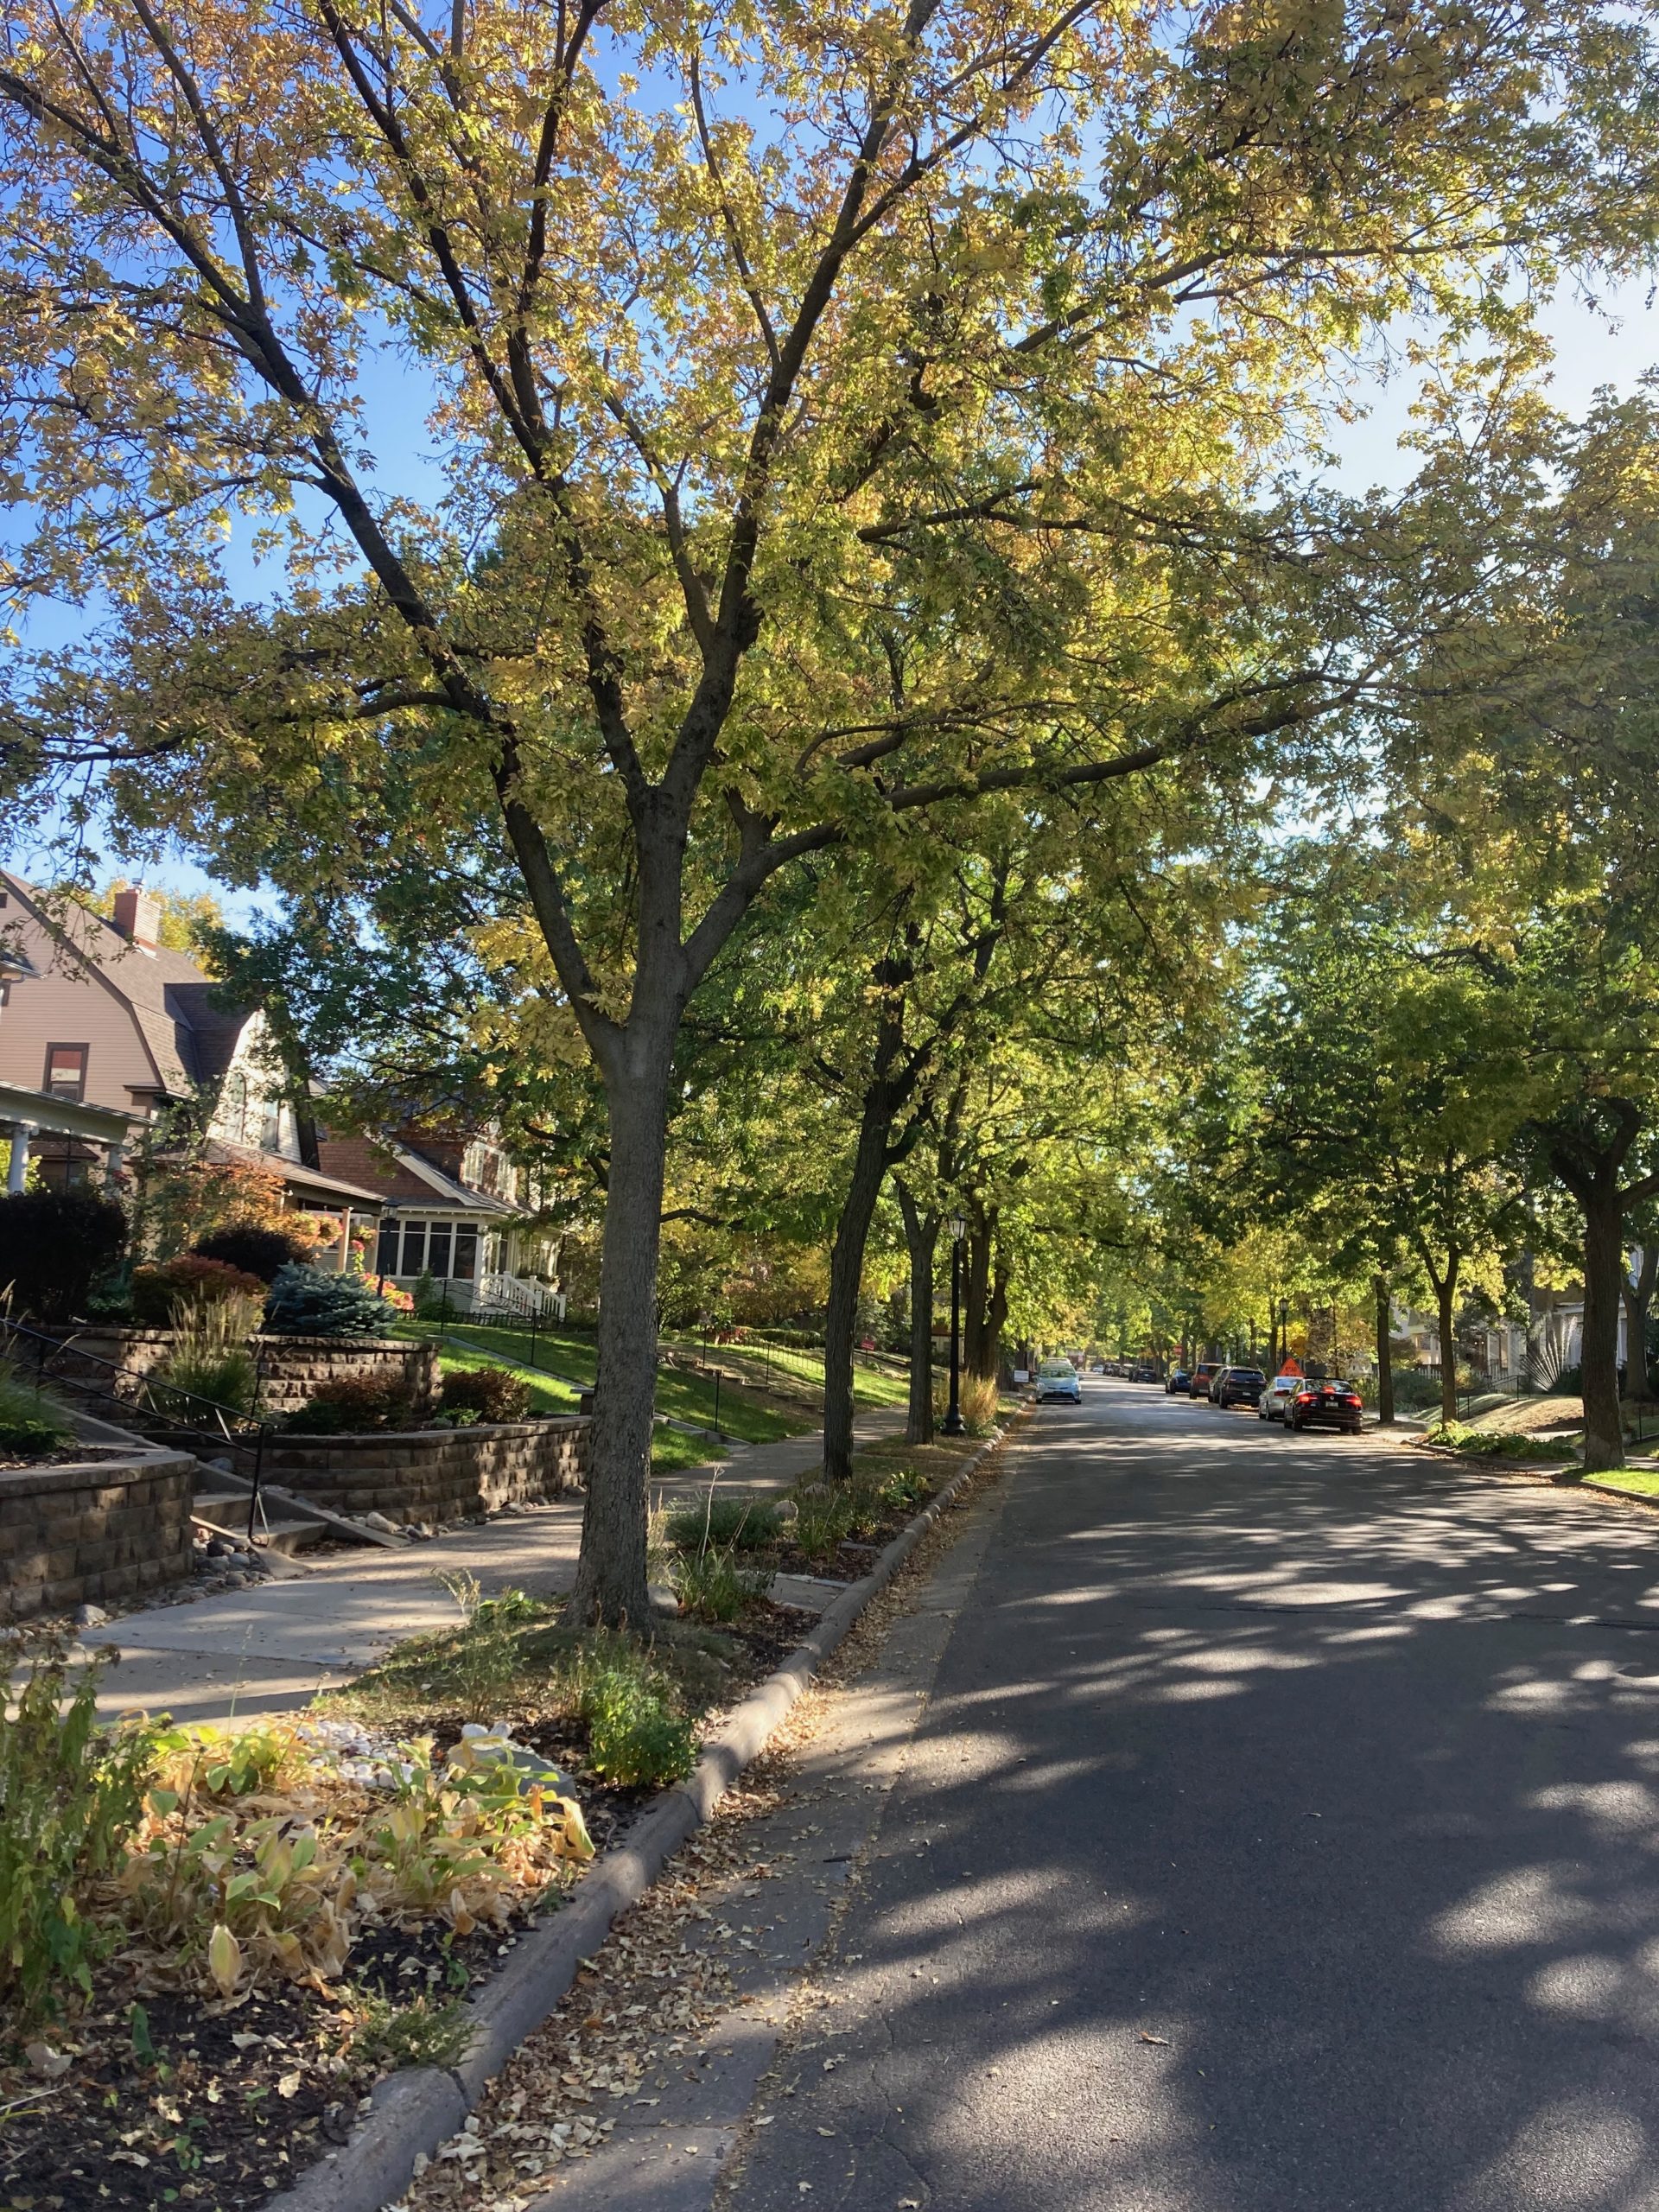
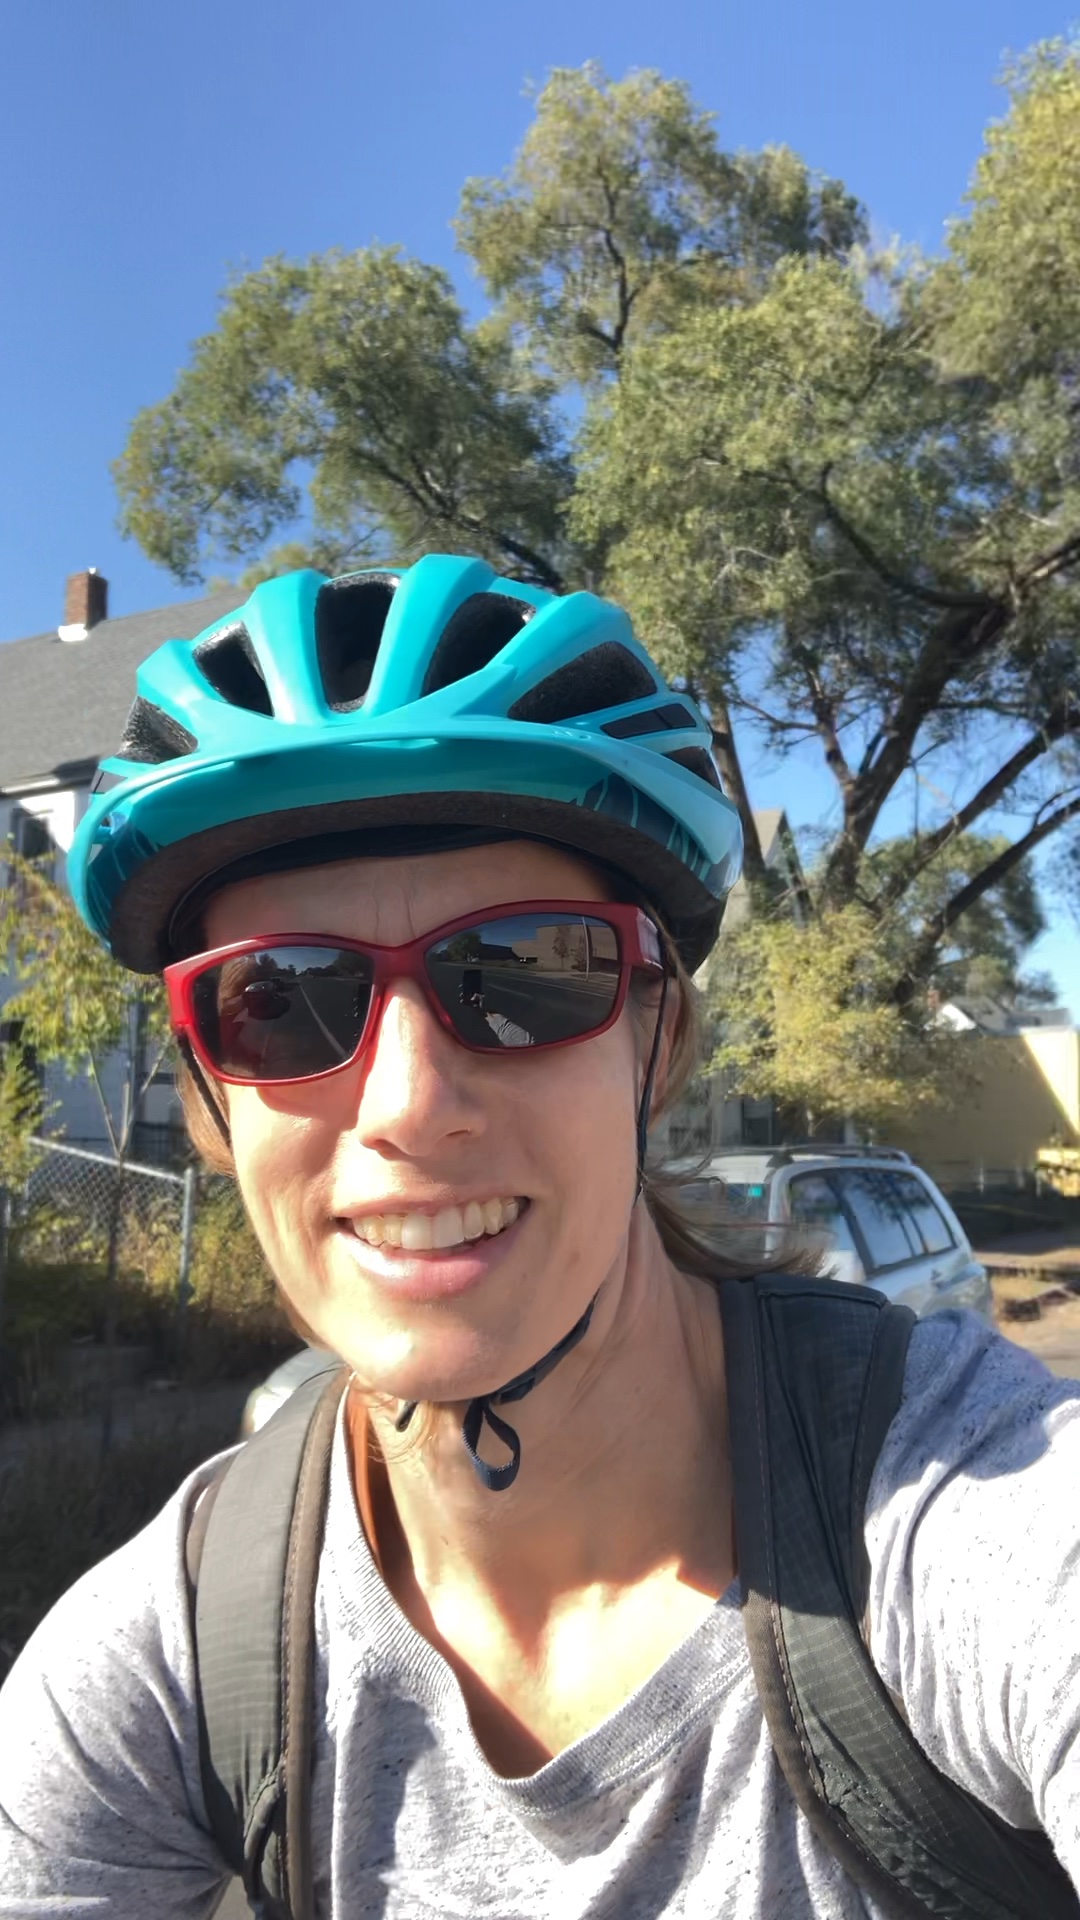
For example, there’s a Data Nugget called “Trees and the City”, featuring a photo of a smiling University of Minnesota ecologist named Adrienne Keller wearing a bike helmet and sunglasses. A video shows Keller riding her bike through neighborhoods in the Twin Cities as she describes her interest in tree patterns. She poses her dataset’s main question: “Are there differences in the total canopy cover or the number of tree species planted in a neighborhood based on residents’ income level or percentage of BIPOC — Black, Indigenous, and People of Color — residents?”
Another Data Nugget was written by a community scientist from Bayfield, Wisconsin, located on the south shore of Lake Superior. He’s pictured wearing shorts and gym shoes as he stands on ice.
For his Nugget, he used historical data to answer his question if the winters were getting shorter and changing the dynamics of how people could travel in the area.
He also happened to be a high school student.
“That’s the dream outcome,” Schultheis said, “that students realize how powerful data are, and they can be advocates for themselves and their communities because they can actually go to the source of information and ask and answer questions.”
This story was written by Lynn Waldsmith, and was originally posted on the Michigan State University, College of Natural Science website here.