The activities are as follows:
- Teacher Guide
- Student activity, Graph Type A, Level 4
- Student activity, Graph Type B, Level 4
- Student activity, Graph Type C, Level 4
- PowerPoint of images
- Grading Rubric
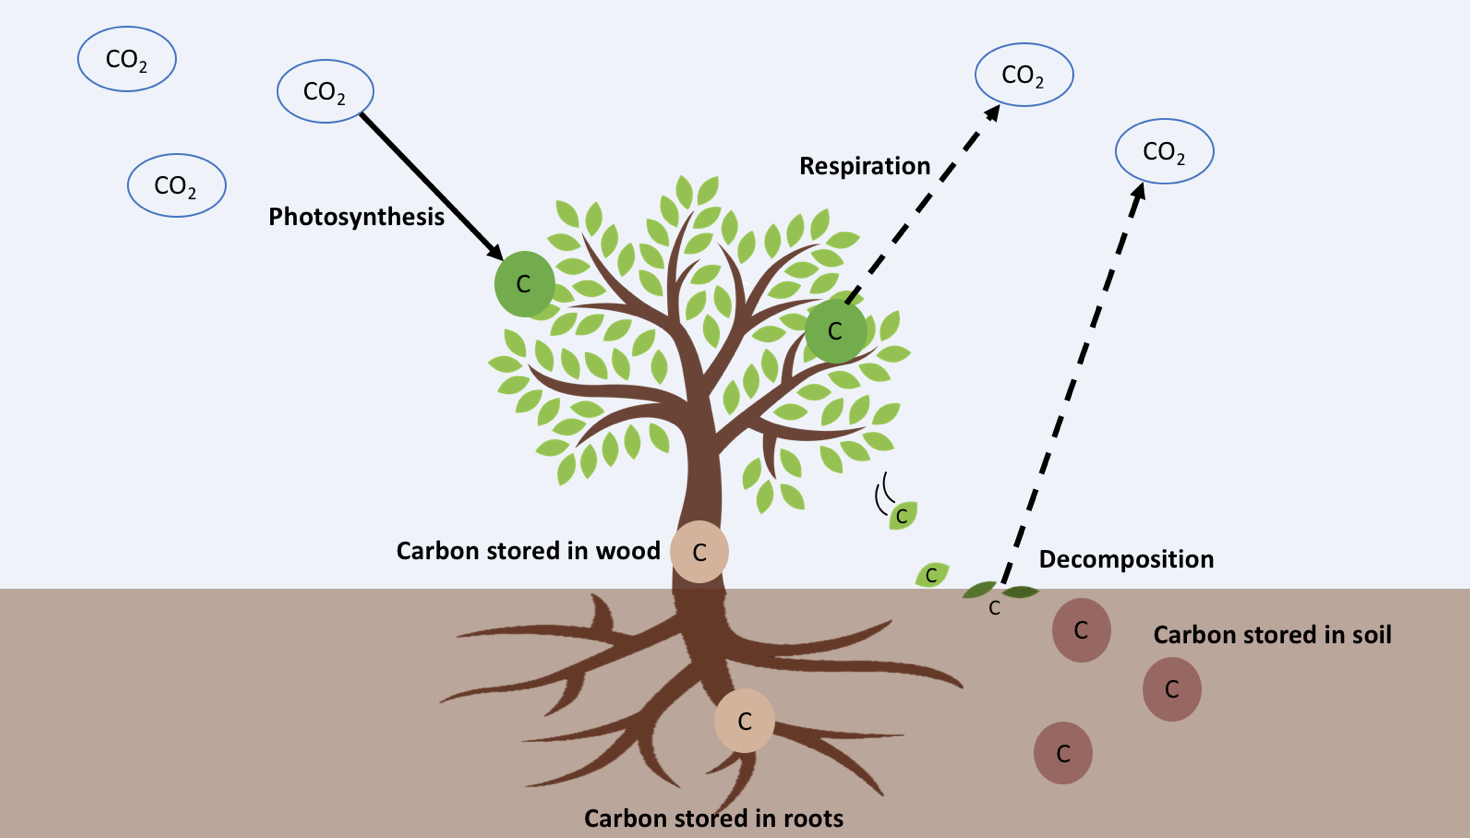
The amount of carbon dioxide (CO2) in the atmosphere has steadily increased since the start of the Industrial Revolution in 1750. This extra CO2 traps heat like a blanket, causing the global climate to warm. The resulting climate change effect is known and widely accepted in science. While scientists are certain that climate change is happening, they still have many questions about its impacts.
For example, scientists today are exploring whether climate change will help or hurt trees and forests. Many scientists think that elevated CO2 in the atmosphere can actually help trees. We can see why in the formula for photosynthesis:
6𝐶𝑂2+6𝐻2𝑂+𝐸𝑛𝑒𝑟𝑔𝑦→𝐶6𝐻12𝑂6 +6𝑂2
Carbon Dioxide + Water + Energy (sunlight) → Glucose + Oxygen
If you add more CO2 to the atmosphere, trees will have more resources for photosynthesis and can make more glucose. Glucose is food for the trees. Trees can use their glucose for growth, using it to make wood. However, trees sometimes have to put glucose towards other things. Just like us, plants break down glucose for energy through cellular respiration:
C6𝐻12𝑂6 +62→ 6𝐶𝑂2+6𝐻2𝑂+𝐸𝑛𝑒𝑟𝑔𝑦
Glucose + Oxygen → Carbon Dioxide + Water + Energy (ATP)
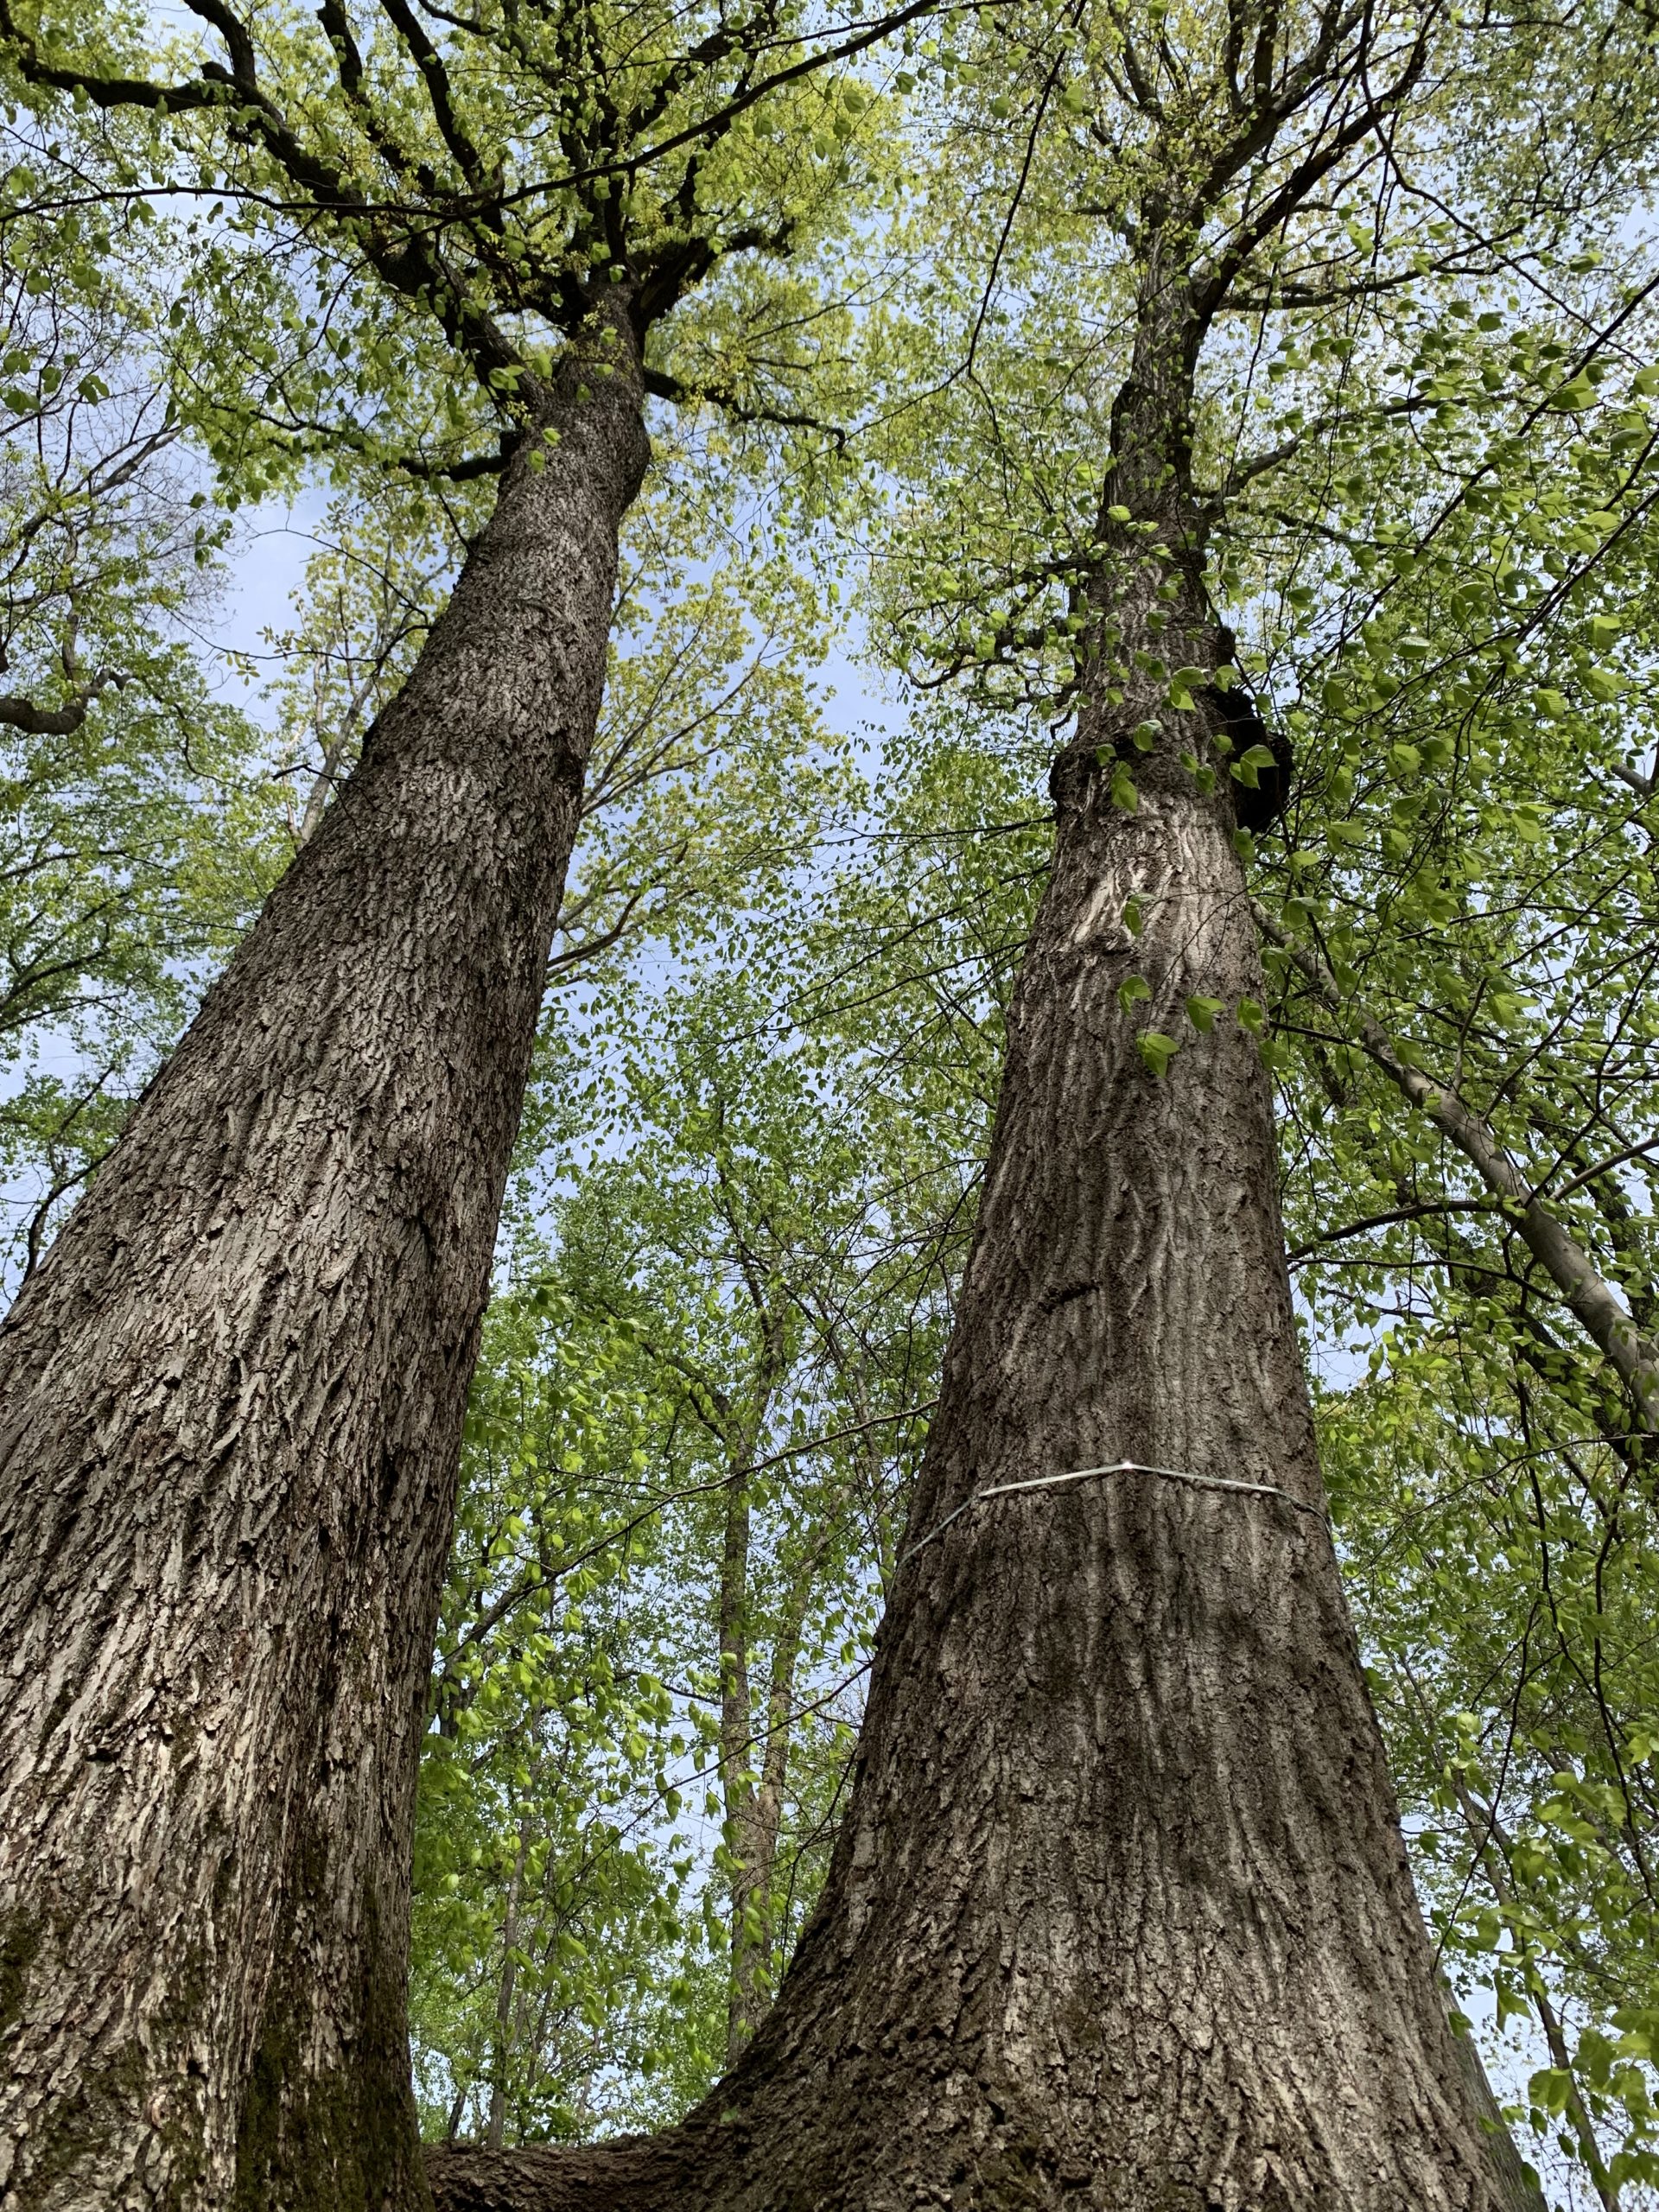
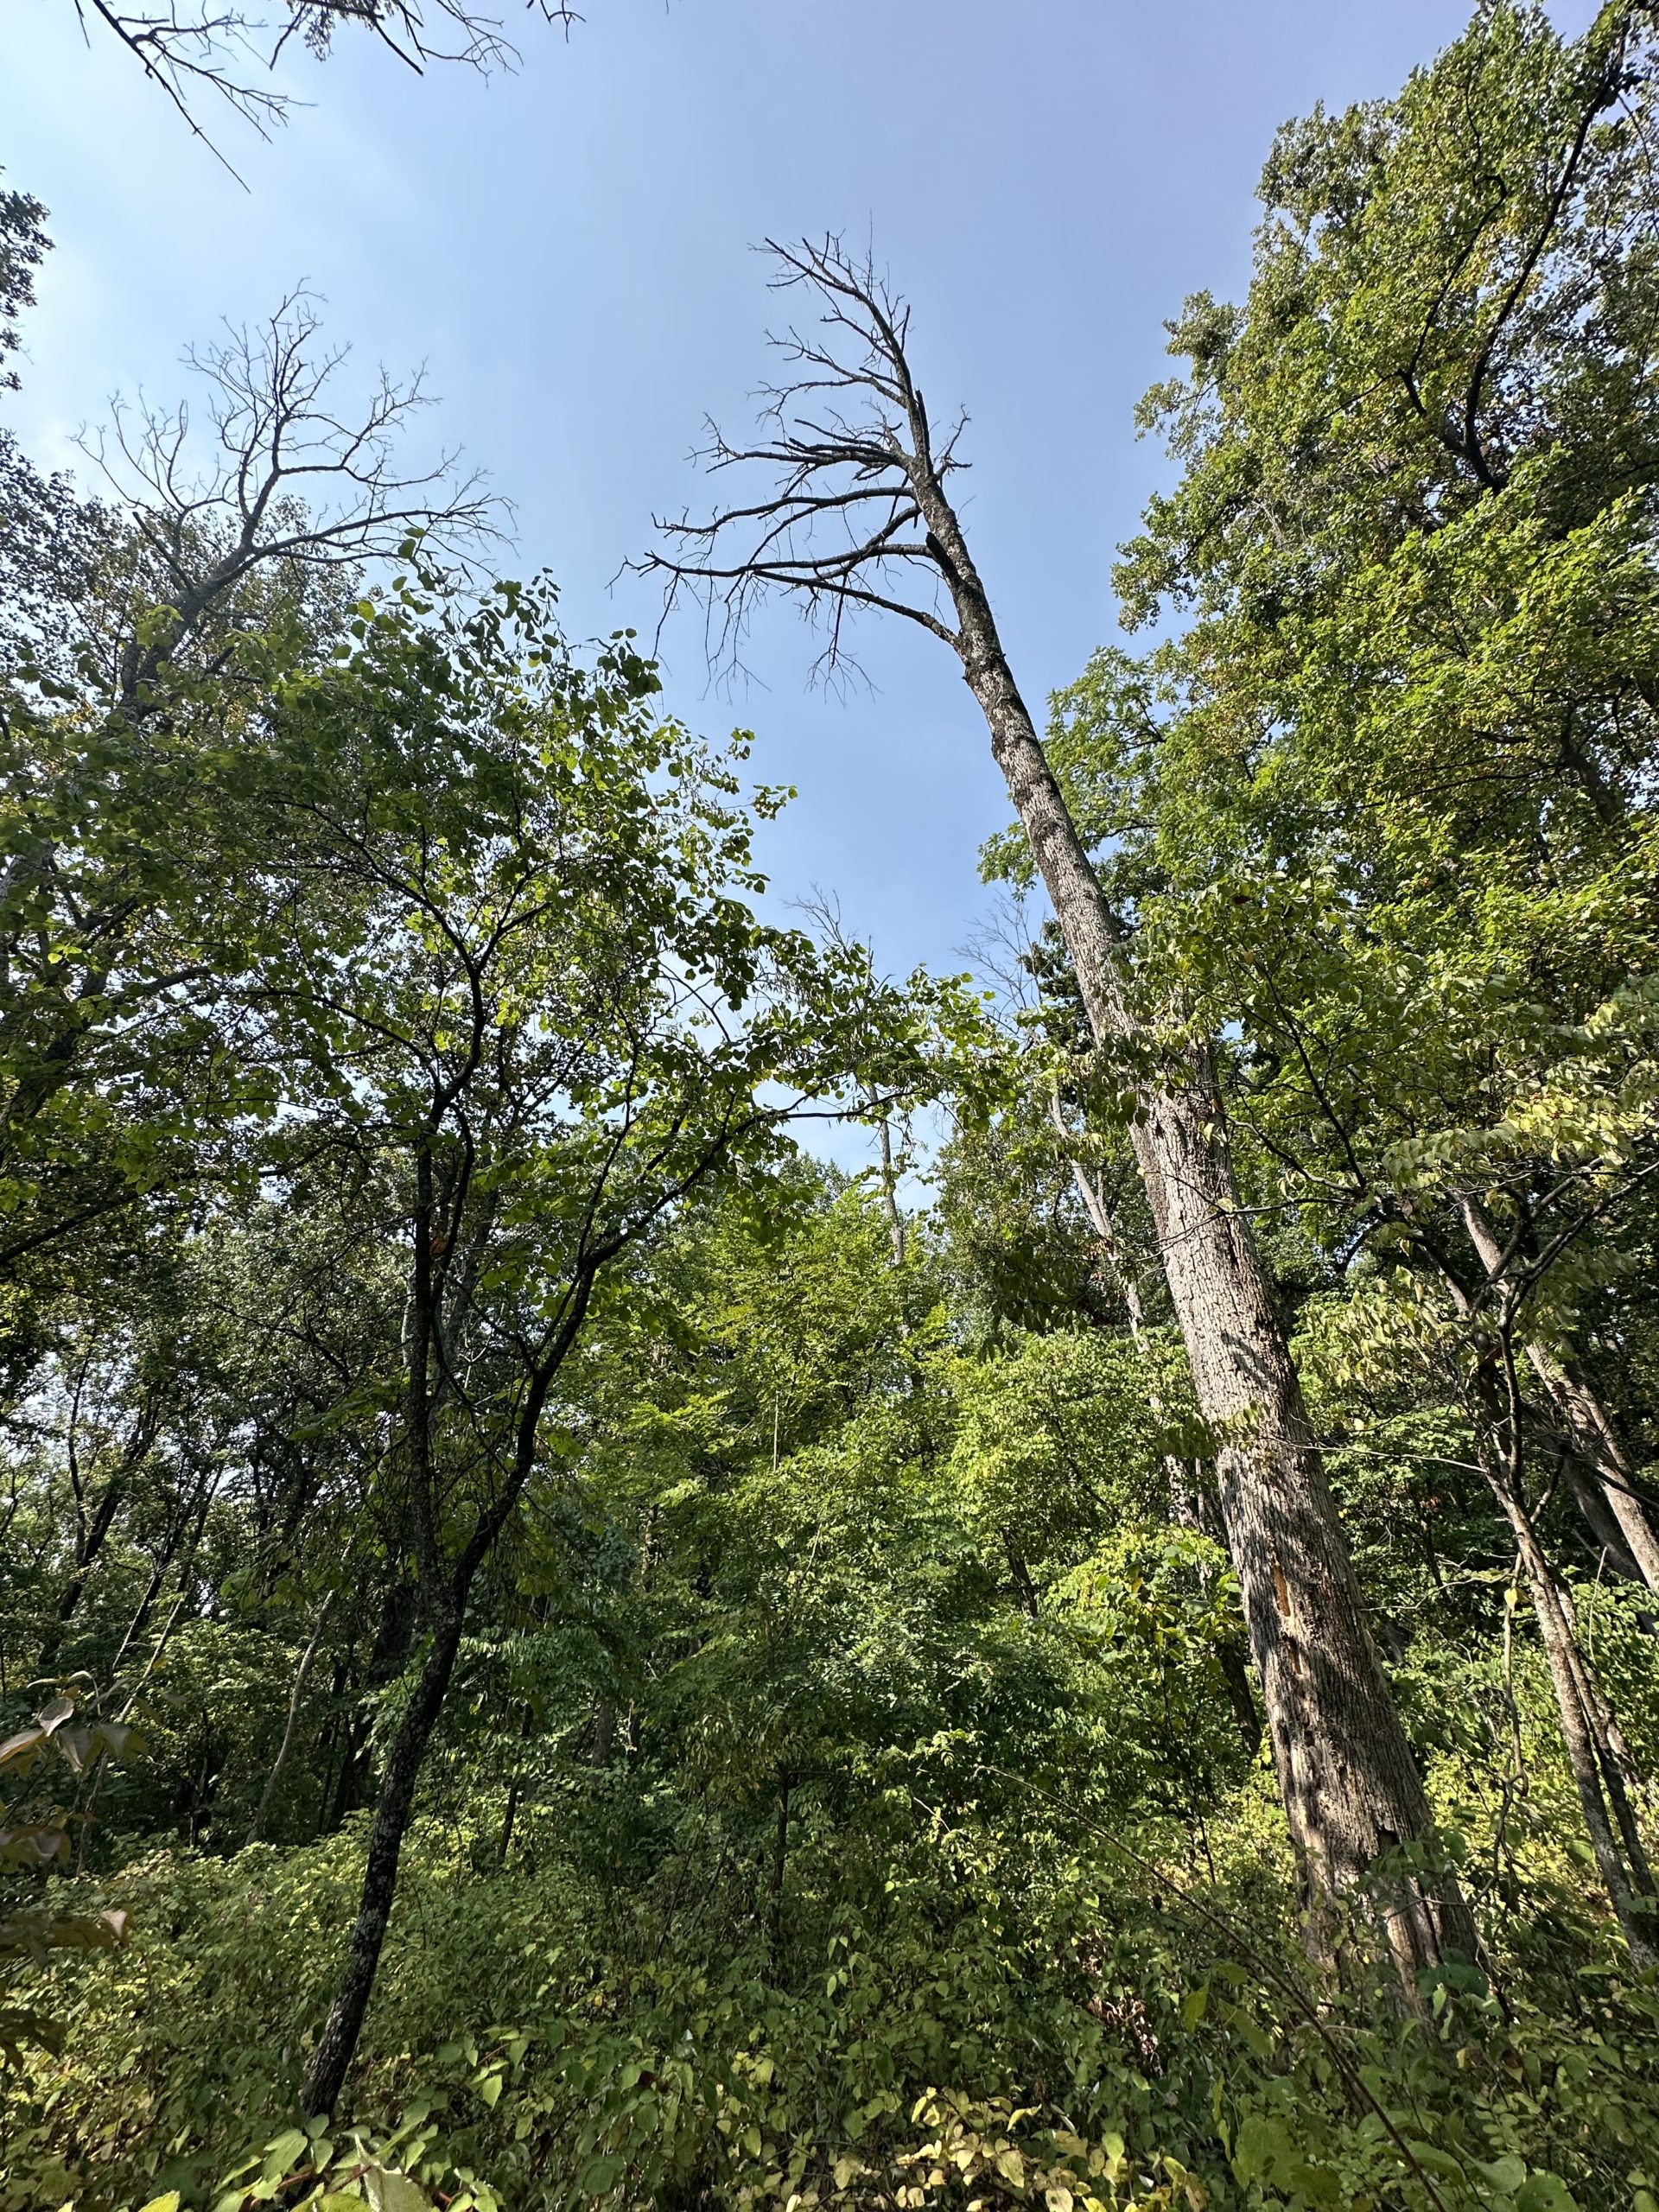
Trees need energy for everyday functioning, or to respond to stress. Under climate change, trees might experience more stress. Stress for trees might increase if summer temperatures get too hot, or they don’t have enough water. More stress means more respiration and less growth. Or, even worse, the trees could die. Dead trees can’t photosynthesize, and they also decompose, which releases CO2 into the atmosphere
as microbes break down wood and other materials.
Kristina and Luca are scientists looking at the effects of climate change on trees. They wanted to test whether climate change was benefitting or hurting trees. They set out to find some data that would allow them to test these alternative hypotheses.
will return to the atmosphere through decomposition.
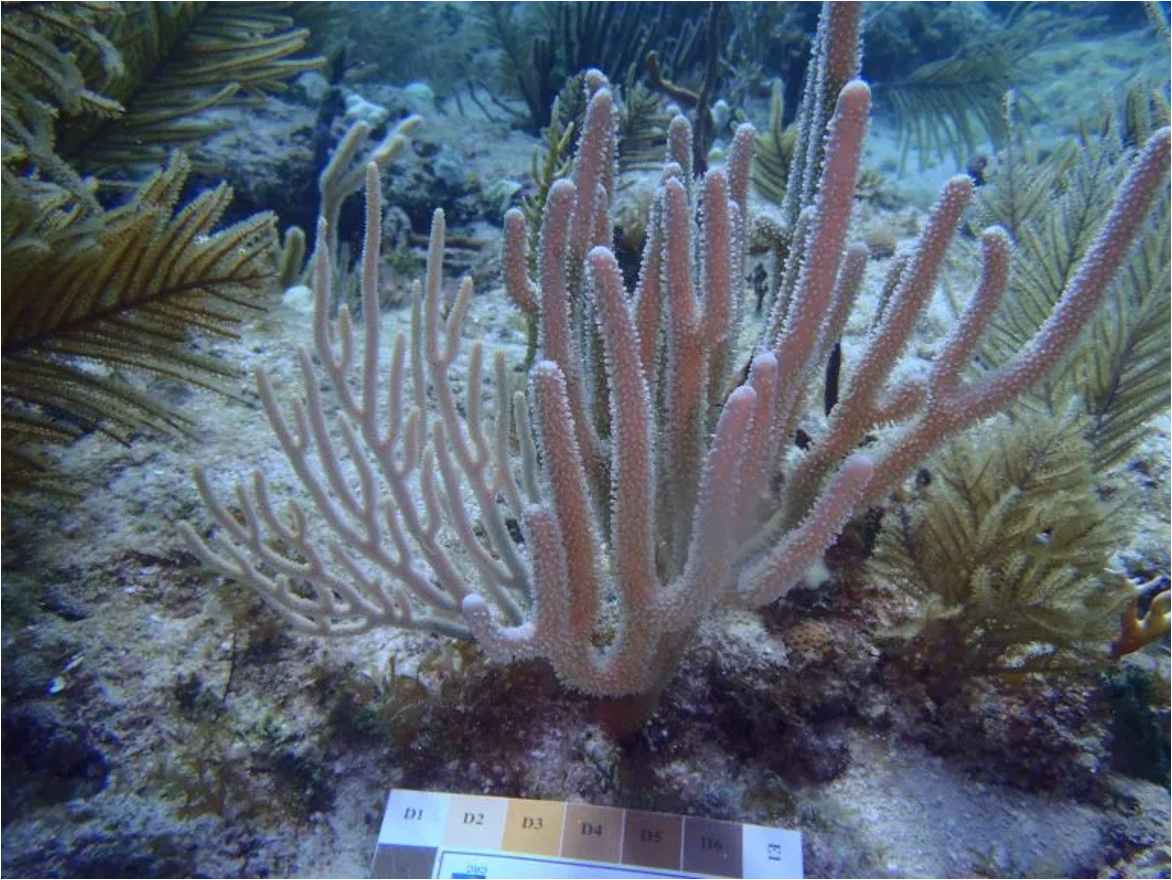
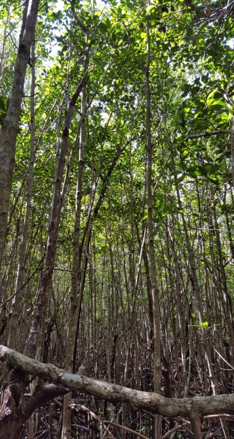
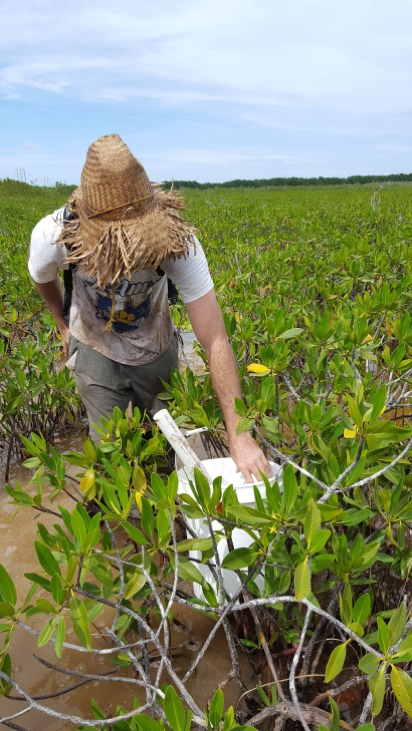
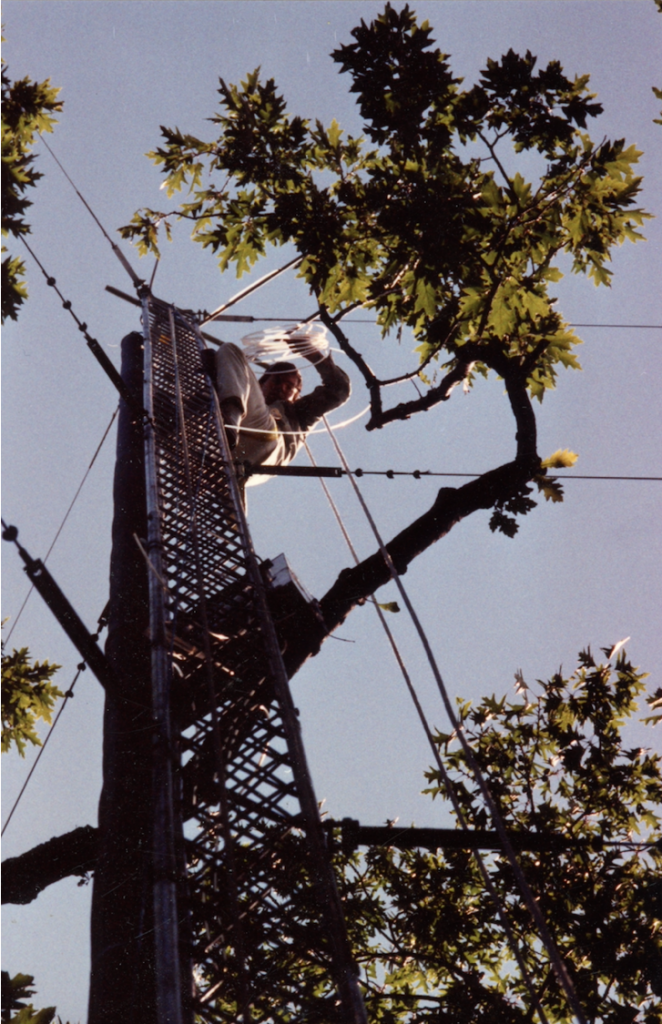
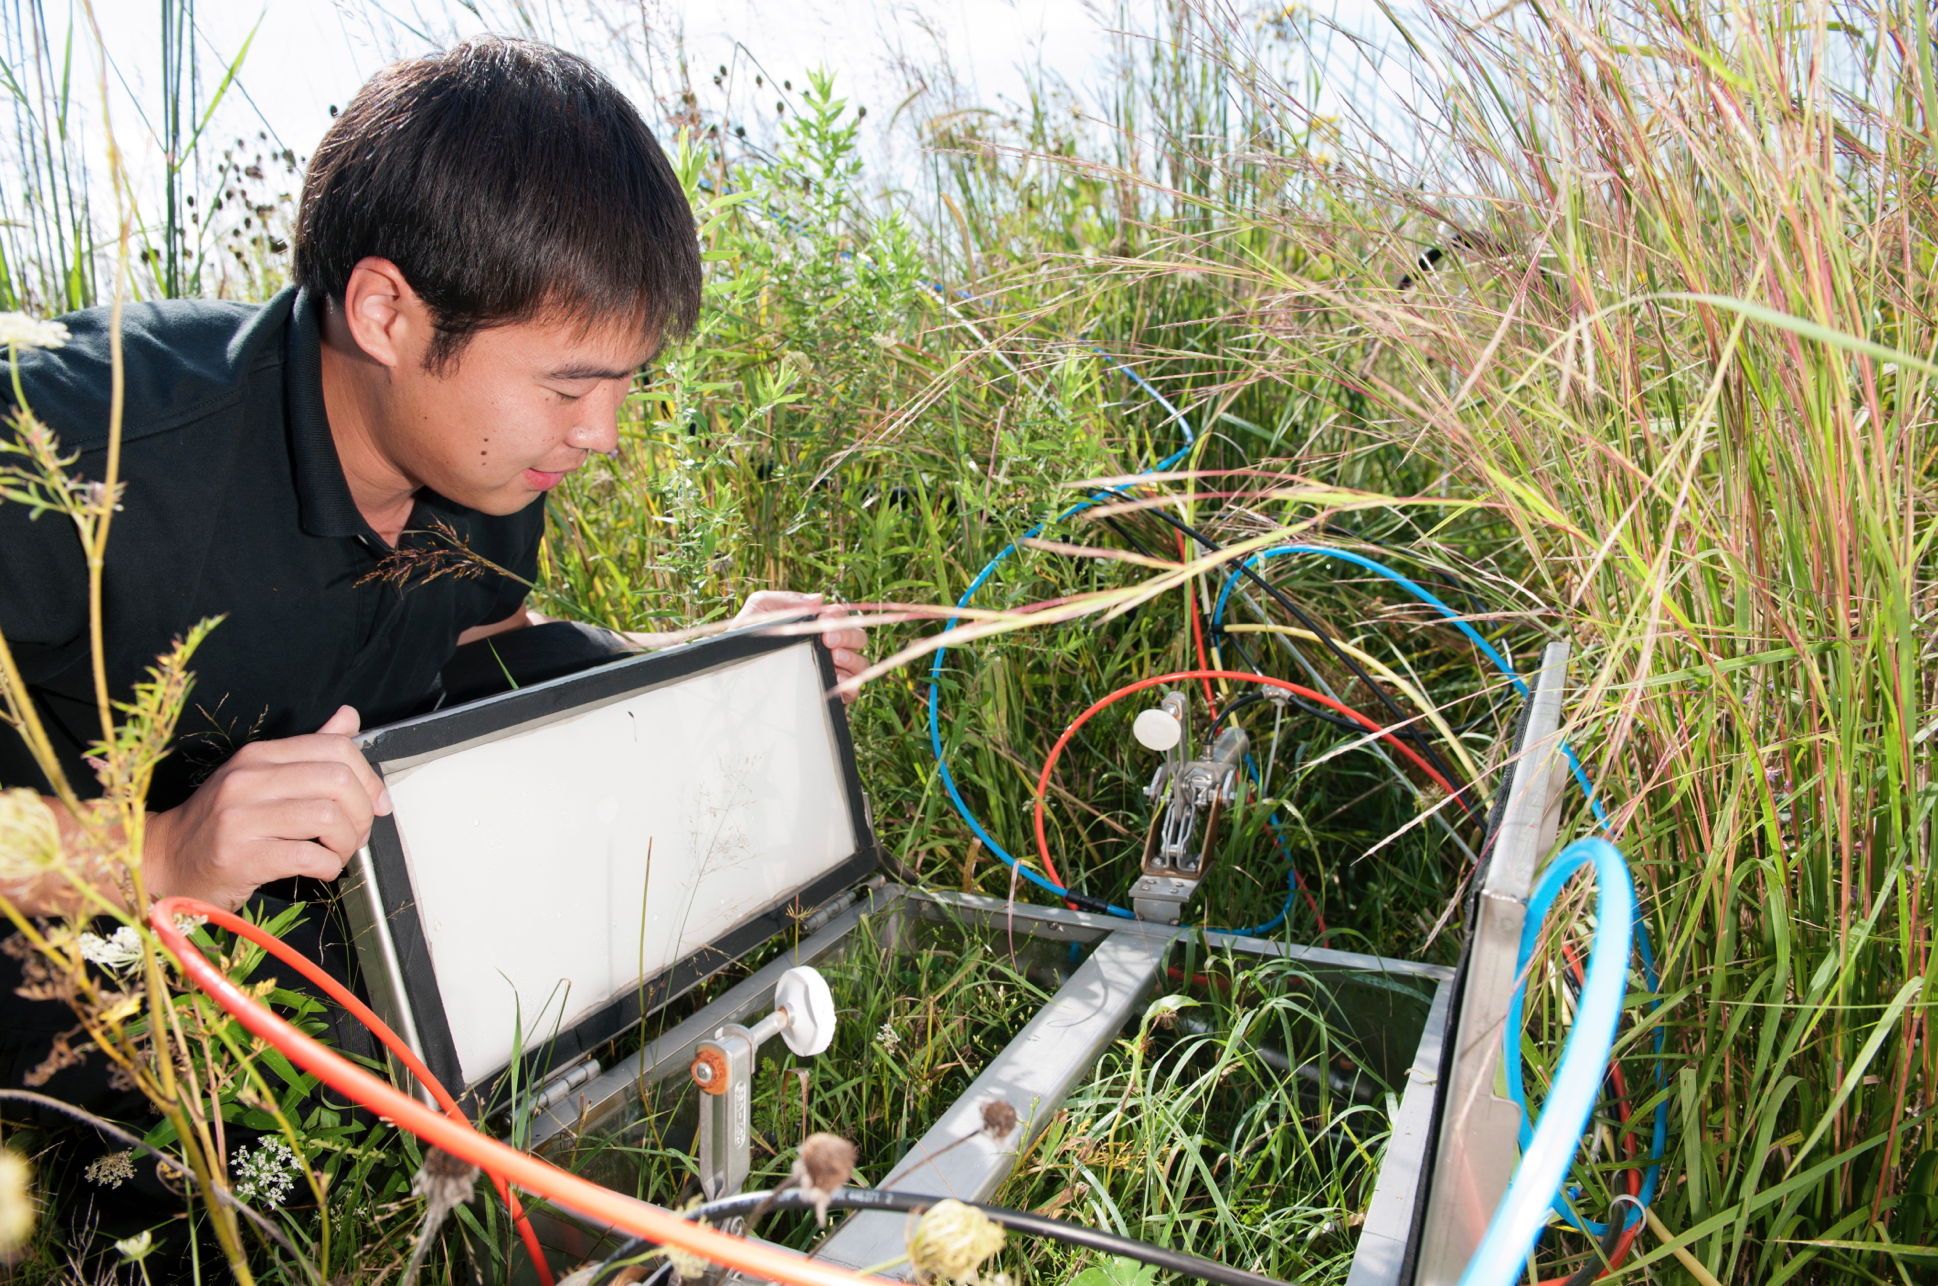
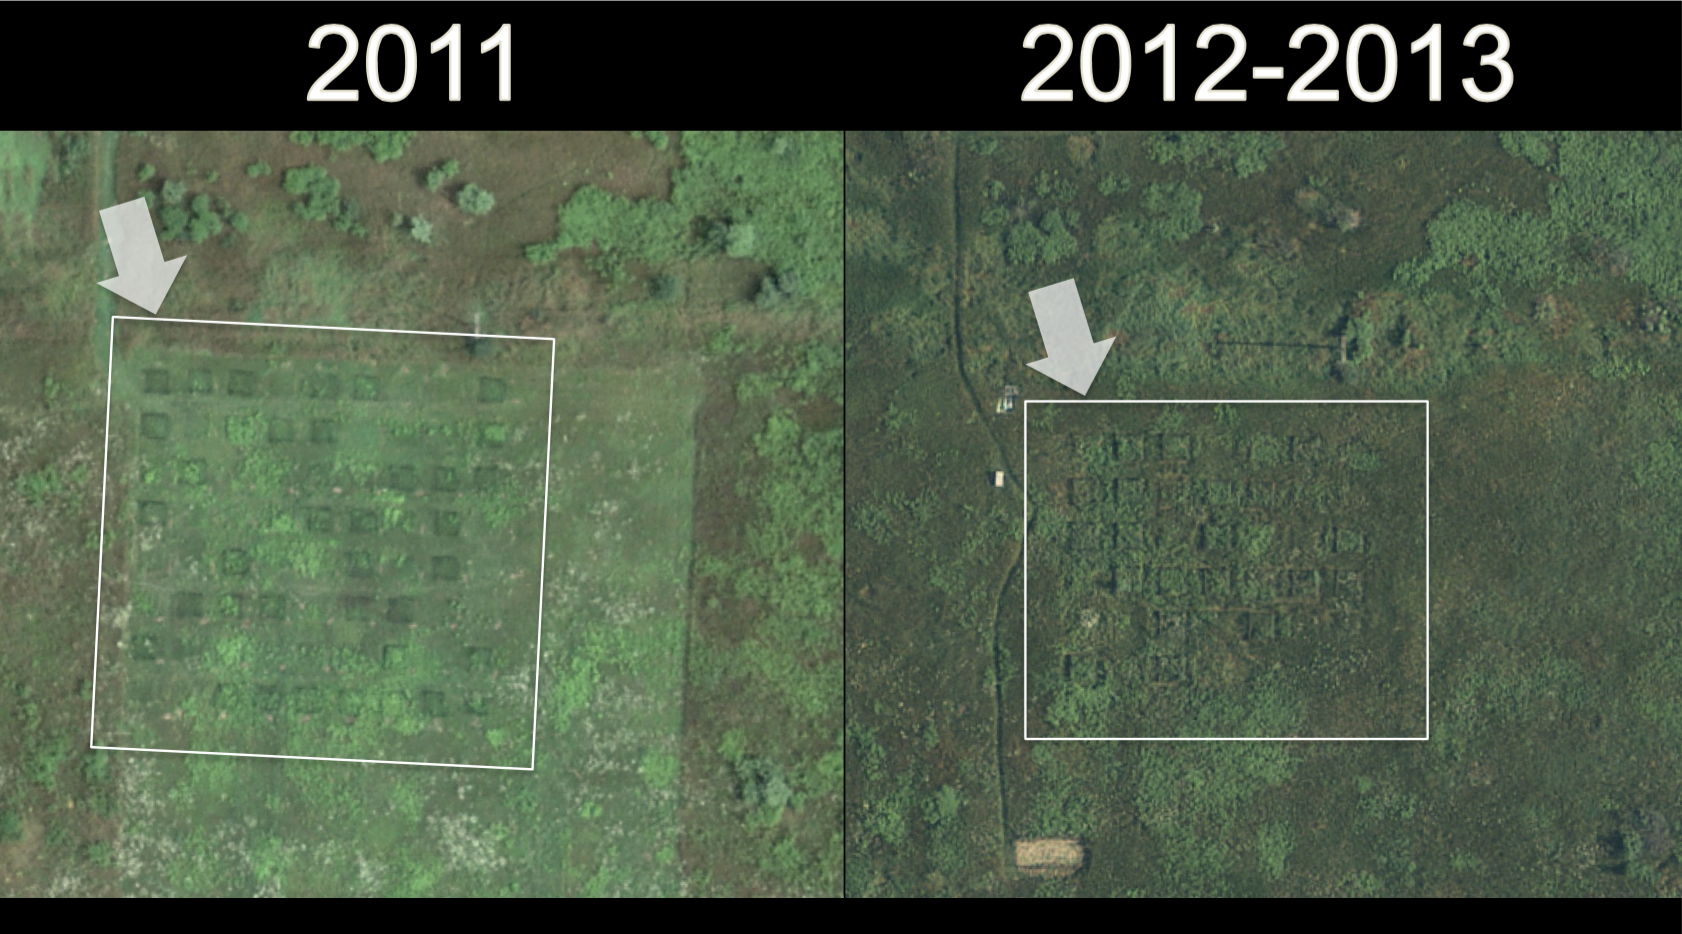
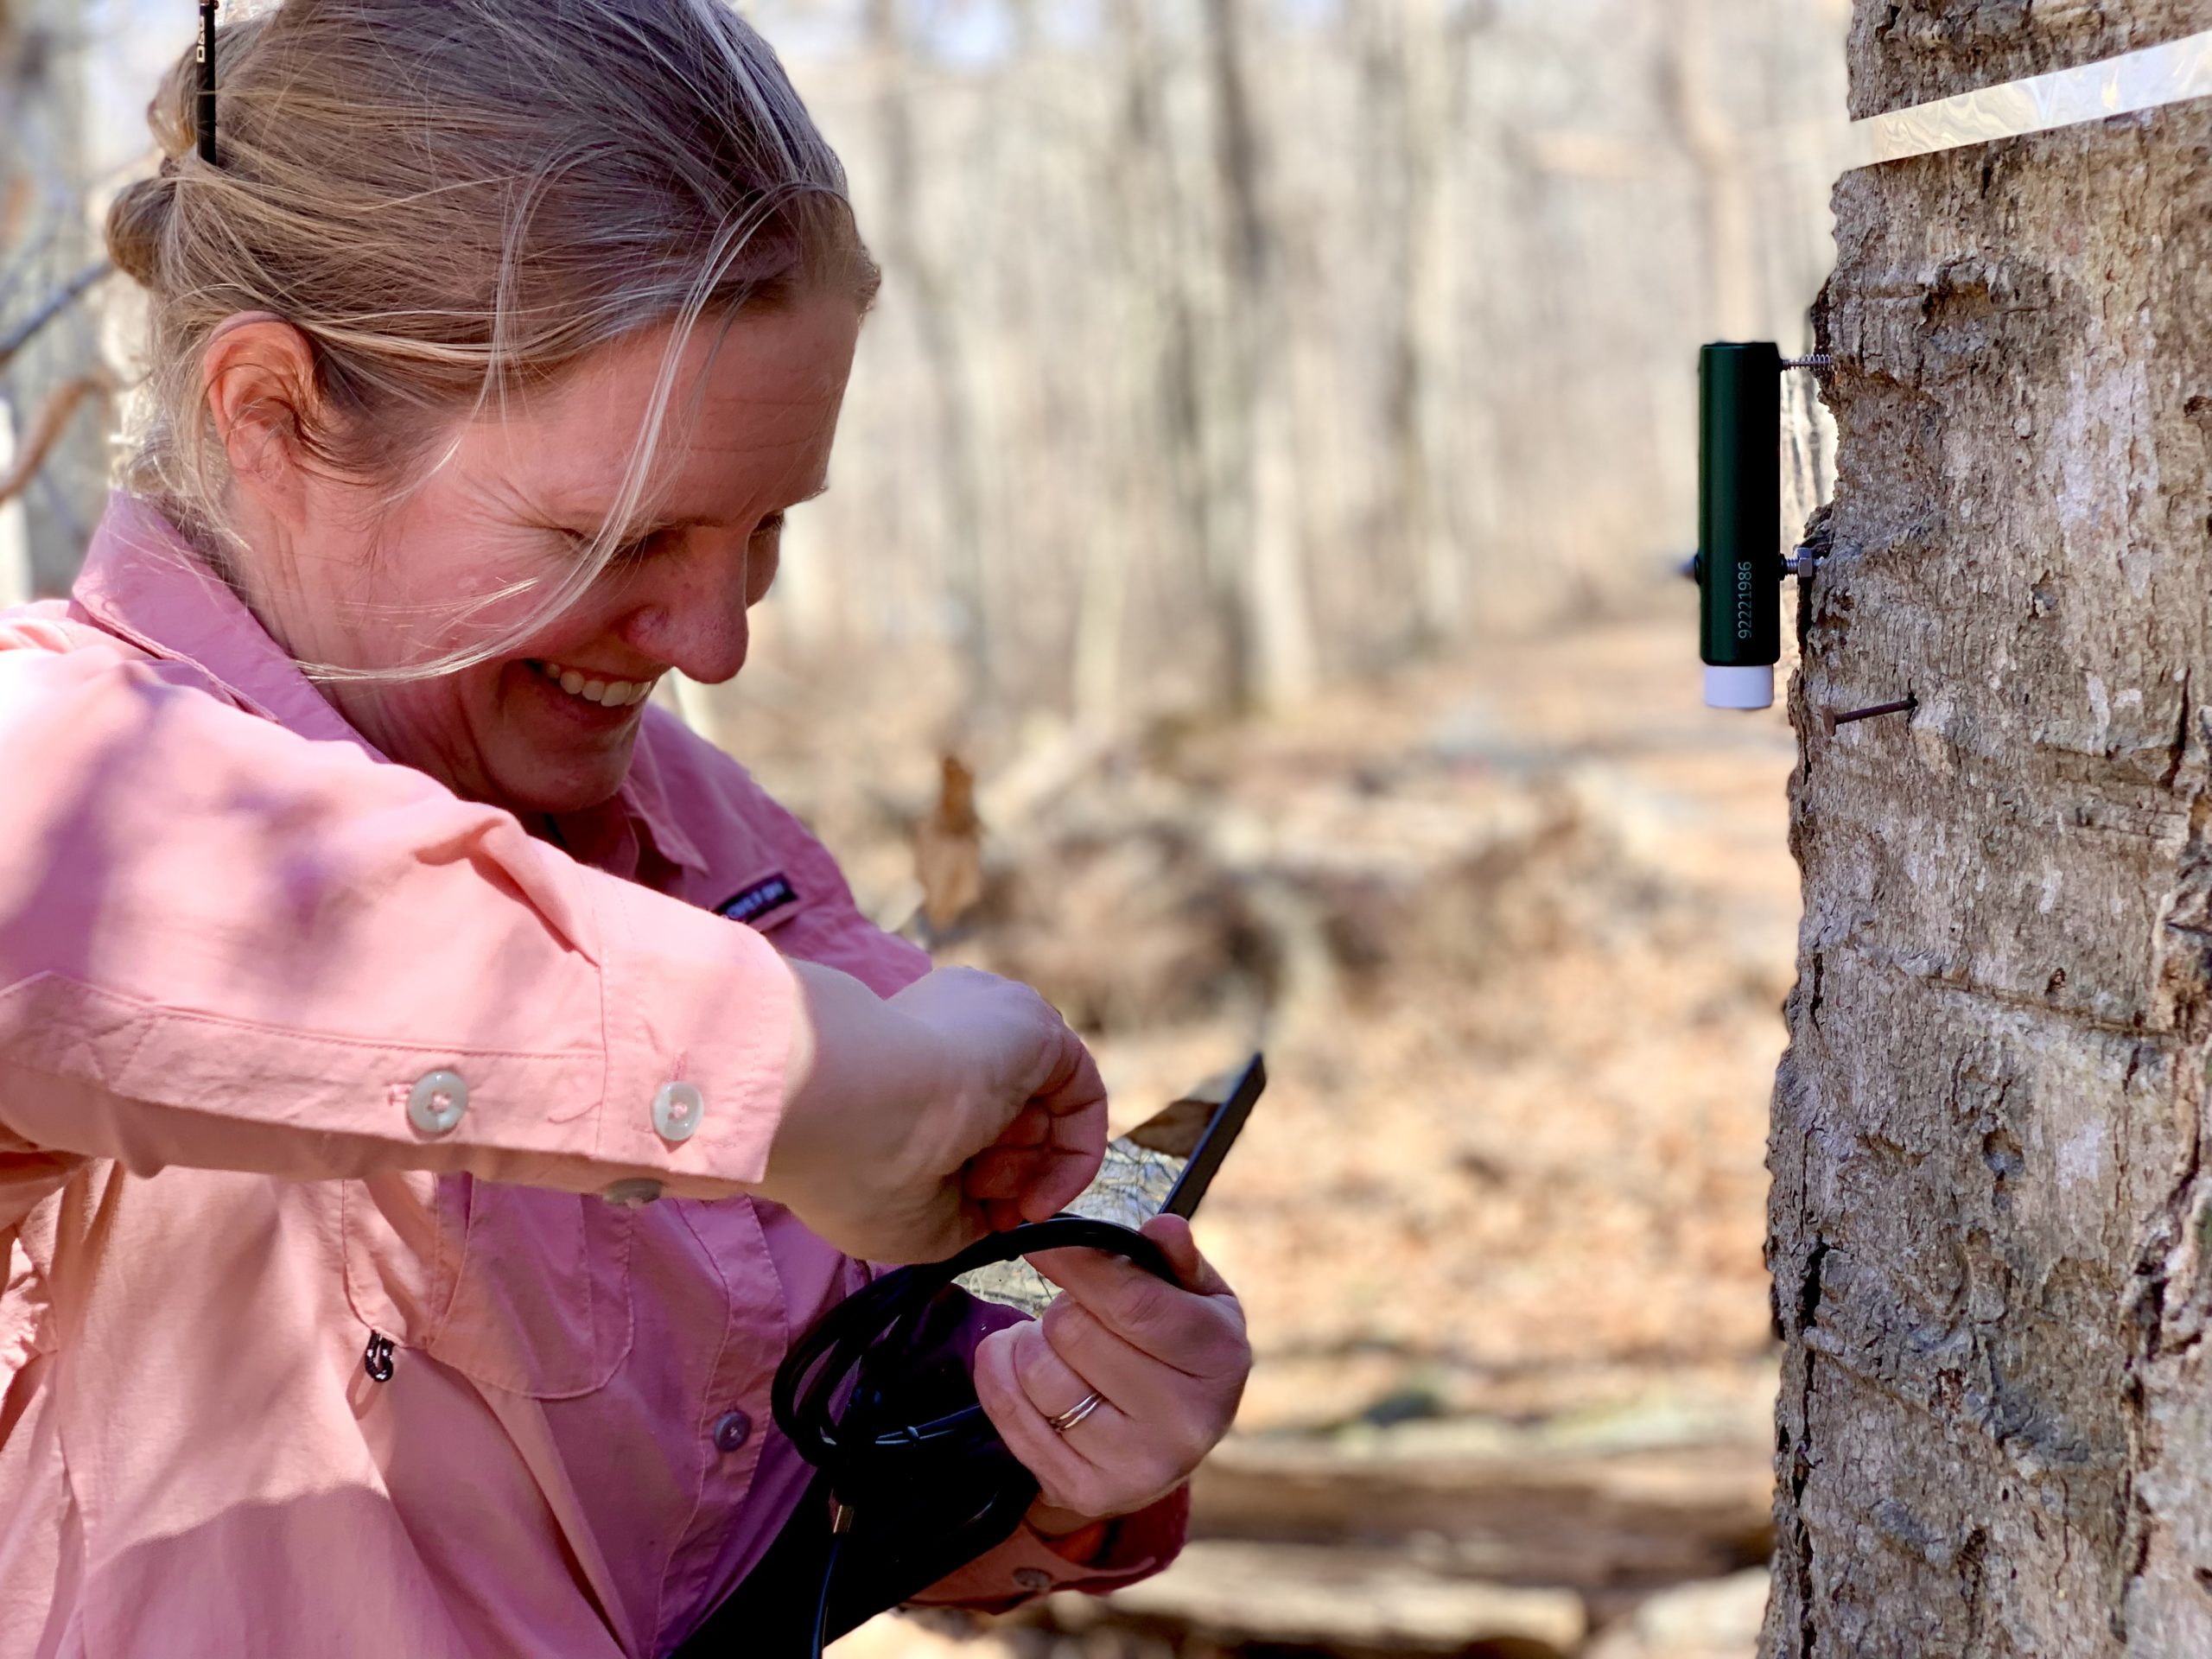
Kristina runs a tree census in a forest at the Smithsonian Conservation Biology Center in Virginia. Since 2008, she and many other scientists have surveyed every tree in their 26-hectare plot. Every five years, they count up how many trees are alive, how much they’ve grown, and how many have died. Luca joined Kristina’s lab in 2022. He and Kristina worked together with many other scientists to collect and process data on tree growth and mortality in 2023.
They used this growth and mortality data for individual trees to calculate levels of carbon gained and lost by the whole forest. The amount of carbon used for growth across the whole forest was measured as the mass of carbon gained. They also calculated the weight of the trees that died, which was measured as the mass of carbon lost. Both of these measurements were calculated in megagrams (Mg, that’s one million grams) of carbon (C) per hectare (ha) of forest per year (yr), or (MgC/ha/yr). The difference between these
two values is the change in carbon. This value gives the balance between carbon gained and lost. A positive value means there is more carbon being taken in by the forest than lost, and a negative value means that more carbon is being lost back to the atmosphere.
Featured scientists: Kristina J. Anderson-Teixeira (she/her) & Luca Morreale (he/him) at Smithsonian’s National Zoo & Conservation Biology Institute. Written by Ryan Helcoski