When a species can’t stand the heat

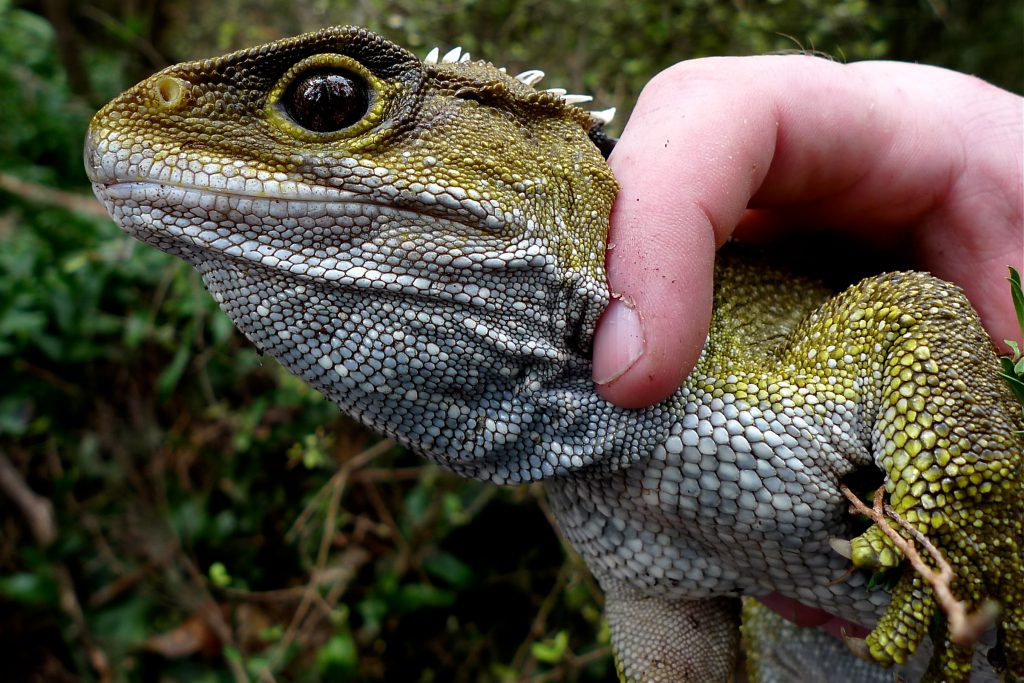
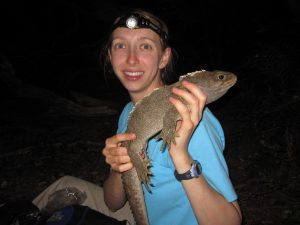
An adult male tuatara. Photo by Scott Jarvie.

An adult male tuatara. Photo by Scott Jarvie.

The activities are as follows:

Tuatara are a unique species of reptile found only in New Zealand. Tuatara look like lizards but they are actually in their own reptile group. Tuatara are the only species remaining on the planet from this lineage, one that dates to the time of the dinosaurs! Tuatara are similar to tortoises in that they are extremely long-lived and can sometimes live over 100 years. Tuatara start reproducing when they are about 15–20 years old and they breed infrequently.

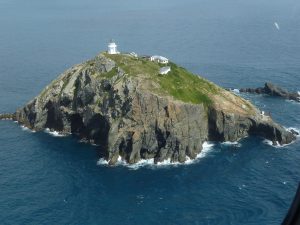
North Brother Island, one of the small New Zealand islands where tuatara are still found today.

North Brother Island, one of the small New Zealand islands where tuatara are still found today. Photo by Jo Monks.

The sex of tuatara is not determined by sex chromosomes (X or Y) as in humans. Instead, the temperature of the nest during egg development is the only factor that determines the sex of tuatara embryos. If the egg develops with a low temperature in the nest it will be female, but if it develops with a high temperature it will be male. This process happens in many other species, too, including some turtles, crocodiles, lizards, and fish. However, most species are the opposite of tuatara and produce females at the warmest temperatures.

Today, tuatara face many challenges. Humans introduced new predators to the large North and South Islands of New Zealand. Tuatara used to live on these main islands, but predators drove the island populations to extinction. Today, the tuatara survive only on smaller offshore islands where they can escape predation. Because many of these islands are small, tuatara can have low population numbers that are very vulnerable to a variety of risk factors. One of the current challenges faced by these populations is climate change. Similar to the rest of the world, New Zealand is experiencing higher and higher temperatures as a result of climate change, and the warm temperatures may impact tuatara reproduction.

Kristine collecting data on a tuatara in the field.

Kristine collecting data on a tuatara in the field. Photo by Sue Keall.

North Brother Island has a small population of tuatara (350–500 individuals) that has been studied for decades. Every single tuatara has been marked with a microchip (like the ones used on pet dogs and cats), which allows scientists to identify and measure the same individuals repeatedly across several years. In the 1990s, a group of scientists studying the tuatara on this island noticed that there were more males than females (60% males). The scientists started collecting data on the number of males and females so they could track whether the sex ratio, or the ratio of males and females in the population, became more balanced or became even more male-biased over time. The sex ratio is important because when there are fewer females in a population, there are fewer individuals that lay eggs and produce future offspring. Generally, a population that is highly male-biased will have lower reproduction rates than a population that is more balanced or is female-biased.

The fact that tuatara are long-lived and breed infrequently meant that the scientists needed to follow the sex ratio for many years to be sure they were capturing a true shift in the sexes over time, not just a short-term variation. In 2012, Kristine and her colleagues decided to use these long-term data to see if the increasing temperatures from climate change were associated with the changing sex ratio. They predicted that there would be a greater proportion of males in the population over time. This would be reflected in an unbalanced sex ratio that is moving further and further away from 50% males and 50% females and toward a male-biased population.

Featured scientists: Kristine Grayson from University of Richmond, Nicola Mitchell from University of Western Australia, and Nicola Nelson from Victoria University of Wellington

Flesch–Kincaid Reading Grade Level = 11.9

Additional teacher resources related to this Data Nugget:


kgAbout Kristine: Kristine L. Grayson is an Associate Professor in the Biology Department at University of Richmond, where she teaches Intro Ecology/Evolution, Field Ecology, Ecophysiology, and Data Visualization. She is an HHMI BioInteractive Ambassador and facilitator with the Quantitative Undergraduate Biology Education and Synthesis (QUBES) project, where you can find additional teaching resources she has authored. Kristine runs an undergraduate research lab studying invasive insects, salamanders, and aquatic macroinvertebrates. Her work on tuatara was conducted during a postdoc at Victoria University of Wellington funded by an NSF International Research Fellowship. One of her claims to fame is capturing the state record holding snapping turtle for North Carolina – 52 pounds! To read more about Kristine and her interest in science from a young age, check out this article.
SaveSave

SaveSave

SaveSave

SaveSave

SaveSave

SaveSave

SaveSave

SaveSave

SaveSave

The Arctic is Melting – So What?

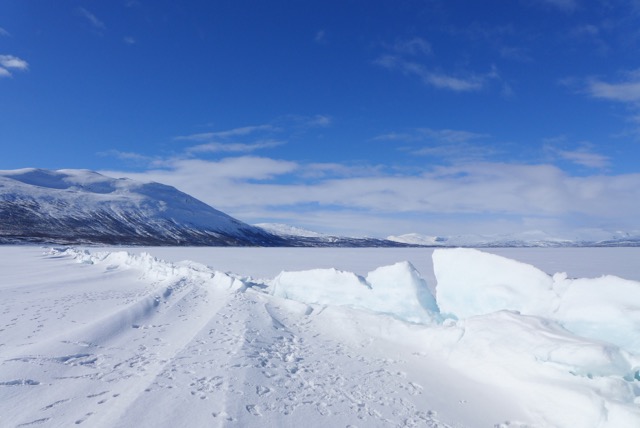
A view of sea ice in the Artic Ocean.

A view of sea ice in the Artic Ocean.

The activities are as follows:

Think of the North Pole as one big ice cube – a vast sheet of ice, only a few meters thick, floating over the Arctic Ocean. Historically, the amount of Arctic sea ice would be at a maximum in March. The cold temperatures over the long winter cause the ocean water to freeze and ice to accumulate. By September, the warm summer temperatures cause about 60% of the sea ice to melt every year. With global warming, more sea ice is melting than ever before. If more ice melts in the summer than is formed in the winter, the Arctic Ocean will become ice-free, and would change the Earth as we know it.

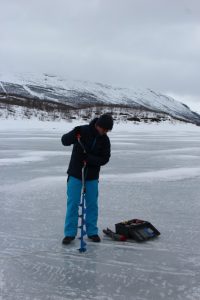
Student drills through lake ice

Student drills through lake ice

This loss of sea ice can have huge impacts on Arctic species and can also affect climate around the globe. For example, polar bears stand on the sea ice when they hunt. Without this platform they can’t catch their prey, leading to increased starvation. Beyond the Arctic, loss of sea ice can increase global climate change through the albedo effect (or the amount of incoming solar radiation that is reflected by a surface). Because ice is so white, it has high albedo and reflects a lot of the sunlight that hits it and keeps the earth cooler. Ice’s high albedo is why it seems so bright when the sun reflects off snow. When the ice melts and is replaced by water, which has a much lower albedo, more sunlight is absorbed by the earth’s surface and temperatures go up.

Scientists wanted to know whether the loss of sea ice and decreased albedo could affect extreme weather in the northern hemisphere. Extreme weather events are short-term atmospheric conditions that have been historically uncommon, like a very cold winter or a summer with a lot of rain. Extreme weather has important impacts on humans and nature. For example, for humans, extreme cold requires greater energy use to heat our homes and clear our roads, often increasing the use of fossil fuels. For wildlife, extreme cold could require changes in behavior, like finding more food, building better shelter, or a moving to a warmer location.

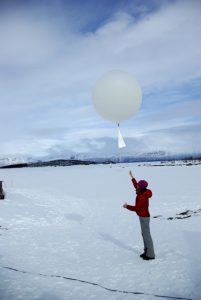
Student releases weather balloon

Student releases weather balloon

To make predictions about how the climate might change in the coming decades to centuries, scientists use climate models. Models are representations, often simplifications, of a structure or system used to make predictions. Climate models are incredibly complex. For example, climate models must describe, through mathematical equations, how water that evaporates in one region is transferred through the atmosphere to another region, potentially hundreds of miles away, and falls to the ground as precipitation.

James is a climate scientist who, along with his colleagues, wondered how the loss of arctic sea ice would affect climates around the globe. He used two well-established climate models – (1) the UK’s Hadley Centre model and (2) the US’s National Center for Atmospheric Research model. These models have been used previously by the Intergovernmental Panel on Climate Change (IPCC) to predict how much sea ice to expect in 2100.

Featured scientists: James Screen from University of Exeter, Clara Deser from National Center for Atmospheric Research, and Lantao Sun from University of Colorado at Boulder. Written by Erin Conlisk from Science Journal for Kids.

Flesch–Kincaid Reading Grade Level = 10.2

Earth Science Journal for KidsThis Data Nugget was adapted from a primary literature activity developed by Science Journal For KidsFor a more detailed version of this lesson plan, including a supplemental reading, videos, and extension activities, visit their website and register for free!

There is one scientific paper associated with the data in this Data Nugget. The citation and PDF of the paper is below.

You can play this video, showing changes in Arctic sea ice from 1987-2014, overhead at the start of class (no sound required). Each student should write down a couple of observations and questions.

The birds of Hubbard Brook, Part II

In Part I, you examined patterns of total bird abundance at Hubbard Brook Experimental Forest. These data showed bird numbers at Hubbard Brook have declined since 1969. Is this true for every species of bird? You will now examine data for four species of birds to see if each of these species follows the same trend.

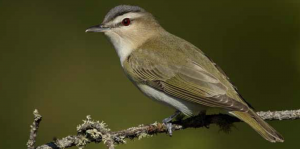
Red-eyed vireo in the Hubbard Brook Experimental Forest

Red-eyed vireo in the Hubbard Brook Experimental Forest

The activities are as follows:

It is very hard to study migratory birds because they are at Hubbard Brook only during their breeding season (summer in the Northern Hemisphere). They spend the rest of their time in the southeastern United States, the Caribbean or South America or migrating between their two homes. Therefore, it can be difficult to tease out the many variables affecting bird populations over their entire range. To start, scientists decided to focus on what they could study—the habitat types at Hubbard Brook and how they might affect bird populations.

Hubbard Brook Forest was heavily logged and disturbed in the early 1900s. Trees were cut down to make wood products, like paper and housing materials. Logging ended in 1915, and various plants began to grow back. The area went through what is called secondary succession, which refers to the naturally occurring changes in forest structure that happen as a forest recovers after it was cut down or otherwise disturbed. Today, the forest has grown back. Scientists know that as the forest grew older, its structure changed: Trees grew taller, the types of trees changed, and there was less shrubby understory. The forest now contains a mixture of deciduous trees that lose their leaves in the winter (about 80–90%; mostly beech, maples, and birches) and evergreen trees, mostly conifers, that stay green all year (about 10–20%; mostly hemlock, spruce, and fir).

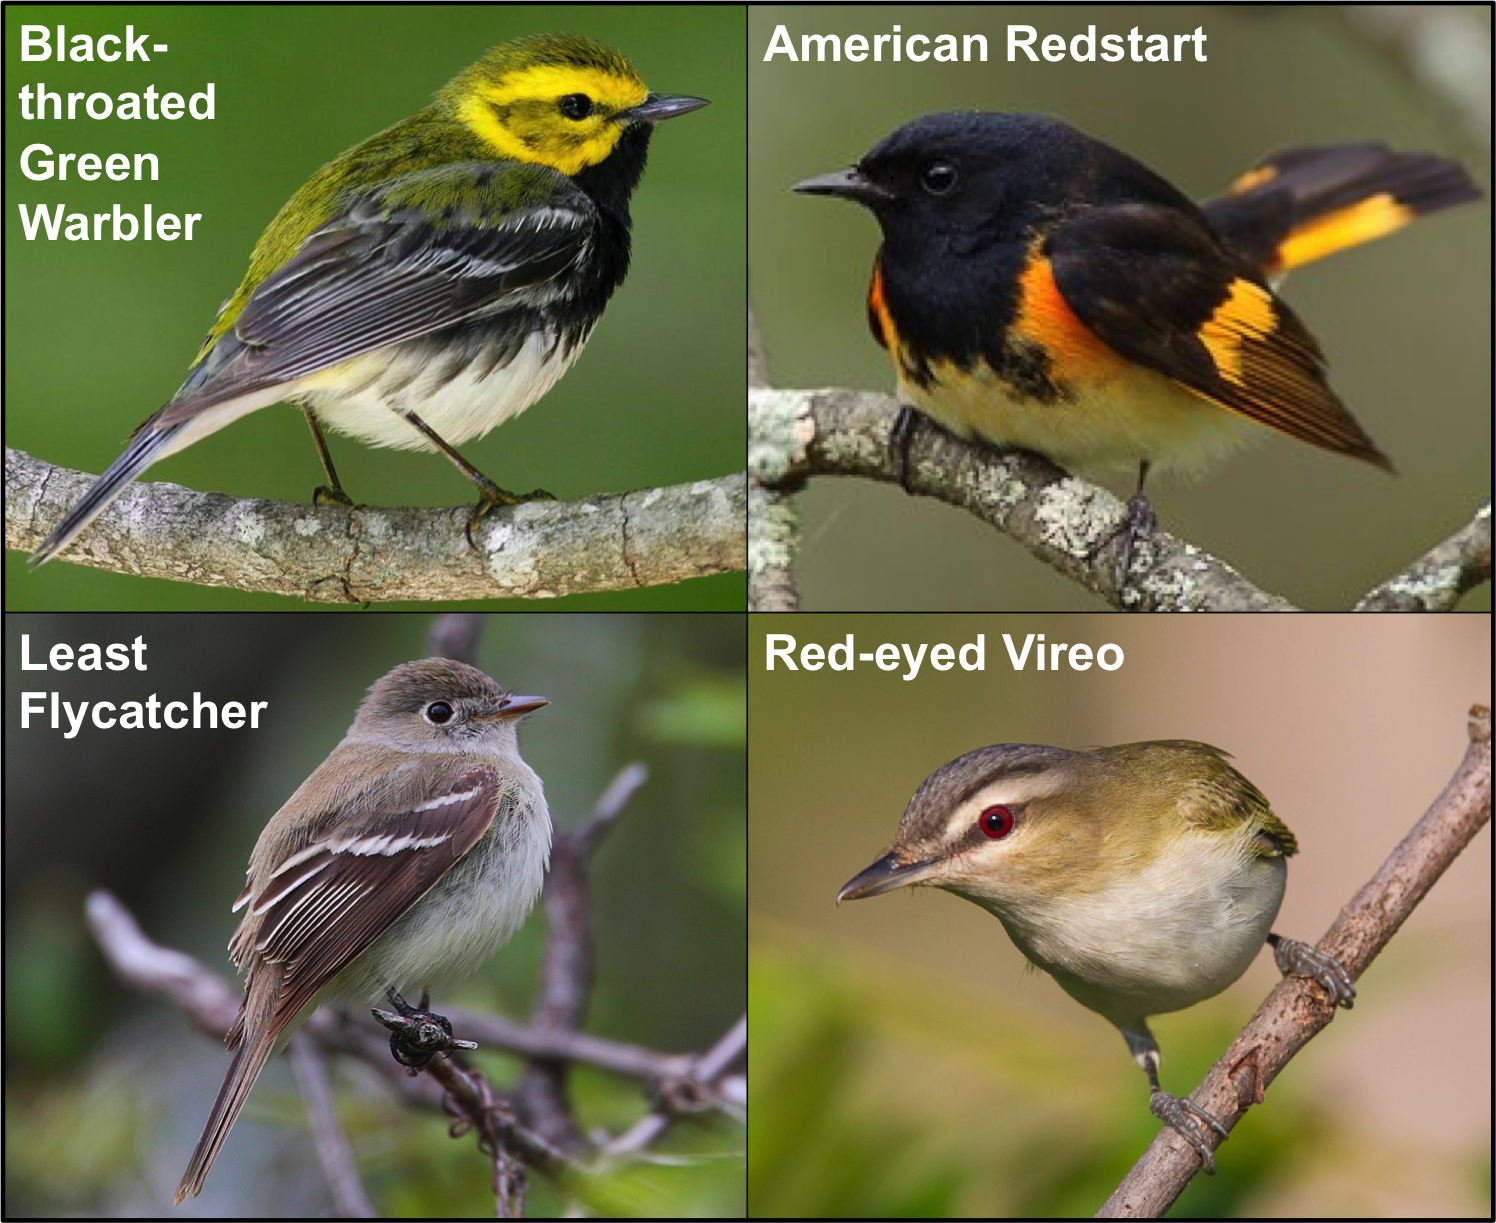
Richard and his fellow scientists already knew a lot about the birds that live in the forest. For example, some bird species prefer habitats found in younger forests, while others prefer habitats found in older forests. They decided to look carefully into the habitat preferences of four important species of birds—Least Flycatcher, Red-eyed Vireo, Black-throated Green Warbler, and American Redstart—and compare them to habitats available at each stage of succession. They wondered if habitat preference of a bird species is associated with any change in the bird populations at Hubbard Brook since the beginning of succession.

  • Least Flycatcher: The Least Flycatcher prefers to live in semi-open, mid-successional forests. The term mid-successional refers to forests that are still growing back after a disturbance. These forests usually consist of trees that are all about the same age and have a thick canopy at the top with few gaps, a relatively open area under the canopy, and a denser shrub layer close to the ground.
  • Black-throated Green Warbler: The Black-throated Green Warbler occupies a wide variety of habitats. It seems to prefer areas where deciduous and coniferous forests meet and can be found in both forest types. It avoids disturbed areas and forests that are just beginning succession. This species prefers both mid-successional and mature forests.
  • Red-eyed Vireo: The Red-eyed Vireo breeds in deciduous forests as well as forests that are mixed with deciduous and coniferous trees. They are abundant deep in the center of a forest. They avoid areas where trees have been cut or blown down and do not live near the edge. After an area is logged, it often takes a very long time for this species to return.
  • American Redstart: The American Redstart generally prefers moist, deciduous, forests with many shrubs. Like the Least Flycatcher, this species prefers mid-successional forests.

birds

Featured scientist: Richard Holmes from the Hubbard Brook Experimental Forest. Data Nugget written by: Sarah Turtle and Jackie Wilson.

Flesch–Kincaid Reading Grade Level = 10.6

A view of the Hubbard Brook Experimental Forest

A view of the Hubbard Brook Experimental Forest

Additional teacher resource related to this Data Nugget:

There are multiple publications related to the data included in this activity:

  • Holmes, R. T. 2011. Birds in northern hardwoods ecosystems: Long-term research on population and community processes in the Hubbard Brook Experimental Forest. Forest Ecology and Management doi:10.1016/j.foreco.2010.06.021.
  • Holmes, R.T., 2007. Understanding population change in migratory songbirds: long-term and experimental studies of Neotropical migrants in breeding and wintering areas. Ibis 149 (Suppl. 2), 2-13.
  • Townsend, A. K., et al. (2016). The interacting effects of food, spring temperature, and global climate cycles on population dynamics of a migratory songbird. Global Change Biology 2: 544-555.

SaveSave

SaveSave

SaveSave

SaveSave

SaveSave

SaveSave

The birds of Hubbard Brook, Part I

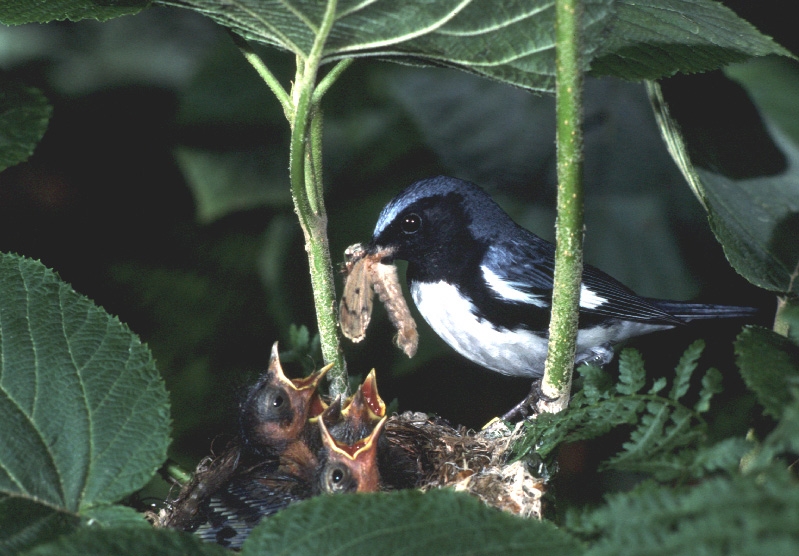
Male Black-throated Blue Warbler feeding nestlings. Nests of this species are built typically less than one meter above ground in a shrub such as hobblebush. Photo by N. Rodenhouse.

Male Black-throated Blue Warbler feeding nestlings. Nests of this species are built typically less than one meter above ground in a shrub such as hobblebush. Photo by N. Rodenhouse.

The activities are as follows:

The Hubbard Brook Experimental Forest is an area where scientists have collected ecological data for many years. It is located in the White Mountains of New Hampshire. Data collected in this forest helps uncover environmental trends over long periods of time, such as changes in air temperature, precipitation, forest growth, and animal populations. It is important to collect data on ecosystems over time because these patterns could be missed with shorter observation periods or short-term experiments.

Richard Holmes is an avian ecologist who began this study because he was interested in how bird populations were responding to long-term environmental change.

Richard Holmes is an avian ecologist who began this study because he was interested in how bird populations were responding to long-term environmental change.

Each spring, Hubbard Brook comes alive with the arrival of migratory birds. Many come from the tropics to take advantage of abundant insects and the long summer days of northern areas. In the spring, avian ecologists, or scientists who study the ecology of birds, also become active in the forest at Hubbard Brook. They have been keeping records on the birds that live in the experimental forest for over 50 years. These data are important because they represent one of the longest bird studies ever conducted!

Richard is an avian ecologist who began this study early in his career as a scientist. He was interested in how bird populations respond to long-term environmental changes at Hubbard Brook. Every summer since 1969, Richard takes his team of trained scientists, students, and technicians into the field to identify which species are present. Richard’s team monitors populations of over 30 different bird species. They count the number of birds that are in the forest each year and study their activities during the breeding season. The researchers wake up every morning before the sun rises and travel to the far reaches of the forest. They listen for, look for, identify, and count all the birds they find. The team has been trained to be able to identify the birds by sight, but also by their calls. Team members are even able to identify how far away a bird is by hearing its call!

The study area is located away from any roads or other disturbed areas. To measure the abundance, or number of birds found in the 10 hectare study area, the researchers used what is called the spot-mapping method. They use plastic flags on trees 50 meters apart throughout the study area to create a 50×50 meter grid. The grid allows them to map where birds are found in this area, and when possible, where they locate their nests. Using the grid the researchers systematically walk through the plot several days each week from early May until July, recording the presence and activities of every bird they find. They also note the locations of nearby birds singing at the same time. These records are combined on a map to figure out a bird’s territory, or activity center. At the end of the breeding season they count up the number of territories to get an estimate of the number of birds on the study area. This information, when paired with observations on the presence and activities of mates, locations of nests, and other evidence of breeding activity provide an accurate estimate for bird abundance. Finally, some species under close study, like American Redstart and Black-throated Blue Warbler, were captured and given unique combinations of colored bands, which makes it easier to track individuals.

By looking at bird abundance data across many years, Richard and his colleagues can identify trends that reveal how avian populations change over time.

Featured scientist: Richard Holmes from the Hubbard Brook Experimental Forest. Data Nugget written by: Sarah Turtle and Jackie Wilson.

Flesch–Kincaid Reading Grade Level = 11.3

A view of the Hubbard Brook Experimental Forest

A view of the Hubbard Brook Experimental Forest

Additional teacher resource related to this Data Nugget:

There are multiple publications related to the data included in this activity:

  • Holmes, R. T. 2011. Birds in northern hardwoods ecosystems: Long-term research on population and community processes in the Hubbard Brook Experimental Forest. Forest Ecology and Management doi:10.1016/j.foreco.2010.06.021.
  • Holmes, R.T., 2007. Understanding population change in migratory songbirds: long-term and experimental studies of Neotropical migrants in breeding and wintering areas. Ibis 149 (Suppl. 2), 2-13.
  • Townsend, A. K., et al. (2016). The interacting effects of food, spring temperature, and global climate cycles on population dynamics of a migratory songbird. Global Change Biology 2: 544-555.

SaveSave

SaveSave

SaveSave

SaveSave

SaveSave

SaveSave

Does sea level rise harm Saltmarsh Sparrows?

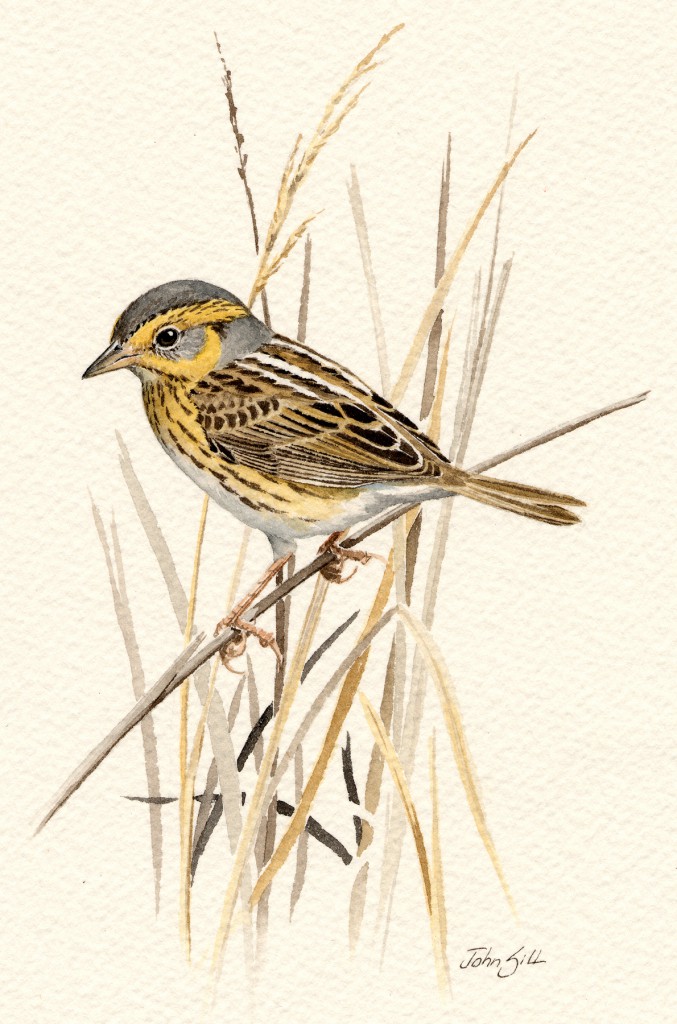
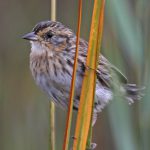
Painting of the saltmarsh sparrow

Painting of the saltmarsh sparrow

The activities are as follows:

For the last 100 years, sea levels around the globe have increased dramatically. The cause of sea level rise has been investigated and debated. Data from around the world supports the hypothesis that increasing sea levels are a result of climate change caused by the burning of fossil fuels. As we warm the Earth, the oceans get warmer and polar ice caps melt. The dramatic increase in sea level that results could seriously threaten ecosystems and the land that humans have developed along the coast.

Salt marshes are plains of grass that grow along the east coast of the United States and many coasts worldwide. Salt marshes grow right at sea level and are therefore very sensitive to sea level rise. In Boston Harbor, Massachusetts, the NOAA (National Oceanic and Atmospheric Administration) Tide Gauge has measured a 21mm rise in sea level over the last 8 years. That means every year sea level has gone up an average of 2.6mm since 2008 – more than two and a half times faster than before we started burning fossil fuels! Because sea level is going up at such a fast rate, Robert, a scientist in Boston, became concerned for the local salt marsh habitats near his home. Robert was curious about what will happen to species that depend on Boston’s Plum Island Sound salt marshes when sea levels continue to rise.

Robert preparing his team for a morning of salt marsh bird surveys.

Robert preparing his team for a morning of salt marsh bird surveys.

Robert decided to look at species that are very sensitive to changes in the salt marsh. When these sensitive species are present, they indicate the marsh is healthy. When these species are no longer found in the salt marsh, there might be something wrong. The Saltmarsh Sparrow is one of the few bird species that builds its nests in the salt marsh, and is totally dependent on this habitat. Saltmarsh Sparrows rely completely on salt marshes for feeding and nesting, and therefore their numbers are expected to decline as sea levels rise and they lose nesting sites. Robert heard that scientists studying Connecticut marshes reported the nests of these sparrows have been flooded in recent years. He wanted to know if the sparrows in Massachusetts were also losing their nests because of high sea levels.

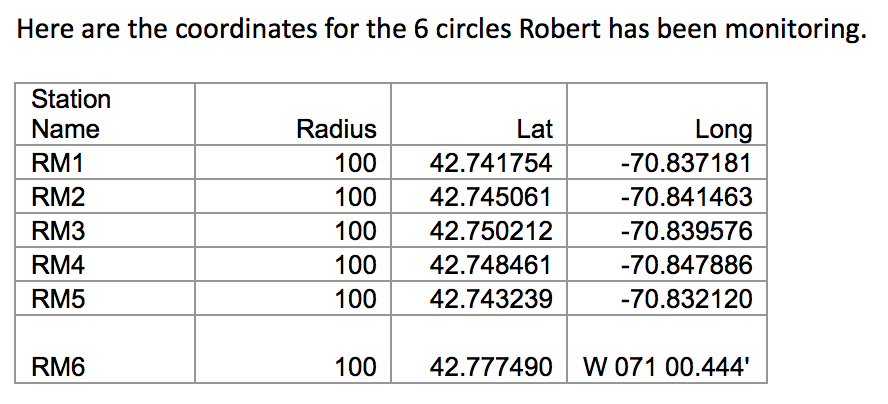
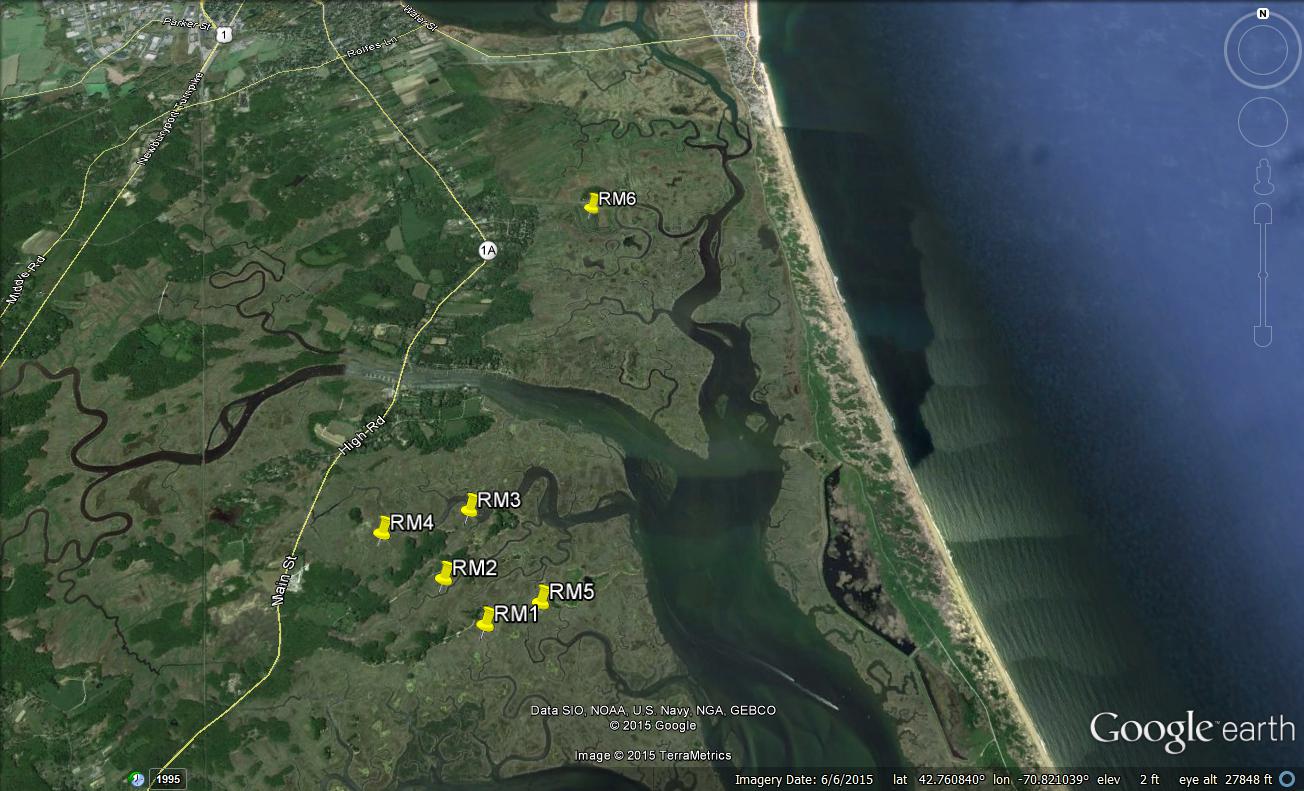
For the past two decades Robert has kept track of salt marsh breeding birds at Plum Island Sound. In his surveys since 2006, Robert counted the number of Saltmarsh Sparrows in a given area. He did these surveys in June when birds are most likely to be breeding. He used the “point count” method – standing at a center point he measured out a 100 meter circle around him. Then, for 10 minutes, he counted how many and what kinds of birds he saw or heard within and just outside the circle. Each year he set up six count circles and performed counts three times in June each year at each circle. Robert also used sea level data from Boston Harbor that he can relate to the data from his bird surveys. He predicted that sea levels would be rising in Plum Island Sound and Saltmarsh Sparrow populations would be falling over time.

Featured scientist: Robert Buchsbaum from Mass Audubon. Written by: Wendy Castagna, Daniel Gesin, Mike McCarthy, and Laura Johnson

Flesch–Kincaid Reading Grade Level = 9.5

Saltmarsh-Sparrow-104-crAdditional teacher resources related to this Data Nugget include:

coordinates

station locations

What do trees know about rain?

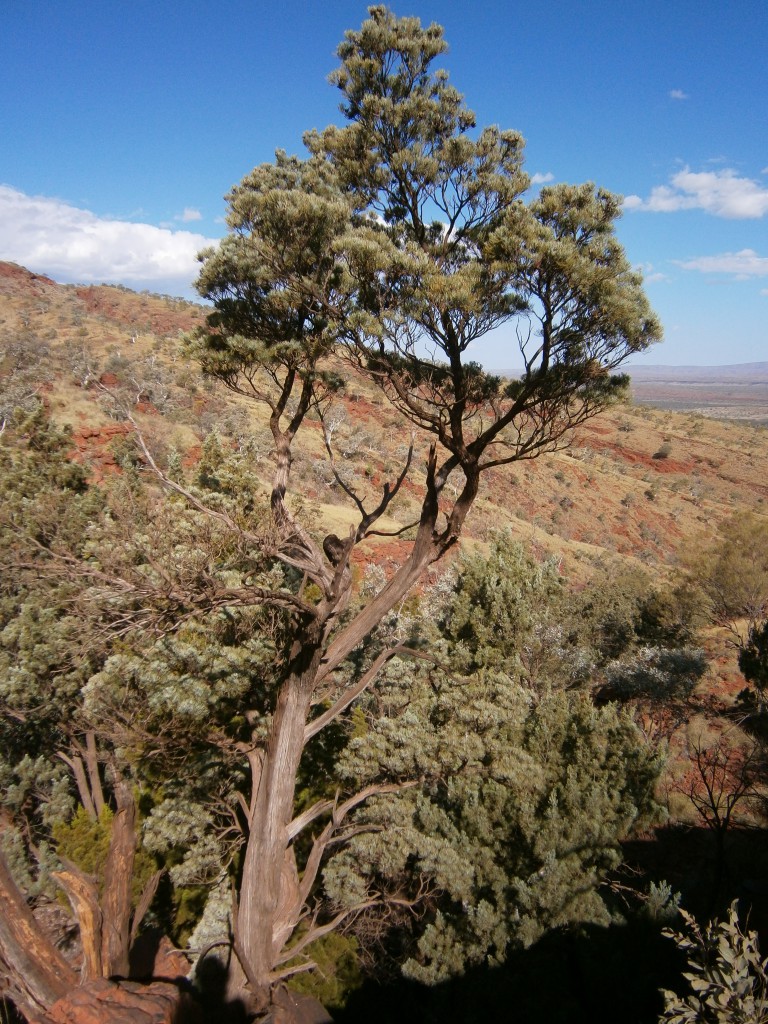
A cypress pine, or Callitris columellaris. This species is able to survive in Australia’s dry climates.

A cypress pine, or Callitris columellaris. This species is able to survive in Australia’s dry climates.

The activities are as follows:

Did you know that Australia is the driest inhabited continent in the world? Because it is so dry, we need to be able to predict how often and how much rain will fall. Predictions about future droughts help farmers care for their crops, cities plan their water use, and scientists better understand how ecosystems will change. The typical climate of arid northwest Australia consists of long drought periods with a few very wet years sprinkled in. Scientists predict that climate change will cause these cycles to become more extreme – droughts will become longer and periods of rain will become wetter. When variability is the norm, how can scientists tell if the climate is changing and droughts and rain events today are more intense than what we’ve seen in the past?

To make rainfall predictions for the future, scientists need data on past rainfall. However, humans have only recorded rainfall in Australia for the past 100 years. Because climate changes slowly and goes through long-term cycles, scientists need very long term datasets of rainfall.

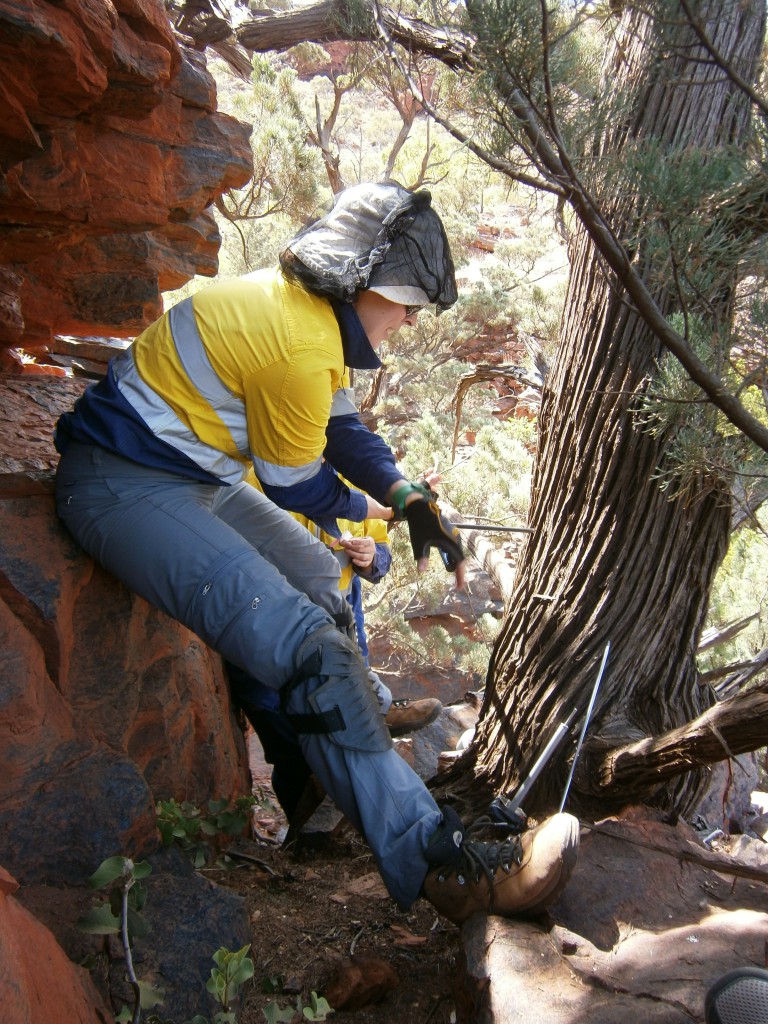
Scientist Alison coring a cypress pine

Scientist Alison coring a cypress pine

The answer to this challenge comes from trees! Using dendrochronology, the study of tree rings, scientists get a window back in time. Many tree species add a ring to their trunks every year. The width of this ring varies from year to year depending on how much water is available. If it rains a lot in a year, the tree grows relatively fast and ends up with a wide tree ring. If there isn’t much rain in a year, the tree doesn’t grow much and the ring is narrow. We can compare the width of rings from recent years to the known rain data humans have collected. Then, assuming the same forces that determine tree ring width are operating today as in the past, we can go back and interpret how much rain fell in years where we have no recorded rainfall data. This indirect information from tree rings is known as a proxy, and helps us infer data about past climates.

For this study, the scientists used cypress-pine, or Callitris columellaris. This species is able to survive in Australia’s dry climates and is long lived enough to provide data far back in time. Fortunately, scientists don’t have to cut down the trees to see their rings. Instead, they use a corer – a hollow metal drill with the diameter of a straw. They drill it through the tree all the way to its core, and extract a sample of the tissue that shows all the tree rings. The scientists took 40 cores from 27 different cypress-pine trees. The oldest trees in the sample were more than 200 years old. Next, they developed a chronology where they lined up ring widths from one tree with all the other trees, wide with wide and narrow with narrow. This chronology gives them many replicate samples, and data going back all the way to the 19th century! Next, they used a dataset of rainfall from rain gauges that have been set out in Australia since 1910. They then take this precipitation data and overlay it with the tree ring widths since 1910. For tree rings before 1910, they then project back in time using a rainfall formula.

These videos, demonstrating the science of dendrochronology, could be a great way to spark class discussions:

Featured scientist: Alison O’Donnell from University of Western Australia

Flesch–Kincaid Reading Grade Level = 8.0

Earth Science Journal for KidsThis Data Nugget was adapted from a primary literature activity developed by Science Journal For Kids. For a more detailed version of this lesson plan, including a supplemental reading, videos, and extension activities, visit their website and register for free!

There is one scientific paper associated with the data in this Data Nugget. The citation and PDF of the paper is below.

Growth rings from a Callitirs tree.

Growth rings from a Callitirs tree.

Lizards, iguanas, and snakes! Oh my!

The Common Side-blotched Lizard

The Common Side-blotched Lizard

The activities are as follows:

Throughout history people have settled mainly along rivers and streams. Easy access to water provides resources to support many people living in one area. In the United States today, people have settled along 70% of rivers.

Today, rivers are very different from what they were like before people settled near them. The land surrounding these rivers, called riparian habitats, has been transformed into land for farming, businesses, or housing for people. This urbanization has caused the loss of green spaces that provide valuable services, such as water filtration, species diversity, and a connection to nature for people living in cities. Today, people are trying to restore green spaces along the river to bring back these services. Restoration of disturbed riparian habitats will hopefully bring back native species and all the other benefits these habitats provide.

Scientist Mélanie searching for reptiles in the Central Arizona-Phoenix LTER.

Scientist Mélanie searching for reptiles in the Central Arizona-Phoenix LTER.

Scientists Heather and Mélanie are researchers with the Central Arizona-Phoenix Long-Term Ecological Research (CAP LTER) project. They want to know how restoration will affect animals living near rivers. They are particularly interested in reptiles, such as lizards. Reptiles play important roles in riparian habitats. Reptiles help energy flow and nutrient cycling. This means that if reptiles live in restored riparian habitats, they could increase the long-term health of those habitats. Reptiles can also offer clues about the condition of an ecosystem. Areas where reptiles are found are usually in better condition than areas where reptiles do not live.

Heather and Mélanie wanted to look at how disturbances in riparian habitats affected reptiles. They wanted to know if reptile abundance (number of individuals) and diversity (number of species) would be different in areas that were more developed. Some reptile species may be sensitive to urbanization, but if these habitats are restored their diversity and abundance might increase or return to pre-urbanization levels. The scientists collected data along the Salt River in Arizona. They had three sites: 1) a non-urban site, 2) an urban disturbed site, and 3) an urban rehabilitated site. They counted reptiles that they saw during a survey. At each site, they searched 21 plots that were 10 meters wide and 20 meters long. The sites were located along 7 transects, or paths measured out to collect data. Transects were laid out along the riparian habitat of the stream and there were 3 plots per transect. Each plot was surveyed 5 times. They searched for animals on the ground, under rocks, and in trees and shrubs.

Featured scientists: Heather Bateman and Mélanie Banville from Arizona State University. Written by Monica Elser from Arizona State University.

Flesch–Kincaid Reading Grade Level = 9.8

Check out this video of Heather and her lab out in the field collecting lizards:

Virtual field trip to the Salt River biodiversity project:

Additional resources related to this Data Nugget:

SaveSave

SaveSave

SaveSave

Invasion meltdown

The invasive plant, Centaurea stoebe

 A flower of the invasive plant, Centaurea stoebe (spotted knapweed).

The activities are as follows:

Humans are changing the earth in many ways. First, by burning fossil fuels and adding greenhouse gasses to the atmosphere we are causing climate change, or the warming of the planet. Scientists have documented rising temperatures across the globe and predict an increase of 3° C in Michigan within the next 100 years. Second, we are also changing the earth by movingspecies across the globe, introducing them into new habitats. Some of these introduced species spread quickly and become invasive. Invasive species harm native species and cost us money. There is also potential that these two changes could affect one another; warmer temperatures from climate change may make invasions by plants and animals even worse.

All living organisms have a range of temperatures they are able to survive in, and temperatures where they perform their best. For example, arctic penguins do best in the cold, while tropical parrots prefer warmer temperatures. The same is true for plants. Depending on the temperature preferences of a plant species, warming temperatures may either help or harm that species.

Katie, Mark, and Jen are scientists concerned that invasive species may do better in the warmer temperatures caused by climate change. There are several reasons they expect that invasive species may benefit from climate change. First, because invasive species have already survived transport from one habitat to another, they may be species that are better able to handle change, like temperature increases. Second, the new habitat of an invasive species may have temperatures that allow it to survive, but are too low for the invasive species to do their absolute best. This could happen if the invasive species was transported from somewhere warm to somewhere cold. Climate change could increase temperatures enough to put the new habitat in the species’range of preferred temperatures, making it ideal for the invasive species to grow and survive.

A view of the plants growing in a heated ring. Notice the purple flowers of Centaurea stoebe.

A view of the plants growing in a heated ring.
Notice the purple flowers of Centaurea stoebe.

To determine if climate change will benefit invasive species, Katie, Mark, and Jen focused on one of the worst invasive plants in Michigan, spotted knapweed. They looked at spotted knapweed plants growing in a field experiment with eight rings. Half of the rings were left with normal, ambient air temperatures. The other half of the rings were heated using ceramic heaters attached to the side of the rings. These heaters raised air temperatures by 3° C to mimic future climate change. At the end of the summer, Mark and Katie collected all of the spotted knapweed from the rings. They recorded both the (1) abundance, or number of spotted knapweed plants within a square meter, and (2) the biomass (dry weight of living material) of spotted knapweed. These two variables taken together are a good measure of performance, or how well spotted knapweed is doing in both treatments.

Featured scientists: Katie McKinley, Mark Hammond, and Jen Lau from Michigan State University

Flesch–Kincaid Reading Grade Level = 10.0

Green crabs: invaders in the Great Marsh

Scientist Alyssa holding a non-native green crab, introduced from Europe to the American Atlantic Coast. This crab causes many problems in its new range, including the loss of native eelgrass.

Scientist Alyssa holding a non-native green crab, introduced from Europe to the American Atlantic Coast. This crab causes many problems in its new range, including the loss of native eelgrass.

The activities are as follows:

Marshes, areas along the coast that flood with each tide, are incredibly important habitats. They act as homes to large number of species, protect the coast from erosion during storms, and act as a filter for nutrients and pollution. Many species are unique to these habitats and provide crucial support to the marsh. For example, native eelgrass, a type of plant, minimizes erosion by holding sediments in place with their roots.

In an effort to help protect and restore marshes, we must understand current-day issues that are affecting their health. The introduction of non-native species, species that are not originally from this ecosystem, into a marsh may disrupt the marsh ecosystem and threaten the survival of native species. One species that has recently caused a lot of trouble is the European green crab. This crab species was accidentally carried to the Atlantic coast back in the early 1800s from Europe. Since then, they have become extremely invasive and their numbers have exploded! Compared to native crabs, the green crab digs a lot when it searches for food and shelter. This digging uproots eelgrass and causes its population numbers to fall. In many spots where green crabs have been introduced, marshes are now bare and no more grass can grow.

Non-native green crabs caught in trap that has been underwater for 25 hours

Non-native green crabs caught in trap that has been underwater for 25 hours

The Great Marsh is one of the coastal habitats affected by invasive green crabs. Located on the North Shore of Massachusetts, the Great Marsh is known for being the longest continuous stretch of salt marsh in all of New England. Alyssa is a restoration ecologist who is very concerned with the conservation of the Great Marsh and other important coastal ecosystems. She and other scientists are trying to maintain native species while also reducing the effects of non-native species.

A major goal for Alyssa is to restore populations of a native eelgrass. Eelgrass does more than just prevent erosion. It also improves water quality, provides food and habitat for native animal species, and acts as an indicator of marsh health. If green crabs are responsible for the loss of eelgrass from the marsh, then restorations where eelgrass is planted back into the marsh should be more successful where green crab numbers are low. Alyssa has been measuring green crab populations in different areas by laying out green crab traps for 24 hours. Alyssa has set these traps around Essex Bay, an area within the Great Marsh. She recorded the total number of green crabs caught at each location (as well as their body size and sex).

Native eelgrass growing in Essex Bay, an area within the Great Marsh

Native eelgrass growing in Essex Bay, an area within the Great Marsh

Featured scientist: Alyssa Novak, Center for Coastal Studies/Boston University. Written by: Hanna Morgensen

Flesch–Kincaid Reading Grade Level = 8.8

Urbanization and estuary eutrophication

Charles Hopkinson out taking dissolved O2 measurements.

Charles Hopkinson out taking dissolved O2 measurements.

The activities are as follows:

An estuary is a habitat formed where a freshwater river or stream meets a saltwater ocean. Many estuaries can be found along the Atlantic coast of North America. Reeds and grasses are the dominant type of plant in estuaries because they are able to tolerate and grow in the salty water. Where these reeds and grasses grow they form a special habitat called a salt marsh. Salt marshes are important because they filter polluted water and buffer the land from storms. Salt marshes are the habitat for many different kinds of plants, fish, shellfish, and birds.

Hap Garritt removing an oxygen logger from Middle Road Bridge in winter.

Hap Garritt removing an oxygen logger from Middle Road Bridge in winter.

Scientists are worried because some salt marshes are in trouble! Runoff from rain washes nutrients, usually from lawn fertilizers and agriculture, from land and carries them to estuaries. When excess nutrients, such as nitrogen or phosphorus, enter an ecosystem the natural balance is disrupted. The ecosystem becomes more productive, called eutrophication. Eutrophication can cause major problems for estuaries and other habitats.

With more nutrients in the ecosystem, the growth of plants and algae explodes. During the day, algae photosynthesize and release O2 as a byproduct. However, excess nutrients cause these same algae grow densely near the surface of the water, decreasing the light available to plants growing below the water on the soil surface. Without light, the plants die and are broken down by decomposers. Decomposers, such as bacteria, use a lot of O2 because they respire as they break down plant material. Because there is so much dead plant material for decomposers, they use up most of the O2 dissolved in the water. Eventually there is not enough O2 for aquatic animals, such as fish and shellfish, and they begin to die-off as well.

Two features can be used to identify whether eutrophication is occurring. The first feature is low levels of dissolved O2 in the water. The second feature is when there are large changes in the amount of dissolved O2 from dawn to dusk. Remember, during the day when it’s sunny, photosynthesis converts CO2, water, and light into glucose and O2. Decomposition reverses the process, using glucose and O2 and producing CO2 and water. This means that when the sun is down at night, O2 is not being added to the water from photosynthesis. However, O2 is still being used for decomposition and respiration by animals and plants at night.

The scientists focused on two locations in the Plum Island Estuary and measured dissolved O2 levels, or the amount of O2 in the water. They looked at how the levels of O2 changed throughout the day and night. They predicted that the upper part of the estuary would show the two features of eutrophication because it is located near an urban area. They also predicted the lower part of the estuary would not be affected by eutrophication because it was farther from urban areas.

A view of the Plum Island estuary

A view of the Plum Island estuary

Featured scientists: Charles Hopkinson from University of Georgia and Hap Garritt from the Marine Biological Laboratory Ecosystems Center

Flesch–Kincaid Reading Grade Level = 9.6