Urbanization and estuary eutrophication

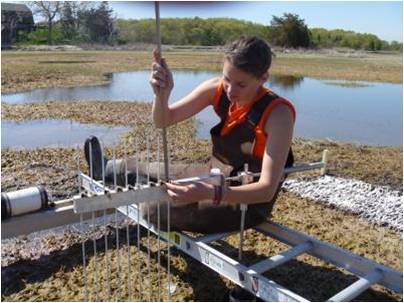
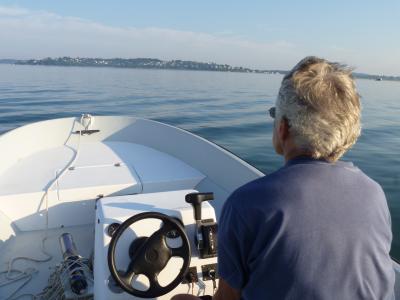
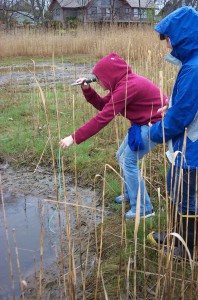
Charles Hopkinson out taking dissolved O2 measurements.

Charles Hopkinson out taking dissolved O2 measurements.

The activities are as follows:

An estuary is a habitat formed where a freshwater river or stream meets a saltwater ocean. Many estuaries can be found along the Atlantic coast of North America. Reeds and grasses are the dominant type of plant in estuaries because they are able to tolerate and grow in the salty water. Where these reeds and grasses grow they form a special habitat called a salt marsh. Salt marshes are important because they filter polluted water and buffer the land from storms. Salt marshes are the habitat for many different kinds of plants, fish, shellfish, and birds.

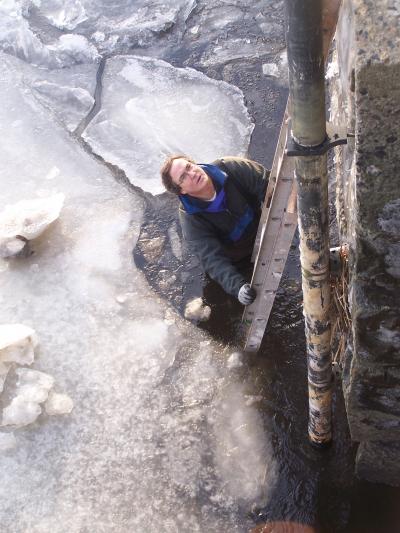
Hap Garritt removing an oxygen logger from Middle Road Bridge in winter.

Hap Garritt removing an oxygen logger from Middle Road Bridge in winter.

Scientists are worried because some salt marshes are in trouble! Runoff from rain washes nutrients, usually from lawn fertilizers and agriculture, from land and carries them to estuaries. When excess nutrients, such as nitrogen or phosphorus, enter an ecosystem the natural balance is disrupted. The ecosystem becomes more productive, called eutrophication. Eutrophication can cause major problems for estuaries and other habitats.

With more nutrients in the ecosystem, the growth of plants and algae explodes. During the day, algae photosynthesize and release O2 as a byproduct. However, excess nutrients cause these same algae grow densely near the surface of the water, decreasing the light available to plants growing below the water on the soil surface. Without light, the plants die and are broken down by decomposers. Decomposers, such as bacteria, use a lot of O2 because they respire as they break down plant material. Because there is so much dead plant material for decomposers, they use up most of the O2 dissolved in the water. Eventually there is not enough O2 for aquatic animals, such as fish and shellfish, and they begin to die-off as well.

Two features can be used to identify whether eutrophication is occurring. The first feature is low levels of dissolved O2 in the water. The second feature is when there are large changes in the amount of dissolved O2 from dawn to dusk. Remember, during the day when it’s sunny, photosynthesis converts CO2, water, and light into glucose and O2. Decomposition reverses the process, using glucose and O2 and producing CO2 and water. This means that when the sun is down at night, O2 is not being added to the water from photosynthesis. However, O2 is still being used for decomposition and respiration by animals and plants at night.

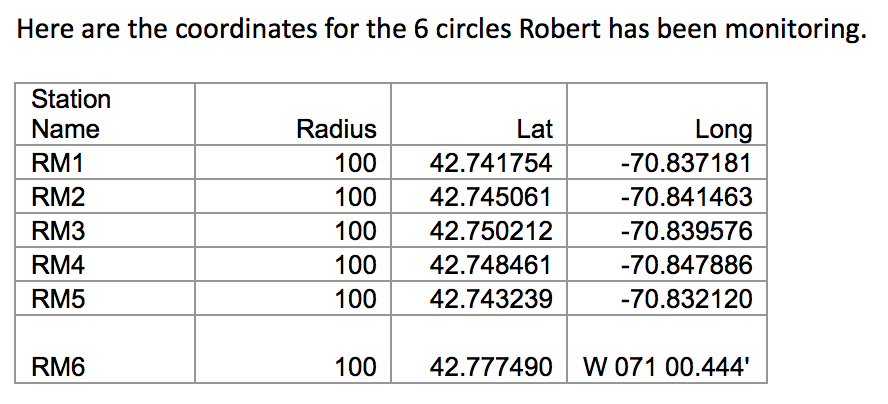
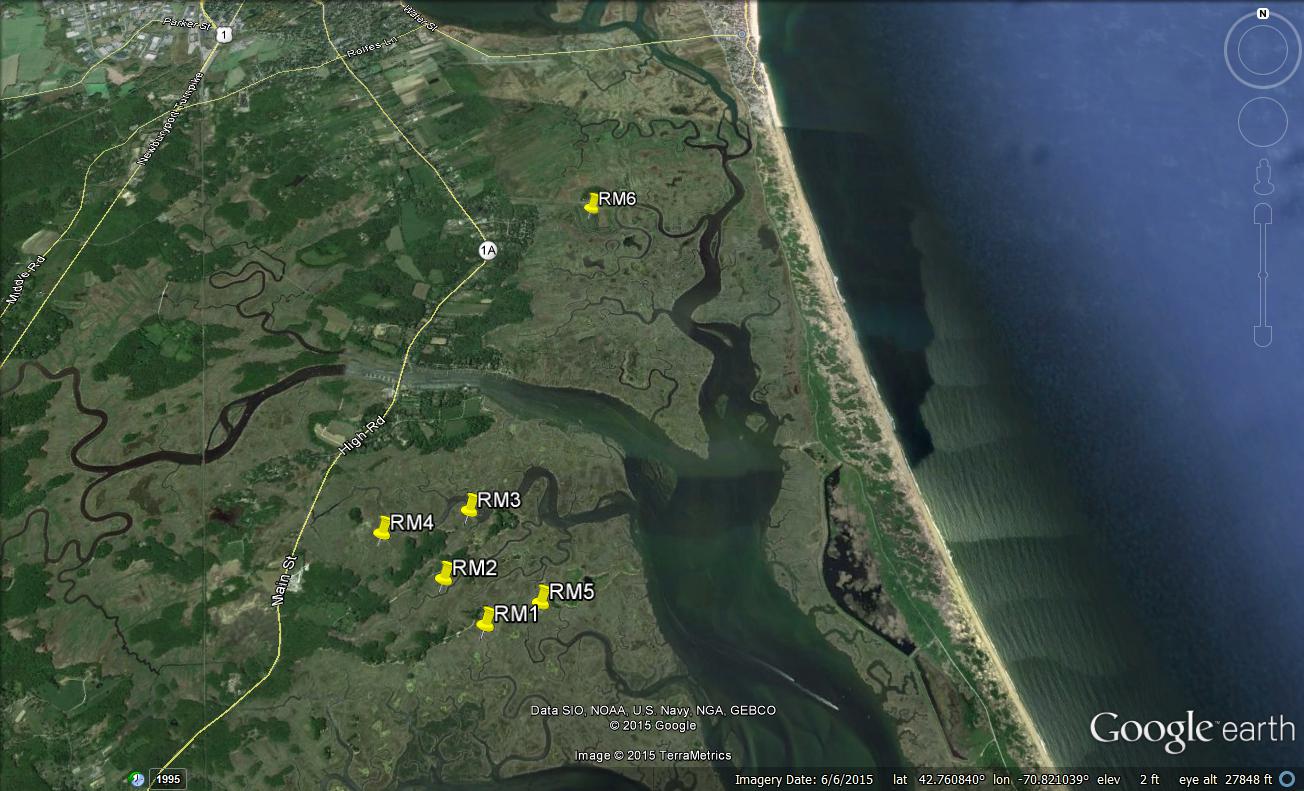
The scientists focused on two locations in the Plum Island Estuary and measured dissolved O2 levels, or the amount of O2 in the water. They looked at how the levels of O2 changed throughout the day and night. They predicted that the upper part of the estuary would show the two features of eutrophication because it is located near an urban area. They also predicted the lower part of the estuary would not be affected by eutrophication because it was farther from urban areas.

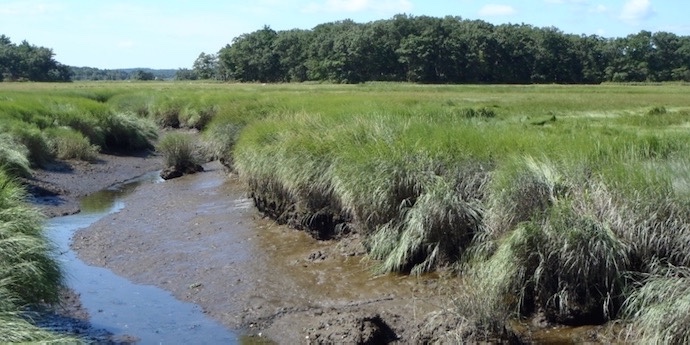
A view of the Plum Island estuary

A view of the Plum Island estuary

Featured scientists: Charles Hopkinson from University of Georgia and Hap Garritt from the Marine Biological Laboratory Ecosystems Center

Flesch–Kincaid Reading Grade Level = 9.6

Can a salt marsh recover after restoration?

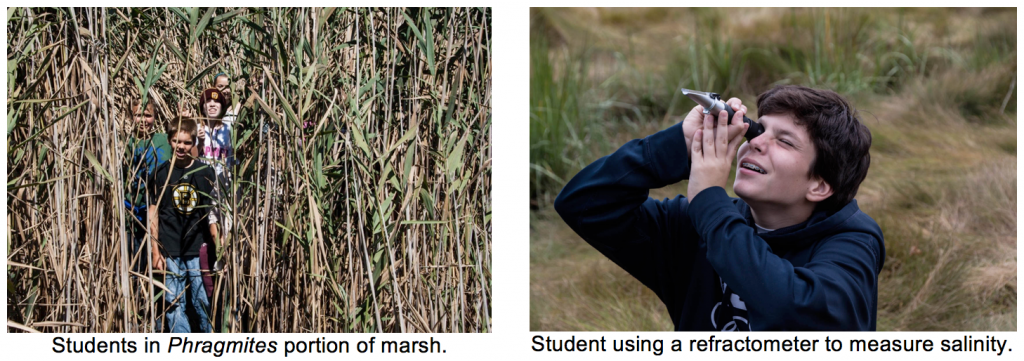
Students collecting salinity data at a transect point. The tall tan grass is Phragmites.

Students collecting salinity data at a transect point. The tall tan grass is Phragmites.

The activities are as follows:

Éste Data Nugget también está disponible en Español:

In the 1990s, it was clear that the Saratoga Creek salt marsh was in trouble. The invasive plant, Phragmites australis, covered large areas of the marsh. Thick patches of Phragmites crowded out native plants. There were very few animals, especially migrating birds, because the plants grew too densely for them to move around.

Salt marshes are wetland habitats near oceans where water-tolerant salt-loving plants grow. Usually native grasses dominate the marsh, but where humans cause disturbance Phragmites can start to take over. Human disturbance was having a huge effect on the health of Saratoga Creek by changing the water coming into the marsh. Storm drains, built to keep rain water off the roads, were adding more water to the marsh. This runoff, or freshwater and sediments from the surrounding land, made the marsh less salty. The extra sediment made the problem even worse because it raised soil levels along the road. Raised soil means less salty ocean comes into the marsh during high tide.

In 1998, scientists, including members of the Rockport Conservation Commission and students from the Rockport Middle School science club, began to look at the problem. Phragmites grows best when salt levels are low. When salt levels are high, native grasses do better. The scientists thought that the extra fresh water and sediments added by the storm drains into the marsh was the reason Phragmites was taking over.

The scientists wanted to see if a restoration could reverse the Phragmites invasion. In 1999, a ditch was dug along the side the road to catch runoff before it entered the marsh. A layer of sediment was also removed from the marsh, allowing ocean water to reach the marsh during high tide once again. Students set up sampling areas, chosen to observe and record data, called transects. Transects were 25 meters long and students collected data every meter. The transects made it possible to return to the same points in the marsh year after year. Along the transects, students counted the number of Phragmites plants and calculated abundance as the percent of points along the transect where they found Phragmites. They also measured the height of Phragmites as a way to figure out how well it was growing.

The students compared Phragmites data from before 1999 and after 1999 to see if the restoration made a difference. They predicted that the abundance and height of Phragmites would go down after runoff was reduced by the restoration.

Screen Shot 2015-08-18 at 5.05.46 PM

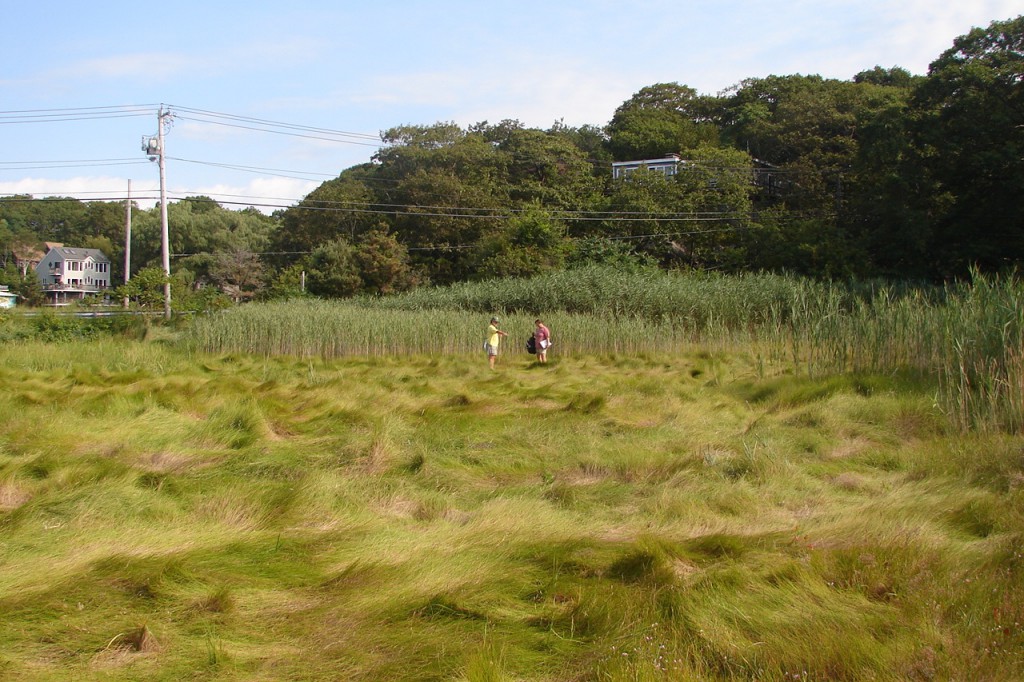
View of Saratoga Creek Salt Marsh several years after restoration, showing location of one of the transects. Native grasses are growing in the foreground.

View of Saratoga Creek Salt Marsh several years after restoration, showing location of one of the transects. Native grasses are growing in the foreground.

Featured scientists: Liz Duff from Mass Audubon, Eric Hutchins from NOAA, and Bob Allia and 7th graders from Rockport Middle School

Written by: Bob Allia, Cindy Richmond, and Dave Young

Flesch–Kincaid Reading Grade Level = 8.9

For more information on this project, including datasets and more scientific background, check out their website: Salt Marsh Science

Springing forward

Scientist Shaun collecting phenology data in the climate change experiment. He is recording the date that the first flowers emerge for dame’s rocket.

Sean Mooney, a high school researcher, collecting phenology data in the climate change experiment. He is recording the date that the first flowers emerge for dame’s rocket.

The Reading Level 1 activities are as follows:

The Reading Level 3 activities are as follows:

Éste Data Nugget también está disponible en Español:

Every day we add more greenhouse gases to our air when we burn fossil fuels like oil, coal, and natural gas. Greenhouse gasses trap the sun’s heat, so as we add more the Earth is heating up! What does climate change mean for the species on our planet? The timing of life cycle events for plants and animals, like flowering and migration, is largely determined by cues organisms take from the environment. The timing of these events is called phenology. Scientists studying phenology are interested in how climate change will influence different species. For example, with warming temperatures and more unpredictable transitions between seasons, what can we expect to happen to the migration timings of birds, mating seasons for animals, or flowering times of plants?

Scientists collecting phenology data in the climate change experiment. They are recording the date that the first flowers emerge for dame’s rocket.

Scientists collecting phenology data in the climate change experiment.

Plants are the foundation for almost all life on Earth. Through photosynthesis, plants produce the oxygen (O2) that we breathe, food for their own growth and development, food for animals and microbes, and crops that provide food and materials for human society. Because plants are so important to life, we need to find out how climate change could affect them. One good place to start is by looking at flowering plants, guided by the question, how will increased temperatures affect the phenology of flowering? One possible answer to this question is that the date that flowers first emerge for a species is driven by temperature. If this relationship is real, we would expect flowers to emerge earlier each year as temperatures increase due to climate change. But if flowers come out earlier and earlier each year, this could greatly impact plant reproduction and could cause problems for pollinators who count on plants flowering at the same time the pollinators need the pollen for food.

Shaun, Mark, Elizabeth, and Jen are scientists in Michigan who wanted to know if higher temperatures would lead to earlier flowering dates for plants. They chose to look at flowers of dame’s rocket, a leafy plant that is related to the plants we use to make mustard! Mark planted dame’s rocket in eight plots of land. Plots were randomly assigned to one of two treatments. Half of the plots were left to experience normal temperatures (normal), while the other four received a heating treatment to simulate climate change (heated). Air temperatures in heated plots increased by 3°C, which mimics climate change projections for what Michigan will experience by the end of the century. Mark, Elizabeth, and Jen measured the date that each plant produced its first flower, and the survival of each plant. The scientists predicted that dame’s rocket growing in the heated plots would flower earlier than those in the normal plots.

 Featured scientists: Shaun Davis from Thornapple Kellogg Middle School and Mark Hammond, Elizabeth Schultheis, and Jen Lau from Michigan State University

Flesch–Kincaid Reading Grade Level = The Reading Level 3 activity has a score of 9.2; the Level 1 has a 6.4.

Flowers of Hesperis matronalis (dame’s rocket), a species of mustard that was introduced to the U.S. from Eurasia.

Flowers of Hesperis matronalis (dame’s rocket), a species of mustard that was introduced to the U.S. from Eurasia.

Additional teacher resources related to this Data Nugget include:

  • If you would like your students to interact with the raw data, we have attached the original data here. The file also includes weather data over the course of the experiment if students want to ask and explore independent questions.

SaveSave

SaveSave

SaveSave

SaveSave

SaveSave

SaveSave

SaveSave

SaveSave

SaveSave

SaveSave

SaveSave

Marvelous mud

mud

You can tell that the mud in this picture is high in organic matter because it is dark brown and mucky (in real life you’d be able to smell it, too!)

The activities are as follows:

The goopy, mucky, often stinky mud at the bottom of a wetland or lake is a very important part of the ecosystem. Wetland mud is much more than just wet dirt. For example, many species of microbes live in the wetland mud where they decompose (breakdown) dead plant and animal material to obtain energy. This dead plant and animal material is called organic matter. However, the wetland mud microbes do not have all the oxygen they need to decompose the plant and animal tissues quickly and efficiently. Because of this, the dead material in wetland mud decomposes much more slowly than similar dead material in dry soil.

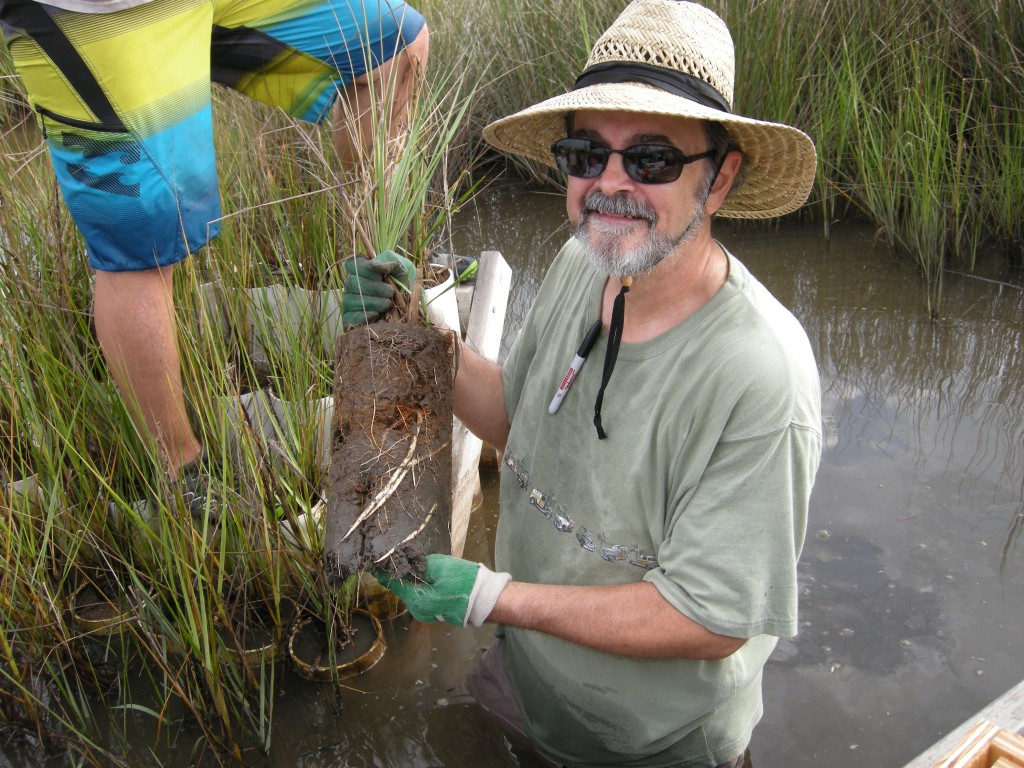
A successful core! You can see that the tube has mud, as well as some of the water from the wetland that was on top of the mud.

A successful core! You can see that the tube has mud, as well as some of the water from the wetland that was on top of the mud.

As a graduate student, Lauren became fascinated with wetland mud and its interesting properties. She wanted to know how important all the mud and its organic matter is for wetlands. By talking with other members of her lab and reading scientific papers, Lauren learned that wetland mud can often be high in the element phosphorus and that phosphorus acts as a fertilizer for plants, including wetland plants and algae. However, nutrients, such as phosphorus can build up in wetland mud. Lauren thought it might be possible that the organic matter in the mud was the source of all the phosphorus in some wetlands. She predicted that wetlands with more organic matter would have more phosphorus. If her data support her hypothesis, it could mean that organic matter is very important for wetlands, because nutrients are needed for algae and plants to grow.

Although most mud is high in organic matter and nutrients, not all mud is the same. There is natural variation in the amount of organic matter and nutrients from place to place. Even within the same location mud can be very different in spots. Lauren used this variability to test her ideas. She measured organic matter and phosphorus in mud from 16 freshwater locations (four lakes, five ponds, and seven wetlands). She took cores that allowed her to sample mud deep into the ground. She then brought her cores back to the lab and measured organic matter and phosphorus levels in her samples.

Featured scientist: Lauren Kinsman-Costello from Kent State University

Flesch–Kincaid Reading Grade Level = 9.8

More photos associated with this research can be found here. There is one scientific paper associated with the data in this Data Nugget. The citation and PDF of the paper is below:

Kinsman-Costello LE, J O’Brien, SK Hamilton (2014) Re-flooding a Historically Drained Wetland Leads to Rapid Sediment Phosphorus Release. Ecosystems 17:641-656

SaveSave

SaveSave

SaveSave

SaveSave

SaveSave

SaveSave

Is chocolate for the birds?

Cocoa beans used to make chocolate!

Cocoa beans used to make chocolate!

The activities are as follows:

About 9,000 years ago humans invented agriculture as a way to grow enough food for people to eat. Today, agriculture happens all over the globe and takes up 40% of Earth’s land surface. To make space for our food, humans must clear large areas of land, which creates a drastic change, or disturbance, to the habitat. This land-clearing disturbance removes the native plants already there including trees, small flowering plants, and grasses. Many types of animals including mammals, birds, and insects depend on these native plants for food or shelter. Large scale disturbances can make it difficult to live in the area. For example, a woodpecker bird cannot live somewhere that has no trees because they live and find their food in the trees.

However, some agriculture might help some animals because they can use the crops being grown for the food and shelter they need to survive. One example is the cacao tree, which grows in the rainforests of South America. Humans use the seeds of this plant to make chocolate, so it is a very important crop! Cacao trees need very little light. They grow best in a unique habitat called the forest understory, which is composed of the shorter trees and bushes under the large trees found in rainforests. To get a lot of cacao seeds for chocolate, farmers need to have large rainforest trees above their cacao trees for shade. In many ways, cacao farms resemble a native rainforest. Many native plant species grow there and there are still taller tree species. However, these farms are different in important ways from a native rainforest. For example, there are many more short understory trees in the farm than there are in native rainforests. Also, there are fewer small flowering plants on the ground because humans that work on cacao farms trample them as they walk around the farm.

rainforest and cacao plantation

Part I: Skye is a biologist who wanted to know whether rainforest birds use the forest when they are disturbed by adding cacao farms. Skye predicted she would see many fewer birds in the cacao farms, compared to the rainforest. To measure bird abundance, she simply counted birds in each habitat. To do this she chose one rainforest and one cacao farm and set up two transects in each. Transects are parallel lines along which the measurements are taken. She spent four days counting birds along each transect, for a total of eight days in each habitat. She had to get up really early and count birds between 6:00 and 9:00 in the morning because that’s when they are most active.

Part II: Skye was shocked to see so many birds in cacao farms! She decided to take a closer look at her data. Skye wanted to know how the types of birds she saw in the cacao farms compared to the types of birds she saw in the rainforest. She predicted that cacao farms would have different types of birds than the undisturbed rainforest. She thought the bird types would differ because each habitat has different types of food available for birds to eat and different types of plants for birds to live in.

Skye broke her abundance data down to look more closely at four types of birds:

  1. Toucans (Eat: large insects and fruit from large trees, Live: holes in large trees)
  2. Hummingbirds (Eat: nectar from flowers, Live: tree branches and leaves)
  3. Wrens (Eat: small insects, Live: small shrubs on the forest floor)
  4. Flycatchers (Eat: Small insects, Live: tree branches and leaves)

skyecacao

Featured scientist: Skye Greenler from Colorado College and Purdue University

Flesch–Kincaid Reading Grade Level = 8.5

Additional teacher resources related to this Data Nugget:

  • The research described in this activity has been published. The citation and a PDF of the scientific paper can be found here:
  • The complete dataset for the study has been published to a data repository and is available for classroom use. This dataset has even more data than what is in the Data Nugget activity. While the Data Nugget has data for just two habitats (cacao and rainforest), the full dataset also includes two other agroforest habitat types. The dataset also includes data for every species (169) recorded during the study, whereas the Data Nugget only has data for four families (toucans, wrens, flycatchers, hummingbirds).
  • Study Location: Skye’s study took place in a 10 km2 mixed rainforest, pasture, agro-forest, and monoculture landscape near the village of Pueblo Nuevo de Villa Franca de Guácimo, Limón Province, Costa Rica (10˚20˝ N, 83˚20˝ W), in the Caribbean lowlands 85 km northeast of San José.
  • For more background on the importance of biodiversity, students can eat this article in The Guardian – What is biodiversity and why does it matter to us?

About Skye: As a child Skye was always asking why; questioning the behavior, characteristics, and interactions of plants and animals around her.  She spent her childhood reconstructing deer skeletons to understand how bones and joints functioned and creating endless mini-ecosystems in plastic bottles to watch how they changed over time.  This love of discovery, observation, questioning, and experimentation led her to many technician jobs, independent research projects, and graduate research study at Purdue University.  At Purdue she studies the factors influencing oak regeneration after ecologically based timber harvest and prescribed fire.  While Skye’s primary focus is ecological research, she loves getting to leave the lab and bring science into classrooms to inspire the next generation of young scientists and encourage all students to be always asking why!

SaveSave

SaveSave

SaveSave

SaveSave

SaveSave

SaveSave

SaveSave

SaveSave

SaveSave

SaveSave

SaveSave

SaveSave

Finding a Foothold

The activities are as follows:

Have you ever noticed that the ground at a beach has rocks of many different sizes? These rocks, sand, and dirt are all called substrates. The types of substrate we see are described by the size of the particles that cover the ground. These can range from large boulders down to fine grains of sand and dirt, with many sizes in between. No matter what type of substrate you see at the beach, you can find organisms that will live in or on it. Just like there are different types of substrates, there are different types of organisms that can live there. How can we determine which types of organisms prefer which types of substrates? That is the job of field researchers!

mollusk-3

Students collecting mollusk data on different beach substrates.

Students and teachers at Kentridge High School have made many field trips to the beach and have seen lots of organisms. Normally, they just noticed what they could see easily in front of them. Students became interested to know how the type of substrate influences which organisms will live there. They noticed that the snails in the aquarium at school like to stick to the glass walls of the tank. Do snails and other shelled mollusks found near the ocean, like chitons, periwinkles, whelks and limpets, also like to live on large, stable substrates? The students went to beach to find out!

Mollusks have a “foot” which may be able to attach more securely to larger substrates, such as boulders, and allow them more room to move. So, the students expected to find more mollusks on boulders than on other types of substrates. To gather the data needed to answer this question, the students went to a local beach. They looked at sections of the beach with substrates of all types. On these different substrates, they kept track of all the different types of organisms that were present. They measured the frequency that they observed four types of mollusks (chitons, limpets, whelks, and periwinkles) on the following substrates: boulder, gravel, pebble, logs, sand, and shell debris. Frequency was measured as the proportion of times that a particular organism was present on a substrate type, out of the total number of observations. For example, if they observed 2 boulders and saw limpets on 1, the frequency would = ½ or 0.5.

Featured scientists: Darrel Nash and Sarah Hall from Kentridge High School, Washington

Flesch–Kincaid Reading Grade Level = 7.4

For more information on the Seattle Aquarium’s citizen science project, and to download the dataset from this project, click here

Do invasive species escape their enemies?

One of the invasive plants found in the experiment, Dianthus armeria

One of the invasive plants found in the experiment, Dianthus armeria

The activities are as follows:

Invasive species, like zebra mussels and garlic mustard, are species that have been introduced by humans to a new area. Where they invade they cause harm. For example, invasive species outcompete native species and reduce diversity, damage habitats, and interfere with human interests. Damage from invasive species costs the United States over $100 billion per year.

Scientists want to know, what makes an invasive species become such a problem once it is introduced? Is there something that is different for an invasive species compared to native species that have not been moved to a new area? Many things change for an invasive species when it is introduced somewhere new. For example, a plant that is moved across oceans may not bring enemies (like disease, predators, and herbivores) along for the ride. Now that the plant is in a new area with no enemies, it may do very well and become invasive.

laulab

Scientists at Michigan State University wanted to test whether invasive species are successful because they have escaped their enemies. They predicted invasive species would get less damage from enemies, compared to native species that still live near to their enemies. If native plants have tons of insects that can eat them, while an invasive plant has few or none, this would support enemy escape explaining invasiveness. However, if researchers find that native and invasive species have the same levels of herbivory, this would no support enemy escape. To test this hypothesis, a lab collected data on invasive and native plant species in Kalamazoo County. They measured how many insects were found on each species of plant, and the percent of leaves that had been damaged by insect herbivores. The data they collected is found below and can be used to test whether invasive plants are successful because they get less damage from insects compared to native plants.

Featured scientist: Elizabeth Schultheis from Michigan State University

Flesch–Kincaid Reading Grade Level = 11.3

  • For a lesson plan on the Enemy Release Hypothesis, click here.
  • The Denver Museum of Nature and Science has a short video giving background on invasive species, here

Do insects prefer local or foreign foods?

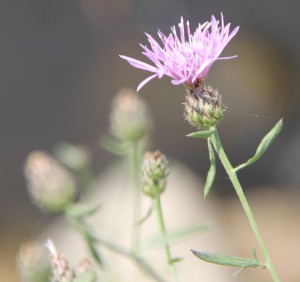
One of the invasive plants found in the experiment, Centaurea stoebe.

One of the invasive plants found in the experiment, Centaurea stoebe.

The activities are as follows:

Insects that feed on plants, called herbivores, can have big effects on how plants grow. Herbivory can change the size and shape of plants, the number of flowers and seeds, and even which plant species can survive in a habitat. A plant with leaves eaten by insect herbivores will likely do worse than a plant that is not eaten.

Plants that naturally grow in an area without human interference are called native plants. When a plant is moved by humans to a new area and lives and grows outside of its natural range, it is called an exotic plant. Sometimes exotic plants become invasive, meaning they grow large and fast, take over habitats, and push out native species. What determines if an exotic species will become invasive? Scientists are very interested in this question. Understanding what makes a species become invasive could help control invasions already underway and prevent new ones in the future.

Because herbivory affects how big and fast a plant can grow, local herbivores may determine if an exotic plant thrives in its new habitat and becomes invasive. Elizabeth, a plant biologist, is fascinated by invasive species and wanted to know why they are able to grow bigger and faster than native and other exotic species. One possibility, she thought, is that invasive species are not recognized by the local insect herbivores as good food sources and thus get less damage from the insects. Escaping herbivory could allow invasive species to grow more and may explain how they become invasive.

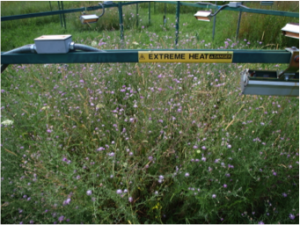
To test this hypothesis, Elizabeth planted 25 native, 25 exotic, and 11 invasive species in a field in Michigan. This field was already full of many plants and had many insect herbivores. The experimental plants grew from 2011 to 2013. Each year, Elizabeth measured herbivory on 10 individuals of each of the 61 species, for a total of 610 plants. To measure herbivory, she looked at the leaves on each plant and determined how much of each leaf was eaten by herbivores. She then compared the area that was eaten to the total area of the leaf and calculated the proportion leaf area eaten by herbivores. Elizabeth predicted that invasive species would have a lower proportion of leaf area eaten compared to native and noninvasive exotic plants.

ERHpics

Featured scientist: Elizabeth Schultheis from Michigan State University

Flesch–Kincaid Reading Grade Level = 10.9

There is one scientific paper associated with the data in this Data Nugget. The citation and PDF of the paper is below, as well as a link to access the full dataset from the study:

For two lesson plans covering the Enemy Release Hypothesis, click here and here

Aerial view of the experiments discussed in this activity:

ERH Field site 2

SaveSave

SaveSave

SaveSave

SaveSave

SaveSave