Poop, poop, goose!

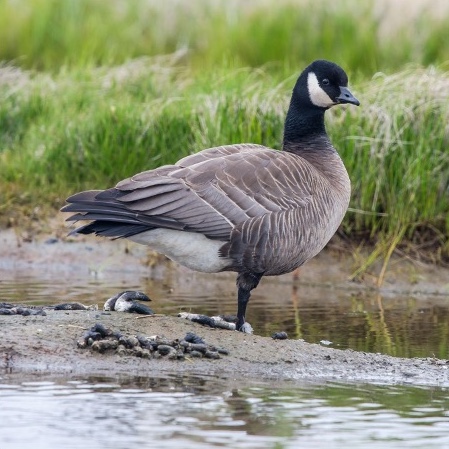
Cackling Goose next to a pile of goose poop, or feces
Cackling Goose next to a pile of goose poop, or feces. Photo by Andrea Pokrzywinski.

The activities are as follows:

Each spring, millions of birds return to the Yukon-Kuskokwim Delta. This delta is where two of the largest rivers in Alaska empty into the Bering Sea. It is also one of the world’s most significant habitats for geese to breed and raise their young. 

With all these geese coming together in one area, they create quite a mess – they drop tons of poop onto the soil. So much poop in fact, that scientists wonder whether poop from this area in Alaska could have a global impact! Climate change is a worldwide environmental issue that is caused by too many greenhouse gasses being released into our atmosphere. Typically, we think of humans as the cause of this greenhouse gas release, but other animals can contribute as well. 

When poop falls onto the soil it is decomposed by bacteria. Bacteria release methane (CH4), a potent greenhouse gas. The more geese there are, the more poop they will produce and the more food there will be for soil bacteria. By increasing the amount of greenhouse gasses that are released by soil bacteria, geese might actually indirectly contribute to global climate change.

Trisha is an ecosystem ecologist who scoops goose poop for research projects. Her research is looking into whether animals, other than humans, can change the carbon cycle. Trisha teamed up with Bonnie, a fellow ecosystem ecologist. Bonnie studies how matter moves between the living parts of the environment, such as plants and animals, and the nonliving parts. She is especially interested in how bacteria in the soil play a role in the carbon cycle.

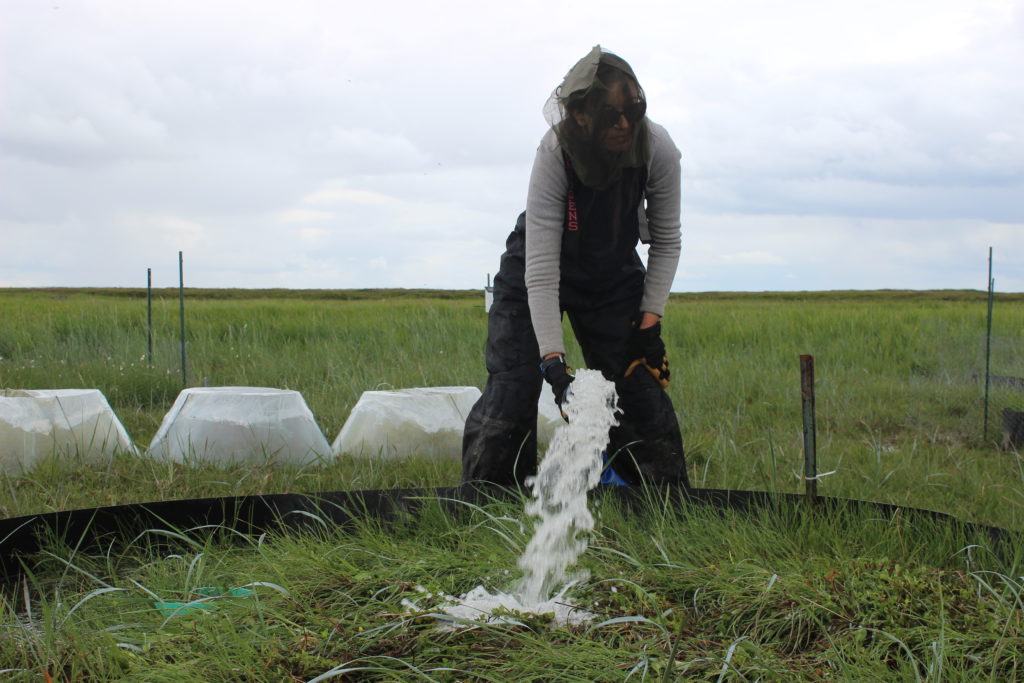
Together, the team designed a three-year project to figure out the effects of goose poop on the carbon cycle. Each summer, a large team of researchers spend 90 days camping on remote sites near the Yukon-Kuskokwim Delta. The team scooped up poop from nearby goose habitats to use in their experiments. They set up six control plots where they added no poop and six treatment plots where they added poop. From these twelve plots, the team measured methane emissions from the soil. Methane was measured as methane flux in micromoles, or µM. These data helped them determine how ecosystems respond to geese by measuring whether goose poop affects methane production by soil bacteria.  

Featured scientists: Trisha Atwood of Utah State University and Bonnie Waring of Imperial College. Written by Andrea Pokrzywinski.

Flesch–Kincaid Reading Grade Level = 8.7

Additional teacher resources related to this Data Nugget include:

Sink or source? How grazing geese impact the carbon cycle

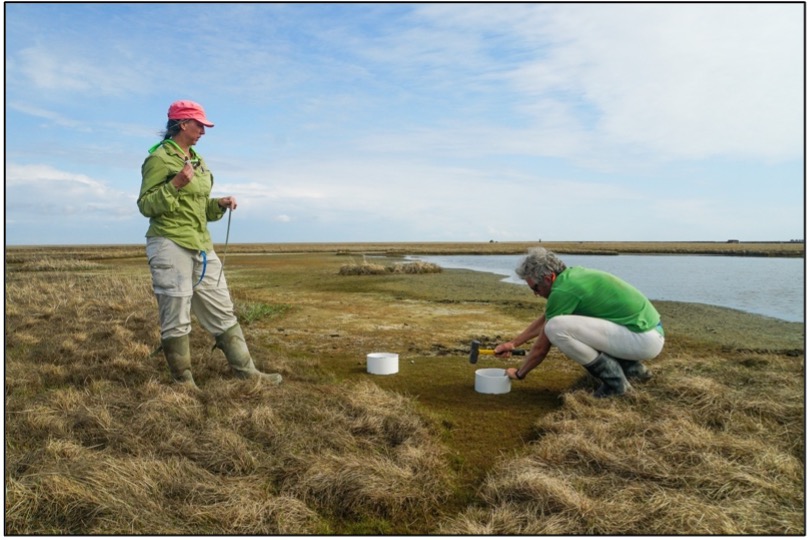
Tricia (left) installing carbon dioxide plots in the field.

The activities are as follows:

“If it wasn’t for the geese, you and I would not be here today because our ancestors would not have made it. When long, hard winters emptied people’s food caches early, starvation loomed. Return of geese in April saved us.” – Chuck Hunt, born and raised on the Yukon-Kuskokwim Delta

Spring geese are an essential food source for subsistence communities like Chevak, Alaska. Elders in western Alaska Native communities have observed a decrease in geese returning to their villages over time. These changes affect the local communities and could also affect the local ecosystem.

One way geese change their environment is by eating grass. In the Yukon-Kuskokwim Delta in western Alaska, birds from every continent on Earth migrate to this sub-Arctic habitat to lay their eggs and raise their young. Once they arrive, geese eat a ton of grass. They graze only in specific areas, called grazing lawns, leaving the rest of the vegetation alone.

When geese graze on wetland plants, they remove plant matter, potentially decreasing the amount of carbon dioxide, or CO2, that is released during photosynthesis. As plants photosynthesize, they absorb CO2 from the atmosphere and turn it into glucose (a sugar) and oxygen. Gross primary production is the total amount of energy that plants capture from sunlight to grow and live before they use up some of that energy for themselves. Plants can slow climate change by removing CO2 from the atmosphere and turning it into plant matter, like leaves and roots.

A scientist mimics geese grazing by clipping the grass.

Trisha is a scientist who became interested in ways that animals can affect the carbon cycle through their interactions with the environment. She wondered whether fewer geese returning to western Alaska could have global consequences that extend beyond remote communities. She thought that if geese ate enough grass, they may limit photosynthesis. This is important because it could change whether this ecosystem is a carbon sink or a carbon source. An ecosystem is called a carbon sink if it absorbs more CO2 through photosynthesis than it releases through respiration. Alternatively, an ecosystem can be a carbon source if more CO2 is released than absorbed. We want ecosystems to be carbon sinks because then they keep CO2 out of the atmosphere, where it contributes to global warming.

To test her idea, Trisha teamed up with fellow scientists Bonnie, Karen, and Jaron to take a closer look at how grazing grass influences whether the Y-K Delta ecosystem is releasing or absorbing CO2. To do their experiment they had to get creative. They considered getting a lot of geese, bringing them to an ungrazed area, and letting them chow down. However, it’s hard to capture geese and get them to graze exactly where you want. So instead, the research team simulated the effects of geese by cutting the grass to mimic nibbling and then gently vacuuming the pieces of grass to remove them.

The “Carbon and Geese” scientist team.

The team set up six different experimental areas. Inside each area were two plots: one that was left ungrazed, and the other which was artificially grazed. The research team then used a piece of equipment called a LI-COR to measure the quantity of CO2 in the air above each plot. They recorded the CO2 levels during the day and night. The comparison from day to night is one way to look at gross primary production and respiration in a system. At night, when there is no light, plants can’t photosynthesize, so the detected CO2 will be from respiration. The levels during the day represent a combination of CO2 absorption by plants and release from respiration.

To assess whether the ecosystem is a carbon sink or source, we need to determine the difference between respiration and gross primary production, or net ecosystem exchange (NEE). A negative NEE means the ecosystem absorbs more CO2 than it emits. A positive NEE means the ecosystem is releasing more CO2 than it is absorbing. In this way, scientists classify an ecosystem as either a carbon sink that is storing carbon or a carbon source that is releasing carbon into the atmosphere.

Featured scientists: Trisha Atwood, Karen Beard, and Jaron Adkins from Utah State University and Bonnie Waring from Imperial College. Written by Andrea Pokrzywinski.

Flesch–Kincaid Reading Grade Level: 8.9

Additional teacher resources related to this Data Nugget:

Check out this website created by teacher Andrea who participated in the research and wrote this Data Nugget. You will find additional lesson plans, videos, slides, and articles to use in the classroom!

Surviving the flood

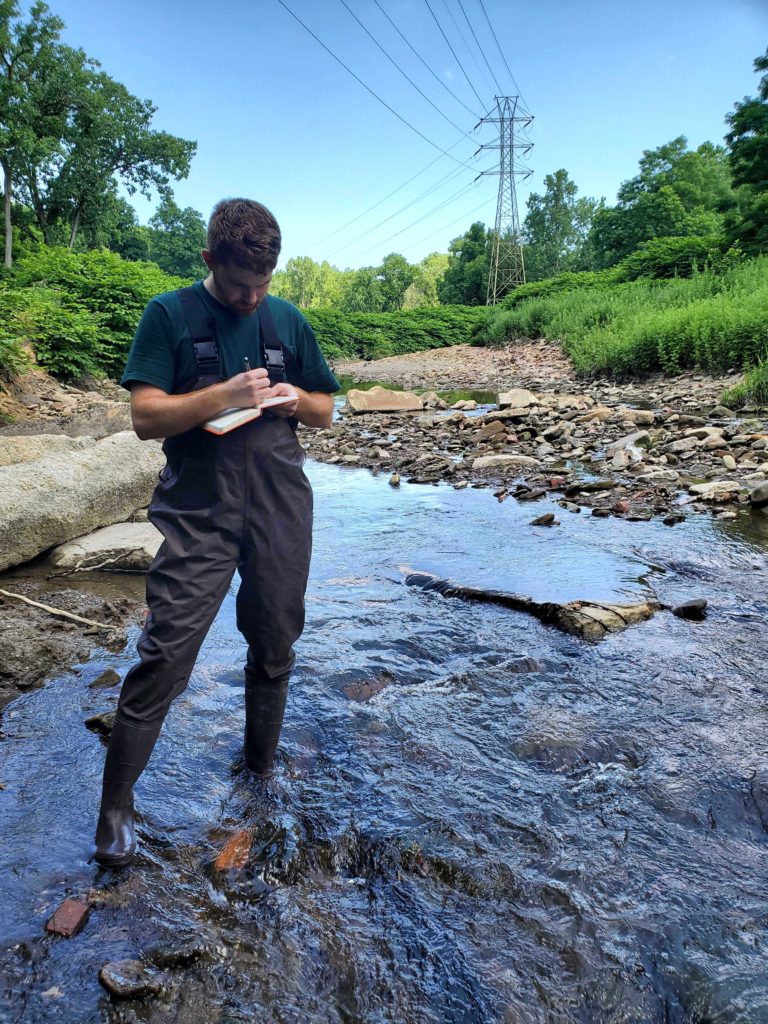
Andrew writing down field notes in an urban stream.

The activities are as follows:

When imagining a stream, you may think of pristine water flowing through a forest or mountain valley. However, streams are found everywhere, including cities. Many of these urban streams run through a pipe, disappear underground, or are filled with water that doesn’t seem to be moving. These streams are often overlooked because they appear more like deep ditches or canals, but they play an important role in water management.

When rain falls in a forest, it flows through the soil, moving in the small spaces between soil particles. Eventually, it reaches a stream. This journey slows the water and prevents flooding. However, when rain falls in an urban area, it often does not move through soil before getting to a stream. Urban streams are instead surrounded by buildings, roads, and parking lots. Water races over these surfaces, causing rapid flooding. This water, called stormwater runoff, can cause a stream to go from ankle-deep to over your head in just a few hours!

A team of stream ecologists, including graduate student Andrew and his advisor Dave, wanted to see whether stormwater floods disturb urban stream ecosystems. Urban streams provide important habitat for many species – fish, insects, crustaceans, bacteria, and algae. Andrew and Dave have observed how large stormwater floods can sweep algae off rocks or bury algae with sediment that is washed in from parking lots. However, algae and other organisms in urban streams are used to living in a habitat with frequent disturbance and can cling to the rocks during small floods.

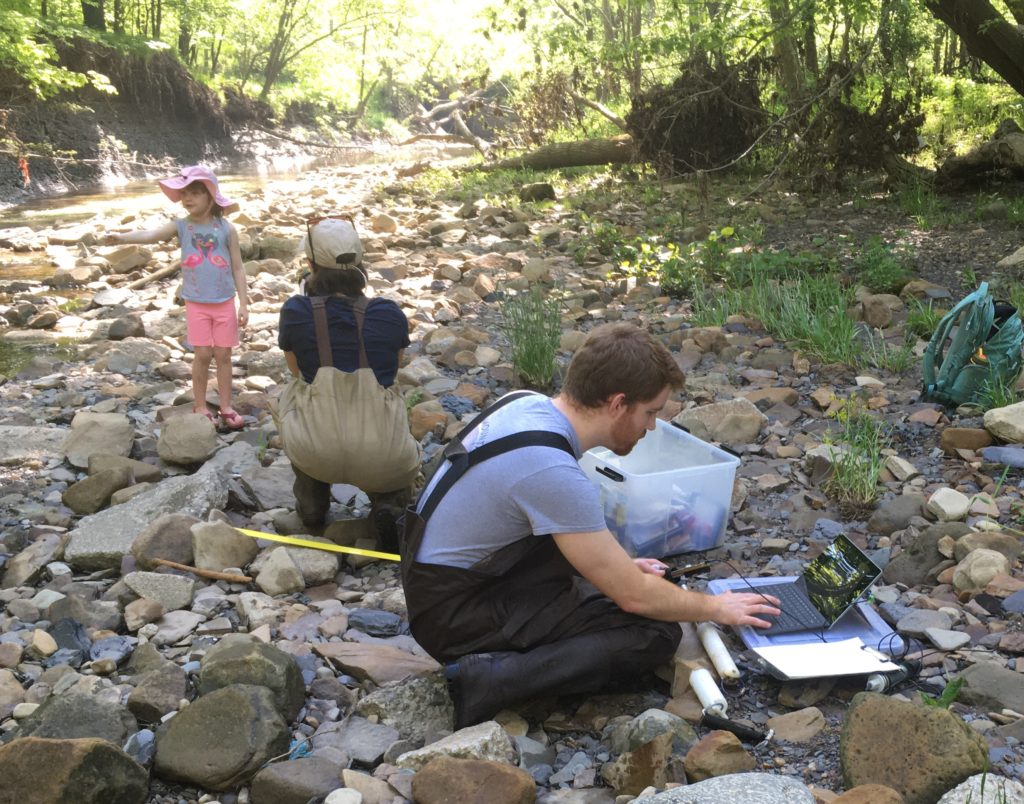
Andrew downloading data from the data loggers.

Andrew and Dave focused their research on algae because they are an important part of aquatic ecosystems. Algae use energy from sunlight and building blocks from carbon dioxide gas to create sugar and oxygen. This process is called photosynthesis. By photosynthesizing during the day and not at night, algae cause large changes in the amount of oxygen in stream water. Taking a closer look at these daily oxygen changes, you can see how well algae are doing and how healthy a stream is.

Andrew and Dave monitored daily changes in the stream by using sensors that collect oxygen concentrations every 10 minutes.

Andrew and Dave also needed to measure the intensity of flooding during different kinds of storms. They used a measure called discharge, which accounts for both the amount of water flowing in a stream and how fast it’s moving. During a rain event, the time when the most water at the highest speed is rushing through the stream is called the peak discharge. For this measure, Andrew and Dave had some help from the United States Geological Survey, which has instruments in streams and rivers all over the country measuring discharge all the time. Looking at this dataset, Andrew detected a total of 13 storm events of different sizes during a one-year study period.

When the peak discharge is very high, the fast-moving water and flooding disturb algae by sweeping them off rocks and other surfaces, sending them downstream with the flow of water, and the algae are unable to photosynthesize. To answer their question, they looked at the oxygen concentrations for the day leading up to and following the 13 storms that Andrew identified. The difference in oxygen produced by algae before and after storms is a simple way to look at whether the algae resist the flooding or are disturbed by the flooding. If the oxygen concentration is the same after the storm as it was before the storm, the algae were resistant. If oxygen is lower after the storm than before the storm, that means that the algae were disturbed. Andrew and Dave thought that intense storms with high discharge will disrupt the algae more, resulting in lower oxygen concentrations after a storm than before a storm.

Featured scientists: Andrew Blinn (he/him) and Dave Costello (he/him) from Kent State University

The research and data found in this activity come from the STORMS project, which investigates how stormwater management decisions influence hydrology and stream health in tributaries of the Cuyahoga River Watershed of Ohio.

Flesch–Kincaid Reading Grade Level = 10.3

Additional teacher resources related to this Data Nugget include:

Mowing for Monarchs – Extension Activities

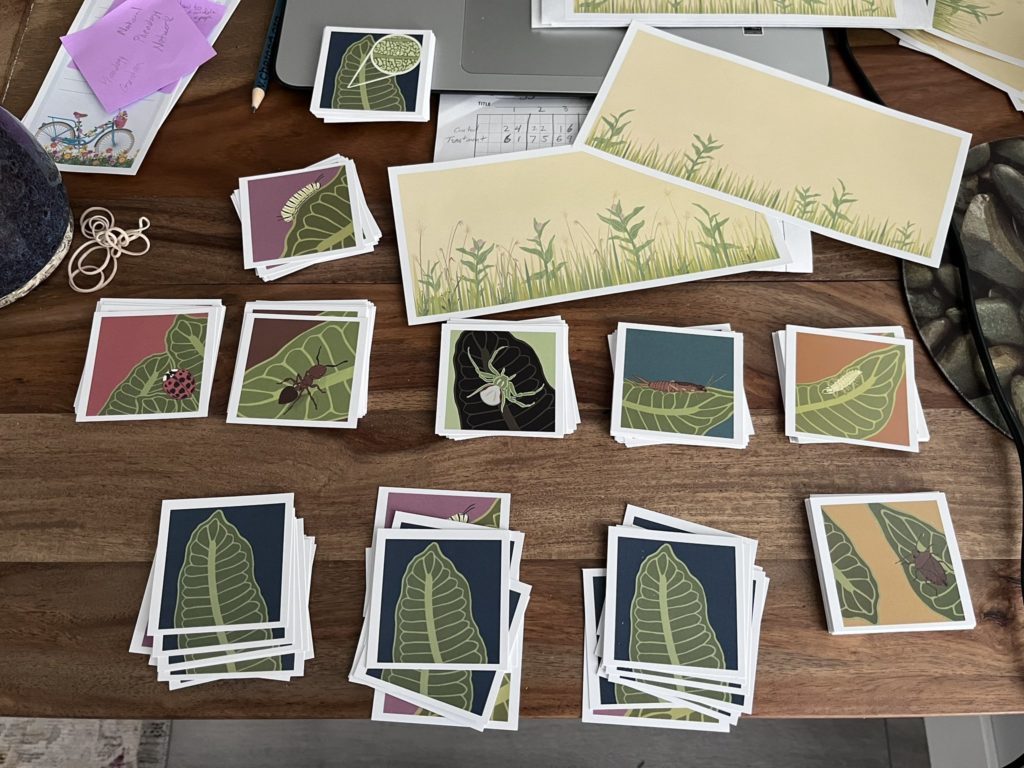
Gabe Knowles has developed and piloted several data activities to accompany these Data Nuggets activities. For the first activity, Gabe developed an extension to bring his data into elementary classrooms. Using beautiful art created by Corinn Rutkoski, the following are materials to print and use the activity in your classroom:

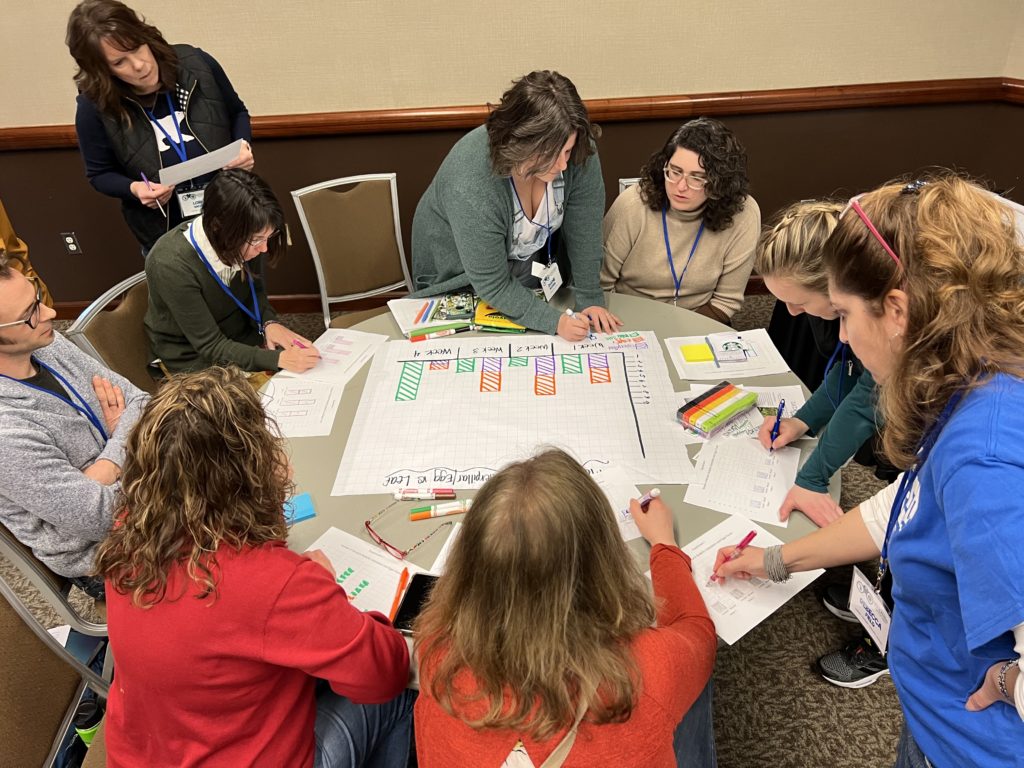
This activity was first piloted at Michigan Science Teachers Association Annual Meeting in 2023.

Mowing for monarchs, Part II

In Part I you explored data that showed monarchs prefer to lay their eggs on young milkweeds that have been mowed, compared to older milkweed plants. But, is milkweed age the only factor that was changed when Britney and Gabe mowed patches of milkweeds? You will now examine whether mowing also affected the presence of monarch predators.

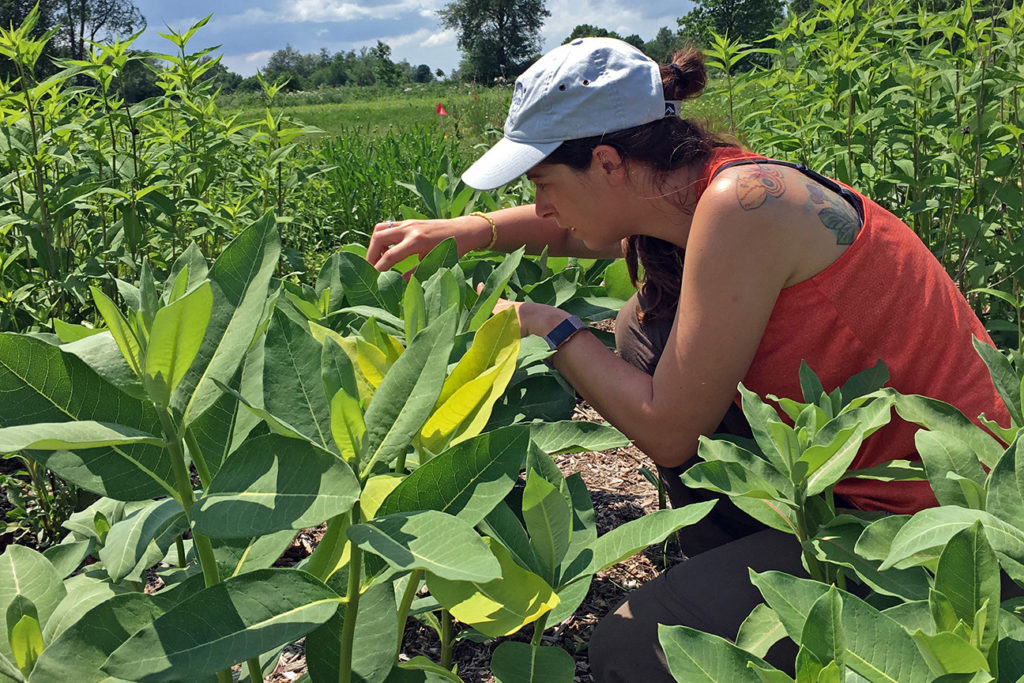
A scientist measuring a milkweed plant.
A scientist, Lizz D’Auria, counting the number of monarch predators on milkweed plants in the experiment.

The activities are as follows:

The bright orange color of monarch butterflies signals to their enemies that they are poisonous. This is a warning that they do not make a tasty meal. Predators, like birds and spiders, that try to eat monarch butterflies usually become sick. Many people think that monarch butterflies have no enemies because they are poisonous. But, in fact they do have a lot of predators, especially when they are young.

Monarchs become poisonous from the food they eat. Adult monarchs lay their eggs on milkweed plants, which have poisonous sap. When the eggs hatch, the caterpillars chomp on the leaves. Young caterpillars are less poisonous because they haven’t eaten much milkweed yet. And monarch eggs are not poisonous at all to predators.

Britney and Gabe met with their friends, Doug and Nate, who are scientists. Doug and Nate thought that Britney and Gabe’s experiment might have changed more than just the age of the milkweed plants in the patches they mowed. By mowing their field sites they were also cutting down the plants in the rest of the community. These plants provide habitat for predators, so mowing all of the plants would affect the predators as well. These ideas led to another potential explanation for the results Britney and Gabe saw in their data. Because all plants were cut in the mowed patches, there was nowhere for monarch predators to hang out. Britney and Gabe came up with an alternative hypothesis that perhaps monarch butterflies were choosing to lay their eggs on young milkweed plants because there were fewer predators nearby. To test this new idea, Britney and Gabe went back to their experimental site and started collecting data on the presence of predators in addition to egg number. Remember that in each location, they had a control patch, which was left alone, and a treatment patch that they mowed. The control patches had older milkweed plants and a full set of plants in the community. The mowed patches had young milkweed plants with short, chopped plants nearby. For the whole summer, they went out weekly to all of the patches. They counted the number of predators found on the milkweed plants so they could compare the mowed and unmowed patches.

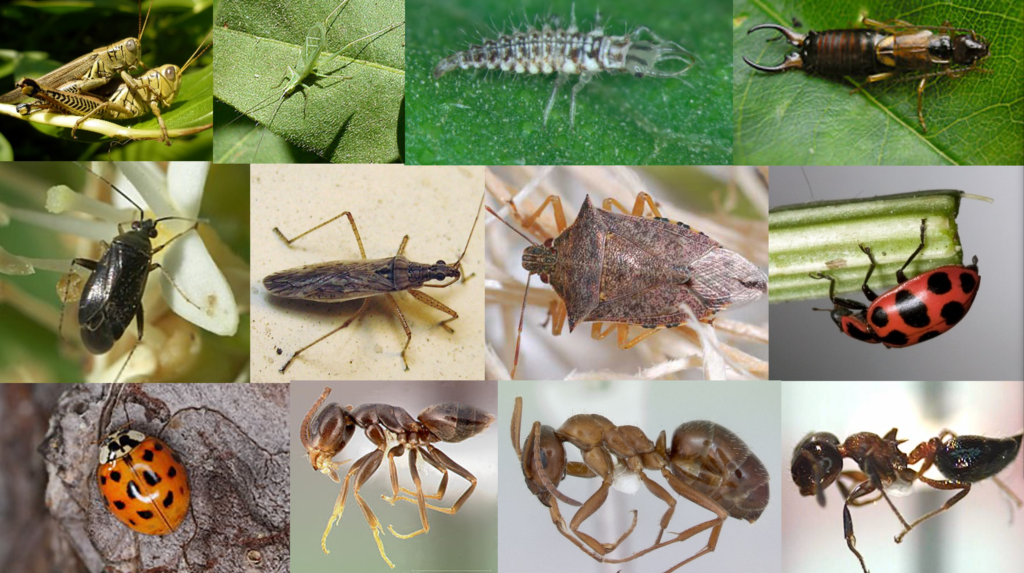
Predators of monarch butterflies.
There are many different species that eat monarch butterfly eggs and young caterpillars. These are just a few of the species that Gabe and Britney observed during their experiment.

Featured scientists: Doug Landis and Nate Haan from Michigan State University and Britney Christensen and Gabe Knowles from Kellogg Biological Station LTER.

Flesch–Kincaid Reading Grade Level = 8.2

Additional resources related to this Data Nugget:

  • A news article discussing declining monarch populations and the causes that might be contributing to this trend.

Salty sediments? What bacteria have to say about chloride pollution

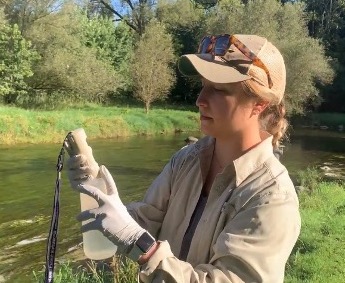
Lexi taking water quality measurements at Cedar Creek in Cedarburg, WI.

The activities are as follows:

In snowy climates, salt is applied to roads to help keep them safe during the winter. Over time, salt – in the form of chloride – accumulates in snowbanks. Once temperatures begin to warm in the spring, the snow melts and carries chloride to freshwater lakes, streams, and rivers. This runoff can quickly increase the salt concentration in a body of water. 

In large amounts, salt in the water is harmful to aquatic organisms like fish, frogs, and invertebrates. However, there are some species that thrive with lots of salt. Salt-loving bacteria, also known as halophiles, grow in extreme salty environments, like the ocean. Unlike other bacteria and organisms that cannot tolerate high salinity, halophiles use the salt in the environment for their day-to-day cellular activities. 

Lexi is a freshwater scientist who is interested in learning more about how ecosystems respond to this seasonal surge of chloride in road salts. She thought that there may be enough chloride from the road salt after snowmelt to change the bacteria community living in the sediment. More salt would support halophiles and likely harm the species that cannot tolerate a lot of salt. 

By taking a water sample and measuring the chloride concentration, we can see a snapshot in time of how toxic the levels are to organisms. However, the types of bacteria in sediments take a while to change. Halophiles may be able to tell us a long-term story of how aquatic organisms respond to chloride pollution. Lexi’s main goal is to use the presence of halophiles as a measure of how much chloride has impacted the health and water quality of river or stream ecosystems. This biological tool could also help cities identify areas that may be getting salted beyond what is necessary to keep roads safe.

Lexi expected that there would be few, or maybe no, halophiles in rural areas where there are not many roads. She also thought halophiles would be widespread in urban environments where there are many roads. Because salt impacts the streams year after year, she expected that halophiles would become permanent members of the microbial community and increase in winter and spring. Therefore, she also wanted to track whether halophiles remain in the sediment throughout the year, increasing in numbers when salt levels become high. 

She began to sample sediments from two different rivers in Southeastern Wisconsin. The urban Kinnickinnic River site is in Milwaukee, WI, and the Menomonee River site is in a rural environment outside of the city. She selected these sites because they offer a good comparison. Because there are more roads, and thus saltier snowmelt, the Kinnickinnic site in the city should have higher chloride concentrations than the Menomonee site. 

When visiting her sites throughout the year, Lexi collected multiple water and sediment samples. Every time she visited, she also recorded important water quality characteristics such as pH, conductivity, and temperature of the water. She then brought the samples to the laboratory and analyzed each for its chloride concentration. To measure the quantity of halophiles in the sediment, Lexi used a process where the sediment is shaken in water to separate the bacteria from the sediment and suspend them in the water. Samples from the water were then plated on a growth medium that contained a very high salt concentration. Because the growth medium was so salty, Lexi knew that if bacteria colonies grew on the plate, they would most likely be halophiles because most bacteria do not thrive in salty environments. Lexi counted the number of bacteria colonies that grew on the plates for each sample she had collected.

Featured scientist: Lexi Passante from the University of Wisconsin-Milwaukee

Flesch–Kincaid Reading Grade Level = 12.0

Some videos about Lexi and her research:

Additional teacher resources related to this Data Nugget:

Mowing for monarchs, Part I

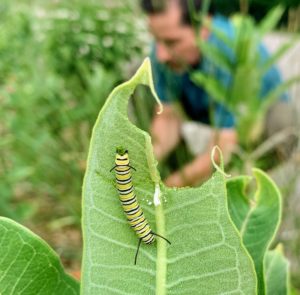
A monarch caterpillar on a milkweed leaf.

The activities are as follows:

With their orange wings outlined with black lines and white dots, monarch butterflies are one of the most recognizable insects in North America. They are known for their seasonal migration when millions of monarch butterflies migrate from the United States and Canada south to Mexico in the fall. Then, in the spring the monarch butterflies migrate back north. Monarch butterflies are pollinators, which means they get their food from the pollen and nectar of flowering plants that they visit. The milkweed plant is one of the most important flowering plants that monarch butterflies depend on.

During the spring and summer months female butterflies will lay their eggs on milkweed plants. Milkweed plays an important role in the monarch butterfly’s life cycle. It is the only plant that monarchs will lay their eggs on. Caterpillars hatch from the butterfly eggs and eat the leaves of the milkweed plant. The milkweed is the only food that monarch caterpillars will eat until they become butterflies.

A problem facing many pollinators, including monarch butterflies, is that their numbers have been going down for several years. Scientists are concerned that we will lose pollinators to extinction if we don’t find solutions to this problem. Doug and Nate are scientists at Michigan State University trying to figure out ways to increase the number of monarch butterflies. They think that they found something that might work. Doug and Nate have learned that if you cut old milkweed plants at certain times of the year, then younger milkweed plants will quickly grow in their place. These new milkweed plants are softer and more tender than the old plants. It appears that monarch butterflies prefer to lay their eggs on the younger plants. It also seems that the monarch caterpillars prefer to eat the younger plants.

Britney and Gabe are two elementary teachers interested in monarch butterfly conservation. They learned about Doug and Nate’s research and wanted to participate in their experiment. The team of four met and designed an experiment that Britney and Gabe could do in open meadows throughout their community.

Britney and Gabe chose ten locations for their experiment. In each location they set aside a milkweed patch that was left alone, which they called the control.  At the same location they set aside another milkweed patch where they mowed the milkweed plants down. After a while, milkweed plants would grow back in the mowed patches. This means they had control patches with old milkweed plants, and treatment patches with young milkweed plants. Gabe and Britney made weekly observations of all the milkweed patches at each location. They recorded the number of monarch eggs in each of the patches. By the end of the summer, they had made 1,693 observations!

Featured scientists: Doug Landis and Nate Haan from Michigan State University and Britney Christensen and Gabe Knowles from Kellogg Biological Station LTER.

Flesch–Kincaid Reading Grade Level = 8.2

Additional resources related to this Data Nugget:

  • This research is part of the ReGrow Milkweed citizen science project. To learn more, visit their website or follow them on Twitter at @ReGrowMilkweed.
  • Britney, one of the scientists in this study, wrote a blog post about her experience in the NSF LTER RET Program (National Science Foundation’s Research Experience for Teachers) working with Doug Landis.
  • Learn about how this group of scientists responded to the COVID-19 pandemic to pivot to a virtual citizen science program in this blog post.
  • A news article discussing declining monarch populations and the causes that might be contributing to this trend.

Trees and bushes, home sweet home for warblers

Matt, Sarah, and Hankyu – a team of scientists at Andrews Forest, measuring bird populations.

The activities are as follows:

The birds at a beach are very different from those in the forest. This is because each bird species has their own set of needs that allows them to thrive where they live. Habitats must have the right collection of food to eat, places to shelter and raise young, safety from predators, and the right environmental conditions like temperature and moisture. 

The vast coniferous forests of the Pacific Northwest provide rich and diverse habitat types for birds. These forests are also a large source of timber, meaning they are economically valuable for people. Disturbances from logging and natural events result in a forest that has many different habitat types for birds to choose from. In general, areas of forest that have been harvested more recently will have more understory, such as shrubs and short trees. Old-growth forests usually have higher plant diversity and larger trees. They are also more likely to have downed trees or standing dead trees, which are important for some bird species. Other disturbances like wildfire, wind, large snow events, and forest disease also have large impacts on bird habitat.

At the Andrews Forest Long-Term Ecological Research site in the Cascade Mountains of Oregon, scientists have spent decades studying how the plants, animals, land use, and climate are all connected. In the past, Andrews Forest had experiments manipulating timber harvesting and forest re-growth. This land use history has large impacts on the habitats found in an area. Many teams of scientists work in this forest, each with their own area of research. Piece by piece, like assembling a puzzle, they combine their data to try to understand the whole ecosystem. 

Collecting data on a warbler.

Matt, Sarah, and Hankyu have been collecting long-term data on the number, type, and location of birds in Andrews Forest since 2009. Early each morning, starting in May and continuing until late June, teams of trained scientists hike along transects that go through different forest types. Transects are parallel lines along which data are collected. At specific points along the transect, the team would stop and listen for bird songs and calls for 10 minutes. There are 184 survey locations, and they are visited multiple times each year.

At each sampling point, Matt, Sarah, and Hankyu carefully recorded a count for each bird species that they hear within 100 meters. They then averaged these data for each location along the transect to get an average number for the year. The scientists were also interested in the habitats along the transect, which includes the amount of understory plants and tall trees, two forest characteristics that are very important to birds. They measured the percent cover of understory vegetation, which shows how many bushes and small plants were around. They also measured the size of trees in the area, called basal area. 

Using these data, the research team is looking for patterns that will help them identify which habitat conditions are best for different bird species. With a better understanding of where bird species are successful, they can predict how changes in the forest could affect the number and types of birds living in Andrews Forest and nearby.  

Wilson’s Warblers and Hermit Warblers are two of the many songbirds that these scientists have recorded at Andrews Forests. Wilson’s Warblers are small songbirds that make their nests in the understory of the forests. Therefore, the team predicted that they would see more of Wilson’s Warblers in forest areas with more understory than in forest areas with less understory. Hermit Warblers, on the other hand, build nests in dense foliage of tall coniferous trees and search for spiders and insects in those coniferous trees. The team predicted that the Hermit Warblers would be observed more often in forest plots where there are larger trees.  

Featured scientists: Hankyu Kim, Matt Betts, and Sarah Frey from Oregon State University. Written with Eric Beck from Realms Middle School and Kari O’Connell from Oregon State University.

Flesch–Kincaid Reading Grade Level = 10.5

Additional teacher resource related to this Data Nugget:

Mangroves on the move

mangrove in marsh
A black mangrove growing in the saltmarshes of northern Florida.

The activities are as follows:

All plants need nutrients to grow. Sometimes one nutrient is less abundant than others in a particular environment. This is called a limiting nutrient. If the limiting nutrient is given to the plant, the plant will grow in response. For example, if there is plenty of phosphorus, but very little nitrogen, then adding more phosphorus won’t help plants grow, but adding more nitrogen will. 

Saltmarshes are a common habitat along marine coastlines in North America. Saltmarsh plants get nutrients from both the soil and the seawater that comes in with the tides. In these areas, fertilizers from farms and lawns often end up in the water, adding lots of nutrients that become available to coastal plants. These fertilizers may contain the limiting nutrients that plants need, helping them grow faster and more densely.

One day while Candy, a scientist, was out in a saltmarsh in northern Florida, she noticed something that shouldn’t be there. There was a plant out of place. Normally, saltmarshes in that area are full of grasses and other small plants—there are no trees or woody shrubs. But the plant that Candy noticed was a mangrove. Mangroves are woody plants that can live in saltwater, but are usually only found in tropical places that are very warm. Candy thought the closest mangrove was miles away in the warmer southern parts of Florida. What was this little shrub doing so far from home? The more that Candy and her colleague Emily looked, the more mangroves they found in places they had not been before.

Candy and Emily wondered why mangroves were starting to pop up in northern Florida. Previous research has shown nitrogen and phosphorus are often the limiting nutrients in saltmarshes. They thought that fertilizers being washed into the ocean have made nitrogen or phosphorus available for mangroves, allowing them to grow in that area for the first time. So, Candy and Emily designed an experiment to figure out which nutrient was limiting for saltmarsh plants. 

mangrove saltmarsh researchers
Candy (right) and Emily (left) measure the height of a black mangrove growing in the saltmarsh.

For their study, Candy and Emily chose to focus on black mangroves and saltwort plants. These two species are often found growing together, and mangroves have to compete with saltwort. Candy and Emily found a saltmarsh near St. Augustine, Florida, in which they could set up an experiment. They set up 12 plots that contained both black mangrove and saltwort. Each plot had one mangrove plant and multiple smaller saltwort plants. That way, when they added nutrients to the plots they could compare the responses of mangroves with the responses of saltwort. 

To each of the 12 plots they applied one of three conditions: control (no extra nutrients), nitrogen added, and phosphorus added. They dug two holes in each plot and added the nutrients using fertilizers, which slowly released into the nearby soil. In the case of control plots, they dug the holes but put the soil back without adding fertilizer.

Candy and Emily repeated this process every winter for four years. At the end of four years, they measured plant height and percent cover for the two species. Percent (%) cover is a way of measuring how densely a plant grows, and is the percentage of a given area that a plant takes up when viewed from above. Candy and Emily measured percent cover in 1×1 meter plots. The cover for each species could vary from 0 to 100%.

Featured scientists: Candy Feller from the Smithsonian Environmental Research Center and Emily Dangremond from Roosevelt University

Flesch–Kincaid Reading Grade Level = 8.3

The carbon stored in mangrove soils

Tall mangroves growing close to the coast.

The activities are as follows:

In the tropics and subtropics, mangroves dominate the coast. There are many different species of mangroves, but they are all share a unique characteristic compared to other trees – they can tolerate having their roots submerged in salt water.

Mangroves are globally important for many reasons. They form dense forested wetlands that protect the coast from erosion and provide critical habitat for many animals. Mangrove forests also help in the fight against climate change. Carbon dioxide is a greenhouse gas that is a main driver of climate change. During photosynthesis, carbon dioxide is absorbed from the atmosphere by the plants in a mangrove forest. When plants die in mangrove forests, decomposition is very slow. The soils are saturated with saltwater and have very little oxygen, which decomposers need to break down plants. Because of this, carbon is stored in the soils for a long time, keeping it out of the atmosphere.

Sean is a scientist studying coastal mangroves in the Florida Everglades. Doing research in the Everglades was a dream opportunity for Sean. He had long been fascinated by the unique plant and animal life in the largest subtropical wetland ecosystem in North America. Mangroves are especially exciting to Sean because they combine marine biology and trees, two of his favorite things! Sean had previously studied freshwater forested wetlands in Virginia, but had always wanted to spend time studying the salty mangrove forests that exist in the Everglades. 

Sean Charles taking soil samples amongst inland short mangroves.

Sean arrived in the Everglades with the goal to learn more about the factors important for mangrove forests’ ability to hold carbon in their soils. Upon his arrival, he noticed a very interesting pattern – the trees were much taller along the coast compared to inland. This is because mangroves that grow close to the coast have access to important nutrients found in ocean waters, like phosphorus. These nutrients allow the trees to grow large and fast. However, living closer to the coast also puts trees at a higher risk of damage from storms, and can lead to soils and dead plants being swept out to sea. 

Sean thought that the combination of these two conditions would influence how much carbon is stored in mangrove soils along the coast and inland. Larger trees are generally more productive than smaller ones, meaning they might contribute more plant material to soils. This led Sean to two possible predictions. The first was that there might be more carbon in soils along the coast because taller mangroves would add more carbon to the soil compared to shorter inland mangroves. However, Sean thought he might also find the opposite pattern because the mangroves along the coast have more disturbance from storms that could release carbon from the soils. 

To test these competing hypothesis, the team of scientists set out into the Everglades in the Biscayne National Park in Homestead, Florida. Their mission was to collect surface soils and measure mangrove tree height. To collect soils, they used soil cores, which are modified cylinders that can be hammered into the soil and then removed with the soil stuck in the tube. Tree height was measured using a clinometer, which is a tool that uses geometry to estimate tree height. They took these measurements along three transects. The first transect was along the coast where trees had an average height of 20 meters. The second transect between the coast and inland wetlands where trees were 10 meters tall, on average. The final transect was inland, with average tree height of only 1 meter tall.  With this experimental design Sean could compare transects at three distances from the coast to look for trends. 

Once Sean was back in the lab, he quantified how much carbon was in the soil samples from each transect by heating the soil in a furnace at 500 degrees Celsius. Heating soils to this temperature causes all organic matter, which has carbon, to combust. Sean measured the weight of the samples before and after the combustion. The difference in weight can be used to calculate how much organic material combusted during the process, which can be used as an estimate of the carbon that was stored in the soil. 

Featured scientist: Sean Charles from Florida International University

Flesch–Kincaid Reading Grade Level = 9.6

Additional teacher resources related to this Data Nugget: