Are forests helping in the fight against climate change?

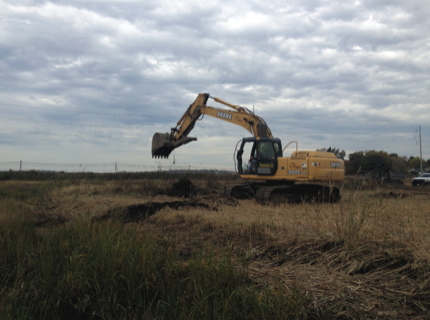
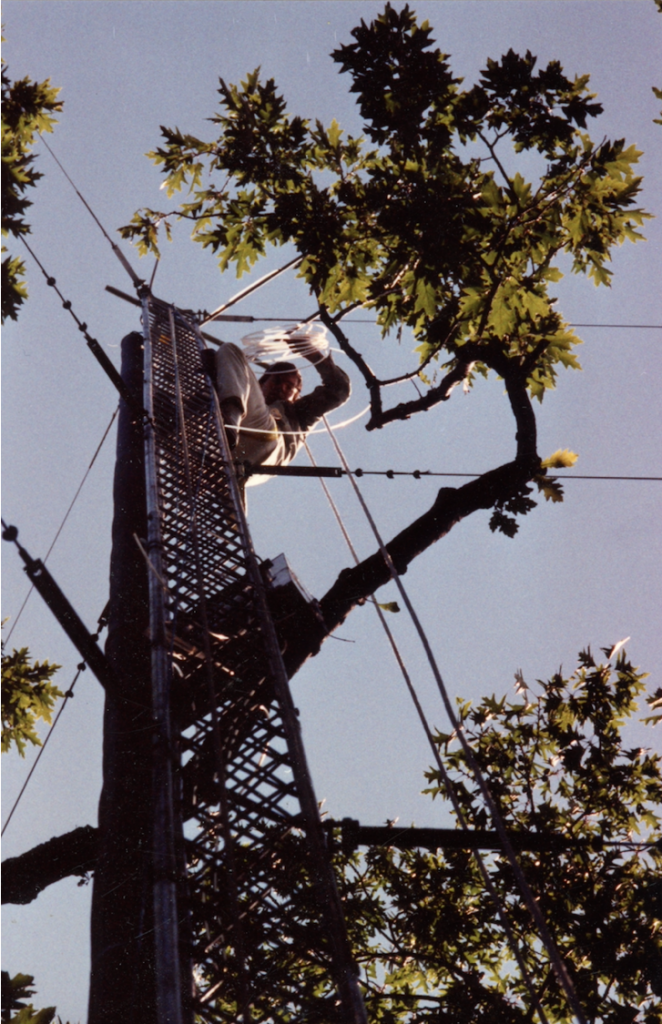
Bill setting up a large metal tower in Harvard Forest in 1989, used to measure long-term CO2 exchange.

The activities are as follows:

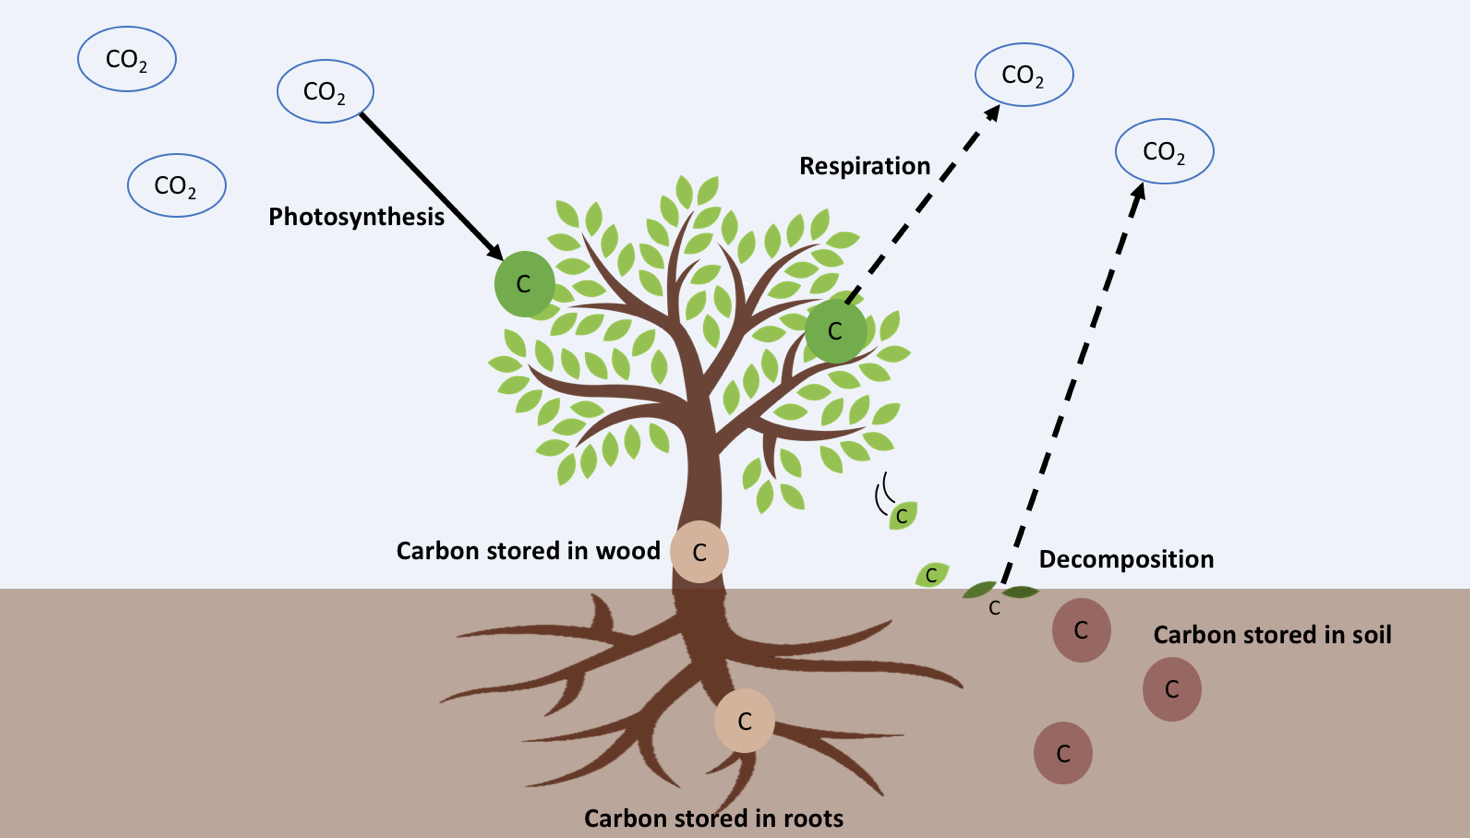
As humans drive cars and use electricity, we release carbon in the form of carbon dioxide (CO2) into the air. Because COhelps to trap heat near the surface of the earth, it is known as a greenhouse gas and contributes to climate change. However, carbon is also an important piece of natural ecosystems, because all living organisms contain carbon. For example, when plants photosynthesize, they take COfrom the air and turn it into other forms of carbon: sugars for food and structural compounds to build their stems, roots, and leaves. When the carbon in a living tree’s trunk, roots, leaves, and branches stays there for a long time, the carbon is kept out of the air. This carbon storage helps reduce the amount of COin the atmosphere. However, not all of the COthat trees take from the air during photosynthesis remains as part of the tree. Some of that carbon returns to the air during a process called respiration.

Another important part of the forest carbon cycle happens when trees drop their leaves and branches or die. The carbon that the tree has stored breaks down in a process called decomposition. Some of the stored carbon returns to the air as CO2, but the rest of the carbon in those dead leaves and branches builds up on the forest floor, slowly becoming soil. Once carbon is stored in soil, it stays there for a long time. We can think of forests as a balancing act between carbon building up in trees and soil, and carbon released to the air by decomposition and respiration. When a forest is building up more carbon than it is releasing, we call that area a carbon sink, because overall more COis “sinking” into the forest and staying there. On the other hand, when more carbon is being released by the forest through decomposition and respiration, that area is a carbon source, because the forest is adding more carbon back into the atmosphere than it is taking in through photosynthesis.

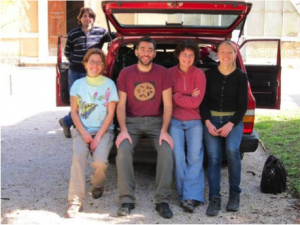
In the 1990s, scientists began to wonder what role forests were having in this exchange of carbon in and out of the atmosphere. Were forests overall storing carbon (carbon sink), or releasing it (carbon source)? Bill is one of the scientists who decided to explore this question. Bill works at the Harvard Forest in central Massachusetts, a Long-Term Ecological Research site that specializes in setting up big experiments to learn how the environment works. Bill and his team of scientists realized they could measure the COcoming into and out of an entire forest. They built large metal towers that stand taller than the forest trees around them and use sensors to measure the speed, direction, and COconcentration of each puff of air that passes by. Bill compares the COin the air coming from the forest to the ones moving down into the forest from the atmosphere. With the COdata from both directions, Bill calculates the Net Ecosystem Exchange (or NEE for short). When more carbon is moving into the forest than out, NEE is a negative number because COis being taken out of the air. This often happens during the summer when trees are getting a lot of light and are therefore photosynthesizing. When more COis leaving the forest, it means that decomposition and respiration are greater than photosynthesis and the NEE is a positive number. This typically happens at night and in the winter, when trees aren’t photosynthesizing but respiration and decomposition still occur. By adding up the NEE of each hour over a whole year, Bill finds the total amount of COthe forest is adding or removing from the atmosphere that year.

Bill and his team were very interested in understanding NEE because of how important it is to the global carbon cycle, and therefore to climate change. They wanted to know which factors might cause the NEE of a forest to vary. Bill and other scientists collected data on carbon entering and leaving Harvard Forest for many years to see if they could find any patterns in NEE over time. By looking at how the NEE changes over time, predictions can be made about the future: are forests taking up more COthan they release? Will they continue to do so under future climate change?

Featured scientist: Bill Munger from Harvard University. Written by: Fiona Jevon.

Flesch–Kincaid Reading Grade Level = 10.5

Additional teacher resource related to this Data Nugget:

  • There are several publications based on the data from the Harvard Forest LTER. Citations below:
    • Wofsy, S.C., Goulden, M.L., Munger, J.W., Fan, S.M., Bakwin, P.S., Daube, B.C., Bassow, S.L. and Bazzaz, F.A., 1993. Net exchange of CO2 in a mid-latitude forest. Science260(5112), pp.1314-1317.
    • Goulden, M.L., Munger, J.W., Fan, S.M., Daube, B.C. and Wofsy, S.C., 1996. Exchange of carbon dioxide by a deciduous forest: response to interannual climate variability. Science271(5255), pp.1576-1578.
    • Barford, C.C., Wofsy, S.C., Goulden, M.L., Munger, J.W., Pyle, E.H., Urbanski, S.P., Hutyra, L., Saleska, S.R., Fitzjarrald, D. and Moore, K., 2001. Factors controlling long-and short-term sequestration of atmospheric CO2 in a mid-latitude forest. Science294(5547), pp.1688-1691.
    • Urbanski, S., Barford, C., Wofsy, S., Kucharik, C., Pyle, E., Budney, J., McKain, K., Fitzjarrald, D., Czikowsky, M. and Munger, J.W., 2007. Factors controlling CO2 exchange on timescales from hourly to decadal at Harvard Forest. Journal of Geophysical Research: Biogeosciences112(G2).
    • Wehr, R., Munger, J.W., McManus, J.B., Nelson, D.D., Zahniser, M.S., Davidson, E.A., Wofsy, S.C. and Saleska, S.R., 2016. Seasonality of temperate forest photosynthesis and daytime respiration. Nature534(7609), p.680.
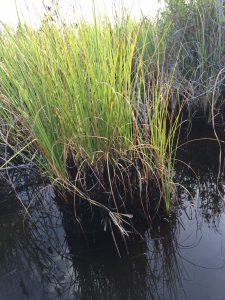
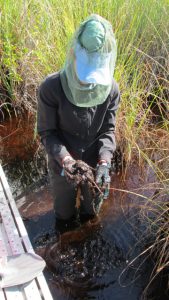
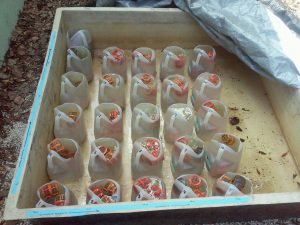
  • Our Changing Forests Schoolyard Ecology project – Do your students want to get involved with research monitoring carbon cycles in forests? Check out this hands-on field investigation, led by a team of Ecologists at Harvard Forest. Students can contribute to this study by monitoring a 20 meter by 20 meter plot in a wooded area near their schools.
  • Video showcasing 30 years of research at the Harvard Forest LTER
  • A cool article about the diversity of research being done at Harvard Forest – Researchers blown away by hurricane simulation
  • Additional images from Harvard Forest, diagrams of NEE, and a vocabulary list can be found in this PowerPoint.

The case of the collapsing soil

An area in the Florida Everglades where strange soil collapse has been observed.

The activities are as follows:

As winds blow through the large expanses of grass in the Florida Everglades, it looks like flowing water. This “river of grass” is home to a wide diversity of plants and animals, including both the American Alligator and the American Crocodile. The Everglades ecosystem is the largest sub-tropical wetland in North America. One third of Floridians rely on the Everglades for water. Unfortunately, this iconic wetland is threatened by rising sea levels caused by climate change. Sea level rise is caused by higher global temperatures leading to thermal expansion of water, land-ice melt, and changes in ocean currents.

With rising seas, one important feature of the Florida Everglades may change. There are currently large amounts of carbon stored in the wetland’s muddy soils. By holding carbon in the mud, coastal wetlands are able to help in the fight against climate change. However, under stressful conditions like being submersed in sea water, soil microbes increase respiration. During respiration, carbon stored in the soil is released as carbon dioxide (CO2), a greenhouse gas. As sea level rises, soil microbes are predicted to release stored carbon and contribute to the greenhouse effect, making climate change worse.

Shelby collecting soil samples from areas where the soil has collapsed in the Everglades.

Shelby and John are ecologists who work in southern Florida. John became fascinated with the Everglades during his first visit 10 years ago and has been studying this unique ecosystem ever since. Shelby is interested in learning how climate change will affect the environment, and the Everglades is a great place to start! They are both very concerned with protecting the Everglades and other wetlands. Recently when John, Shelby, and their fellow scientists were out working in the Everglades they noticed something very strange. It looked like areas of the wetland were collapsing! What could be the cause of this strange event?

John and Shelby thought it might have something to do loss of carbon due to sea level rise. They wanted to test whether the collapsing soils were the result of increased microbial respiration, leading to loss of carbon from the soil, due to stressful conditions from sea level rise. They set out to test two particular aspects of sea water that might be stressful to microbes – salt and phosphorus.

Phosphorus is found in sea water and is a nutrient essential for life. However, too much phosphorus can lead to over enriched soils and change the way that microbes use carbon. Sea water also contains salt, which can stress soil microbes and kill plants when there is too much. Previous research has shown that both salt and phosphorus exposure on their own increase respiration rates of soil microbes.

A photo of the experimental setup. Each container has a different level of salt and phosphorus concentration.

To test their hypotheses, a team of ecologists in John’s lab developed an experiment using soils from the Everglades. They collected soil from areas where the soil had collapsed and brought it into the lab. These soils had the microbes from the Everglades in them. Once in the lab, they put their soil and microbes into small vials and exposed them to 5 different concentrations of salt, and 5 different concentrations of phosphorus. The experiment crossed each level of the two treatments. This means they had soil in every possible combination of treatments – some with high salt and low phosphorus, some in low salt and high phosphorus, and so on. Their experiment ran for 5 weeks. At the end of the 5 weeks they measured the amount of COreleased from the soils.

Featured scientists: John Kominoski and Shelby Servais from Florida International University. Written by Shelby, John, and Teresa Casal.

Flesch–Kincaid Reading Grade Level = 9.2

SaveSave

SaveSave

SaveSave

SaveSave

SaveSave

SaveSave

SaveSave

SaveSave

SaveSave

SaveSave

Marsh makeover

A saltmarsh near Boston, MA being restored after it was degraded by human activity.

The activities are as follows:

Salt marshes are diverse and productive ecosystems, and are found where the land meets the sea. They contain very unique plant species that are able to tolerate flooding during high tide and greater salt levels found in seawater. Healthy salt marshes are filled with many species of native grasses. These grasses provide food and nesting grounds for lots of important animals. They also help remove pollution from the land before it reaches the sea. The grass roots protect the shoreline from erosion during powerful storms. Sadly today, humans have disturbed most of the salt marshes around the world. As salt marshes are disturbed, native plant biodiversity, and the services that marshes provide to us, are lost.

A very important role of salt marshes is that they are able to store carbon, and the amount they store is called their carbon storage capacity. Carbon is stored in marshes in the form of both dead and living plant tissue, called biomass. Marsh grasses photosynthesize, taking carbon dioxide out of the atmosphere and storing it in plant biomass. This biomass then falls into the mud and the carbon is stored there for a very long time. Salt marshes have waterlogged muddy soils that are low in oxygen. Because of the lack of oxygen, decomposition of dead plant tissue is much slower than it is in land habitats where oxygen is plentiful. All of this stored carbon can help lower the levels of carbon dioxide in our atmosphere. This means that healthy and diverse salt marshes are very important to help fight climate change.

However, as humans change the health of salt marshes, we may also change the amount of carbon being stored. As humans disturb marshes, they may lower the biodiversity and fewer plant species can grow in the area. The less plant species growing in the marsh, the less biomass there will be. Without biomass falling into the mud and getting trapped where there is little oxygen, the carbon storage capacity of disturbed marshes may go down.

Jennifer, working alongside students, to collect biomass data for a restored saltmarsh.

It is because of the important role that marshes play in climate change that Jennifer, and her students, spend a lot of time getting muddy in saltmarshes. Jennifer wants to know more about the carbon storage capacity of healthy marshes, and also those that have been disturbed by human activity. She also wants to know whether it is possible to restore degraded salt marshes to help improve their carbon storage capacity. Much of her work focuses on comparing how degraded and newly restored marshes to healthy marshes. By looking at the differences and similarities, she can document the ways that restoration can help increase carbon storage. Since Jennifer and her students work in urban areas with a lot of development along the coast, there are lots of degraded marshes that can be restored. If she can show how important restoring marshes is for increasing plant diversity and helping to combat climate change, then hopefully people in the area will spend more money and effort on marsh restoration.

Jennifer predicted that: 1) healthy marshes will have a higher diversity of native vegetation and greater biomass than degraded salt marshes, 2) restored marshes will have a lower or intermediate level of biomass depending on how long it has been since the marsh was restored, and 3) newly restored marshes will have lower biomass, while marshes that were restored further in the past will have higher biomass.

To test her predictions, Jennifer studied two different salt marshes near Boston, Massachusetts, called Oak Island and Neponset. Within each marsh she sampled several sites that had different restoration histories. She also included some degraded sites that had never been restored for a comparison. Jen measured the total number of different plant species and plant biomass at multiple locations across all study sites. These measurements would give Jen an idea of how much carbon was being stored at each of the sites.

Featured scientist: Jennifer Bowen from Northeastern University

Flesch–Kincaid Reading Grade Level = 11.0

Winter is coming! Can you handle the freeze?

Doug, and two members of his team, setting up the reciprocal transplant experiment in Scandinavia.

Doug with the reciprocal transplant experiment in Scandinavia.

The activities are as follows:

Doug is a biologist who studies plants from around the world. He often jokes that he chose to work with plants because he likes to take it easy. While animals rarely stay in the same place and are hard to catch, plants stay put and are always growing exactly where you planted them! Using plants allows Doug to do some pretty cool and challenging experiments. Doug and his research team carry out experiments with the plant species Mouse-ear Cress, or Arabidopsis thaliana. They like this species because it is easy to grow in both the lab and field. Arabidopsis is very small and lives for just one year. It grows across most of the globe across a wide range of latitudes and climates. Arabidopsis is also able to pollinate itself and produce many seeds, making it possible for researchers to grow many individuals to use in their experiments.

Doug, and two members of his team, setting up the reciprocal transplant experiment in Scandinavia.

Doug, and two members of his team, setting up the reciprocal transplant experiment in Scandinavia.

Part I: Doug wanted to study how Arabidopsis is able to survive in such a range of climates. Depending on where they live, each population faces its own challenges. For example, there are some populations of this species growing in very cold habitats, and some populations growing in very warm habitats. He thought that each of these populations would adapt to their local environments. An Arabidopsis population growing in cold temperatures for many generations may evolve traits that increase survival and reproduction in cold temperatures. However, a population that lives in warm temperatures would not normally be exposed to cold temperatures, so the plants from that population would not be able to adapt to cold temperatures. The idea that populations of the same species have evolved as a result of certain aspects of their environment is called local adaptation.

To test whether Arabidopsis is locally adapted to its environment, Doug established a reciprocal transplant experiment. In this type of experiment, scientists collect seeds from plants in two different locations and then plant them back into the same location (home) and the other location (away). For example, seeds from population A would be planted back into location A (home), but also planted into location B (away). Seeds from population B would be planted back into location B (home), but also planted at location A (away). If populations A and B are locally adapted, this means that A will survive better than B in location A, and B will survive better than A in location B. Because each population would be adapted to the conditions from their original location, they would outperform the plants from away when they are at home (“home team advantage”).

In this experiment, Doug collected many seeds from warm Mediterranean locations at low latitudes, and cold Scandinavian locations at high latitudes. He used these seeds to grow thousands of seedlings. Once these young plants were big enough, they were planted into a reciprocal transplant experiment. Seedlings from the Mediterranean location were planted alongside Scandinavian seedlings in a field plot in Scandinavia. Similarly, seedlings from the Scandinavian locations were planted alongside Mediterranean seedlings in a field plot in the Mediterranean. By planting both Mediterranean and Scandinavian seedlings in each field plot, Doug can compare the relative survival of each population in each location. Doug made two local adaptation predictions:

  1. Scandinavian seedlings would survive better than Mediterranean seedlings at the Scandinavian field plot.
  2. Mediterranean seedlings would survive better than Scandinavian seedlings planted at the Mediterranean field plot.
Doug's team in the Mediterranean prepped and ready to set up the experiment.

Doug’s team in the Mediterranean prepped and ready to set up the experiment.

Part II: The data from Doug’s reciprocal transplant experiment show that the Arabidopsis populations are locally adapted to their home locations. Now that Doug confirmed that populations were locally adapted, he wanted to know how it happened. What is different about the two habitats? What traits of Arabidopsis are different between these two populations? Doug now wanted to figure out the mechanism causing the patterns he observed.

Doug originally chose Arabidopsis populations in Scandinavia and the Mediterranean for his research on local adaptation because those two locations have very different climates. The populations may have adapted to have the highest survival and reproduction based on the climate of their home location. To deal with sudden freezes and cold winters in Scandinavia, plants may have adaptations to help them cope. Some plants are able to protect themselves from freezing temperatures by producing chemicals that act like antifreeze. These chemicals accumulate in their tissues to keep the water from turning into ice and forming crystals. Doug thought that the Scandinavian population might have evolved traits that would allow the plants to survive the colder conditions. However, the plants from the Mediterranean aren’t normally exposed to cold temperatures, so they wouldn’t have necessarily evolved freeze tolerance traits.

To see whether freeze tolerance was driving local adaptation, he set up an experiment to identify which plants survived after freezing. Doug again collected seeds from several different populations across Scandinavia and across the Mediterranean. He chose locations that had different latitudes because latitude affects how cold an area gets over the year. High latitudes (closer to the poles) are generally colder and low latitudes (closer to the equator) are generally warmer. Doug grew more seedlings for this experiment, and then, when they were a few days old, he put them in a freezer. Doug counted how many seedlings froze to death, and how many survived, and he used these numbers to calculate the percent survival for each population. To gain confidence in his results, he did this experiment with three replicate genotypes per population.

Doug predicted that if freeze tolerance was a trait driving local adaptation, the seedlings originally from colder latitudes (Scandinavia) would have increased survival after the freeze. Seedlings originally from lower latitudes would have decreased survival after the freeze because the populations would not have evolved tolerance to such cold temperatures.

Featured scientist: Doug Schemske from Michigan State University (MSU). Written by Christopher Oakley from MSU and Purdue University, and Marty Buehler (RET) from Hastings High School.

Flesch–Kincaid Reading Grade Level = 12.0

There is one scientific paper associated with the data in this Data Nugget. The citation and PDF of the paper is below.

Agren, J. and D.W. Schemske (2012). Reciprocal transplants demonstrate strong adaptive differentiation of the model organism Arabidopsis thaliana in its native range. New Phytologist 194:1112–1122.

Keeping up with the sea level

A view of salt marsh hay (Spartina patens) growing in a marsh

A view of salt marsh hay (Spartina patens) growing in a marsh

The activities are as follows:

Salt marshes are ecosystems that occur along much of the coast of New England in the United States. Salt marshes are very important – they serve as habitat for many species, are a safer breeding location for many fish, absorb nutrients from fertilizer and sewage coming from land and prevent them from entering the ocean, and protect the coast from erosion during storms.

Unfortunately, rising sea levels are threatening these important ecosystems. Sea level is the elevation of the ocean water surface compared to the elevation of the soil surface. Two processes are causing sea levels to rise. First, as our world gets warmer, ocean waters are getting warmer too. When water warms, it also expands. This expansion causes ocean water to take up more space and it will continue to creep higher and higher onto the surrounding coastal land. Second, freshwater frozen in ice on land, such as glaciers in Antarctica, is now melting and running into the oceans. Along the New England coast, sea levels have risen by 0.26 cm a year for the last 80 years, and by 0.4 cm a year for the last 20 years. Because marshes are such important habitats, scientists want to know whether they can keep up with sea level rise.

Researcher Sam Bond taking Sediment Elevation Table (SET) measurements in the marsh

Researcher Sam Bond taking Sediment Elevation Table (SET) measurements in the marsh

When exploring the marsh, Anne, a scientist at the Plum Island Ecosystems Long Term Ecological Research site, noticed that the salt marsh appeared to be changing over time. One species of plant, salt marsh cordgrass (Spartina alterniflora), appeared to be increasing in some areas. At the same time, some areas with another species of plant, salt marsh hay (Spartina patens), appeared to be dying back. Each of these species of plants is growing in the soil on the marsh floor and needs to keep its leaves above the surface of the water. As sea levels rise, the elevation of the marsh soil must rise as well so the plants have ground high enough to keep them above sea level. Basically, it is like a race between the marsh floor and sea level to see who can stay on top!

Anne and her colleges measured how fast marsh soil elevation was changing near both species of plants. They set up monitoring points in the marsh using a device called the Sediment Elevation Table (SET). SET is a pole set deep in the marsh that does not move or change in elevation. On top of this pole there is an arm with measuring rods that record the height of the marsh surface. The SETs were set up in 2 sites where there is salt marsh cordgrass and 2 sites where there is salt marsh hay. Anne has been taking these measurements for more than a decade. If the marsh surface is rising at the same rate as the sea, perhaps these marshes will continue to do well in the future.

Featured scientist: Anne Giblin from the Marine Biological Laboratory and the Plum Island Ecosystems Long-Term Ecological Research site

Flesch–Kincaid Reading Grade Level = 9.1

Additional resources related to this Data Nugget:

What do trees know about rain?

A cypress pine, or Callitris columellaris. This species is able to survive in Australia’s dry climates.

A cypress pine, or Callitris columellaris. This species is able to survive in Australia’s dry climates.

The activities are as follows:

Did you know that Australia is the driest inhabited continent in the world? Because it is so dry, we need to be able to predict how often and how much rain will fall. Predictions about future droughts help farmers care for their crops, cities plan their water use, and scientists better understand how ecosystems will change. The typical climate of arid northwest Australia consists of long drought periods with a few very wet years sprinkled in. Scientists predict that climate change will cause these cycles to become more extreme – droughts will become longer and periods of rain will become wetter. When variability is the norm, how can scientists tell if the climate is changing and droughts and rain events today are more intense than what we’ve seen in the past?

To make rainfall predictions for the future, scientists need data on past rainfall. However, humans have only recorded rainfall in Australia for the past 100 years. Because climate changes slowly and goes through long-term cycles, scientists need very long term datasets of rainfall.

Scientist Alison coring a cypress pine

Scientist Alison coring a cypress pine

The answer to this challenge comes from trees! Using dendrochronology, the study of tree rings, scientists get a window back in time. Many tree species add a ring to their trunks every year. The width of this ring varies from year to year depending on how much water is available. If it rains a lot in a year, the tree grows relatively fast and ends up with a wide tree ring. If there isn’t much rain in a year, the tree doesn’t grow much and the ring is narrow. We can compare the width of rings from recent years to the known rain data humans have collected. Then, assuming the same forces that determine tree ring width are operating today as in the past, we can go back and interpret how much rain fell in years where we have no recorded rainfall data. This indirect information from tree rings is known as a proxy, and helps us infer data about past climates.

For this study, the scientists used cypress-pine, or Callitris columellaris. This species is able to survive in Australia’s dry climates and is long lived enough to provide data far back in time. Fortunately, scientists don’t have to cut down the trees to see their rings. Instead, they use a corer – a hollow metal drill with the diameter of a straw. They drill it through the tree all the way to its core, and extract a sample of the tissue that shows all the tree rings. The scientists took 40 cores from 27 different cypress-pine trees. The oldest trees in the sample were more than 200 years old. Next, they developed a chronology where they lined up ring widths from one tree with all the other trees, wide with wide and narrow with narrow. This chronology gives them many replicate samples, and data going back all the way to the 19th century! Next, they used a dataset of rainfall from rain gauges that have been set out in Australia since 1910. They then take this precipitation data and overlay it with the tree ring widths since 1910. For tree rings before 1910, they then project back in time using a rainfall formula.

These videos, demonstrating the science of dendrochronology, could be a great way to spark class discussions:

Featured scientist: Alison O’Donnell from University of Western Australia

Flesch–Kincaid Reading Grade Level = 8.0

Earth Science Journal for KidsThis Data Nugget was adapted from a primary literature activity developed by Science Journal For Kids. For a more detailed version of this lesson plan, including a supplemental reading, videos, and extension activities, visit their website and register for free!

There is one scientific paper associated with the data in this Data Nugget. The citation and PDF of the paper is below.

Growth rings from a Callitirs tree.

Growth rings from a Callitirs tree.

Is your salt marsh in the zone?

Scientist James collecting plants in a Massachusetts marsh, part of the Plum Island Ecosystems Long Term Ecological Research site

Scientist James collecting plants in a Massachusetts marsh, part of the Plum Island Ecosystems Long Term Ecological Research site

The activities are as follows:

Tides are the rise and fall of ocean water levels, and happen every day like clockwork. Gravity from the moon and sun drive the tides. There is a high tide and a low tide, and the average height of the tide is called the mean sea level. The mean sea level changes seasonally due to the warming and cooling of the ocean throughout the year. It also changes annually due to a long-term trend of ocean warming and the melting of glaciers. Scientific evidence shows that climate change is causing the sea level to rise faster now than it has in the past. As the climate continues to warm, it is predicted that the sea level will continue to rise.

Salt marshes are wetlands with plains of grass that grow along much of the ocean’s coast worldwide. These marshes are important habitats for many plants and animals, and protect our shores from erosion during storms. They grow between mean sea level and the level of high tide. Marshes flood during high tide and are exposed to the air during low tide. The health of a salt marsh is determined by where it sits relative to the tide (the “zone”). A healthy marsh is flooded only part of the time. Too much flooding and too little flooding are unhealthy. Because they are so important, scientists want to know if salt marshes will keep up with sea level rise caused by climate change.

A picture of James’ “marsh organ” which holds plants at different elevations relative to mean sea level. He gave it that name because it resembles organ pipes!

A picture of James’ “marsh organ” which holds plants at different elevations relative to mean sea level. He gave it that name because it resembles organ pipes!

In the 1980s, scientist James began measuring the growth of marsh grasses. He was surprised to find that there was a long-term trend of increasing grass growth over the years. James wanted to know if grasses could continue to keep up with rising sea levels. If he could experimentally manipulate the height of the grasses, relative to mean sea level, he might be able to figure out how grasses will do when sea levels are higher. To test this, James invented a way to experimentally grow a marsh at different elevations relative to mean sea level. He built a device he called the “marsh organ”. This device is made of tubes that stand at different elevations and are filled with marsh mud and planted with marsh grasses. He measured the growth of the grass in each of the pipes. If grasses will continue to grow taller in the future with higher water levels, then plants growing in pipes at lower elevations should grow more than plants growing in pipes with higher elevations.

Featured scientist: James Morris from the University of South Carolina

Additional teacher resource related to this Data Nugget: Jim has created an interactive salt marsh model called the “marsh equilibrium model”. This online tool allows you to plug in different marsh levels to explore potential impacts to the salt marsh. To explore this tool click here.

To read more about Jim’s research on “tipping points” beyond which sediment accumulation fails to keep up with rising sea level and the marshes drown, click here.

There are two publications related to the data included in this activity:

  • Morris, J.T., Sundberg, K., and Hopkinson, C.S. 2013. Salt marsh primary production and its responses to relative sea level and nutrients in estuaries at Plum Island, Massachusetts, and North Inlet, South Carolina, USA. Oceanography 26:78-84.
  • Morris, J.T., P.V. Sundareshwar, C.T. Nietch, B. Kjerfve, D.R. Cahoon. 2002. Responses of coastal wetlands to rising sea level. Ecology 83:2869-2877.

SaveSave

Invasion meltdown

The invasive plant, Centaurea stoebe

 A flower of the invasive plant, Centaurea stoebe (spotted knapweed).

The activities are as follows:

Humans are changing the earth in many ways. First, by burning fossil fuels and adding greenhouse gasses to the atmosphere we are causing climate change, or the warming of the planet. Scientists have documented rising temperatures across the globe and predict an increase of 3° C in Michigan within the next 100 years. Second, we are also changing the earth by movingspecies across the globe, introducing them into new habitats. Some of these introduced species spread quickly and become invasive. Invasive species harm native species and cost us money. There is also potential that these two changes could affect one another; warmer temperatures from climate change may make invasions by plants and animals even worse.

All living organisms have a range of temperatures they are able to survive in, and temperatures where they perform their best. For example, arctic penguins do best in the cold, while tropical parrots prefer warmer temperatures. The same is true for plants. Depending on the temperature preferences of a plant species, warming temperatures may either help or harm that species.

Katie, Mark, and Jen are scientists concerned that invasive species may do better in the warmer temperatures caused by climate change. There are several reasons they expect that invasive species may benefit from climate change. First, because invasive species have already survived transport from one habitat to another, they may be species that are better able to handle change, like temperature increases. Second, the new habitat of an invasive species may have temperatures that allow it to survive, but are too low for the invasive species to do their absolute best. This could happen if the invasive species was transported from somewhere warm to somewhere cold. Climate change could increase temperatures enough to put the new habitat in the species’range of preferred temperatures, making it ideal for the invasive species to grow and survive.

A view of the plants growing in a heated ring. Notice the purple flowers of Centaurea stoebe.

A view of the plants growing in a heated ring.
Notice the purple flowers of Centaurea stoebe.

To determine if climate change will benefit invasive species, Katie, Mark, and Jen focused on one of the worst invasive plants in Michigan, spotted knapweed. They looked at spotted knapweed plants growing in a field experiment with eight rings. Half of the rings were left with normal, ambient air temperatures. The other half of the rings were heated using ceramic heaters attached to the side of the rings. These heaters raised air temperatures by 3° C to mimic future climate change. At the end of the summer, Mark and Katie collected all of the spotted knapweed from the rings. They recorded both the (1) abundance, or number of spotted knapweed plants within a square meter, and (2) the biomass (dry weight of living material) of spotted knapweed. These two variables taken together are a good measure of performance, or how well spotted knapweed is doing in both treatments.

Featured scientists: Katie McKinley, Mark Hammond, and Jen Lau from Michigan State University

Flesch–Kincaid Reading Grade Level = 10.0

Can a salt marsh recover after restoration?

Students collecting salinity data at a transect point. The tall tan grass is Phragmites.

Students collecting salinity data at a transect point. The tall tan grass is Phragmites.

The activities are as follows:

Éste Data Nugget también está disponible en Español:

In the 1990s, it was clear that the Saratoga Creek salt marsh was in trouble. The invasive plant, Phragmites australis, covered large areas of the marsh. Thick patches of Phragmites crowded out native plants. There were very few animals, especially migrating birds, because the plants grew too densely for them to move around.

Salt marshes are wetland habitats near oceans where water-tolerant salt-loving plants grow. Usually native grasses dominate the marsh, but where humans cause disturbance Phragmites can start to take over. Human disturbance was having a huge effect on the health of Saratoga Creek by changing the water coming into the marsh. Storm drains, built to keep rain water off the roads, were adding more water to the marsh. This runoff, or freshwater and sediments from the surrounding land, made the marsh less salty. The extra sediment made the problem even worse because it raised soil levels along the road. Raised soil means less salty ocean comes into the marsh during high tide.

In 1998, scientists, including members of the Rockport Conservation Commission and students from the Rockport Middle School science club, began to look at the problem. Phragmites grows best when salt levels are low. When salt levels are high, native grasses do better. The scientists thought that the extra fresh water and sediments added by the storm drains into the marsh was the reason Phragmites was taking over.

The scientists wanted to see if a restoration could reverse the Phragmites invasion. In 1999, a ditch was dug along the side the road to catch runoff before it entered the marsh. A layer of sediment was also removed from the marsh, allowing ocean water to reach the marsh during high tide once again. Students set up sampling areas, chosen to observe and record data, called transects. Transects were 25 meters long and students collected data every meter. The transects made it possible to return to the same points in the marsh year after year. Along the transects, students counted the number of Phragmites plants and calculated abundance as the percent of points along the transect where they found Phragmites. They also measured the height of Phragmites as a way to figure out how well it was growing.

The students compared Phragmites data from before 1999 and after 1999 to see if the restoration made a difference. They predicted that the abundance and height of Phragmites would go down after runoff was reduced by the restoration.

Screen Shot 2015-08-18 at 5.05.46 PM

View of Saratoga Creek Salt Marsh several years after restoration, showing location of one of the transects. Native grasses are growing in the foreground.

View of Saratoga Creek Salt Marsh several years after restoration, showing location of one of the transects. Native grasses are growing in the foreground.

Featured scientists: Liz Duff from Mass Audubon, Eric Hutchins from NOAA, and Bob Allia and 7th graders from Rockport Middle School

Written by: Bob Allia, Cindy Richmond, and Dave Young

Flesch–Kincaid Reading Grade Level = 8.9

For more information on this project, including datasets and more scientific background, check out their website: Salt Marsh Science

Invasive reeds in the salt marsh

Culverts run under roads and allow water from the ocean to enter a marsh. Phragmites can be seen growing in the background.

Culverts run under roads and allow water from the ocean to enter a marsh. Phragmites can be seen growing in the background.

The activities are as follows:

Phragmites australis is an invasive reed, a type of grass that grows in water. Phragmites is taking over saltwater marshes in New England, or wetland habitats near the Atlantic Ocean coast. Phragmites does so well it crowds out native plants that once served as food and homes for marsh animals. Once Phragmites has invaded, it is sometimes the only plant species left! Phragmites does best where humans have disturbed a marsh, and scientists were curious why that might be. They thought that perhaps when a marsh is disturbed, the salinity, or amount of salt in the water, changes. Phragmites might be able to survive after disturbances that cause the amount of salt in the water to drop, but becomes stressed when salinity is high.

Students collecting data on the plant species present in the marsh using transects. Every 1m along the tape, students observe which plants are present. Phragmites is the tall grass that can be seen growing behind the students.

Students collecting data on the plant species present in the marsh using transects. Every 1m along the tape, students observe which plants are present. Phragmites is the tall grass that can be seen growing behind the students.

Fresh water in a marsh flows from the upstream source to downstream. Saltwater marshes end at the ocean, where freshwater mixes with salty ocean water. One type of disturbance is when a road is cut through a marsh. Upstream of the road, the marsh is cut off from the salt waters from the ocean, so only fresh water will enter and salinity will drop. Downstream of the road, the marsh is still connected to the ocean and salinity should be unaffected by the disturbance. Often, a culvert (a pipe that runs under the road) is placed to allow salt water to pass from the ocean into the marsh. The amount of ocean water flowing into the marsh is dependent on the diameter of the culvert.

Students at Ipswich High School worked with scientists from the Mass Audubon, a conservation organization, to look at the Phragmites in the marsh. They looked at an area where the salinity in the marsh changed after a road was built. They wanted to know if this change would affect the amount of Phragmites in that marsh. In 1996, permanent posts were placed 25 meters apart in the marsh. That way, scientists could collect data from the same points each year. At these posts, students used transects, a straight line measured from a point to mark where data is collected. Then they collected data on all the plants that were found every meter along the transects. Data has been collected at these same points since 1996. In 2005, an old 30cm diameter culvert was replaced with two 122cm culverts. These wider culverts allow much more salty ocean water to flow under the road and into the marsh. Students predicted that after the culverts were widened, more ocean water would enter the marsh. This would make salinity go up, making it harder for Phragmites to grow, and it would decline in numbers. Students continued to survey the plants found along transects at each permanent post and documented their findings.

Featured scientists: Lori LaFrance from Ipswich High School, Massachusetts and Liz Duff from Mass Audubon. This study was part of the PIE-LTER funded by the NSF.

Flesch–Kincaid Reading Grade Level = 9.0

To access the original data presented in this activity, and collected by students, access Mass Audubon’s Vegetation Data, available online. To access the salinity data related to this activity, and collected by students, access Mass Audubon’s Salinity Data, available online. Scroll down to “Ipswich, MA, Town Farm Road” for data from the site discussed here.

View of the two new culverts.

View of the two new culverts.

The old pipe that was removed.

The old pipe that was removed, and the new culvert.


Arial view of the upstream and downstream research sites.

Arial view of the upstream and downstream research sites.