The carbon stored in mangrove soils

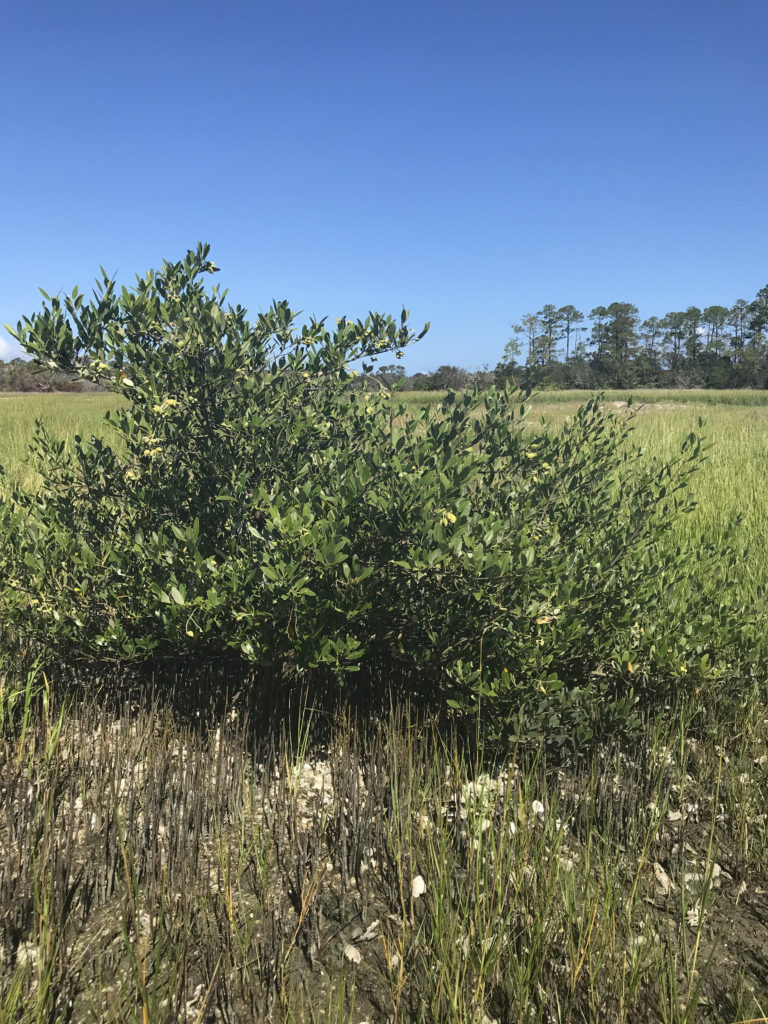
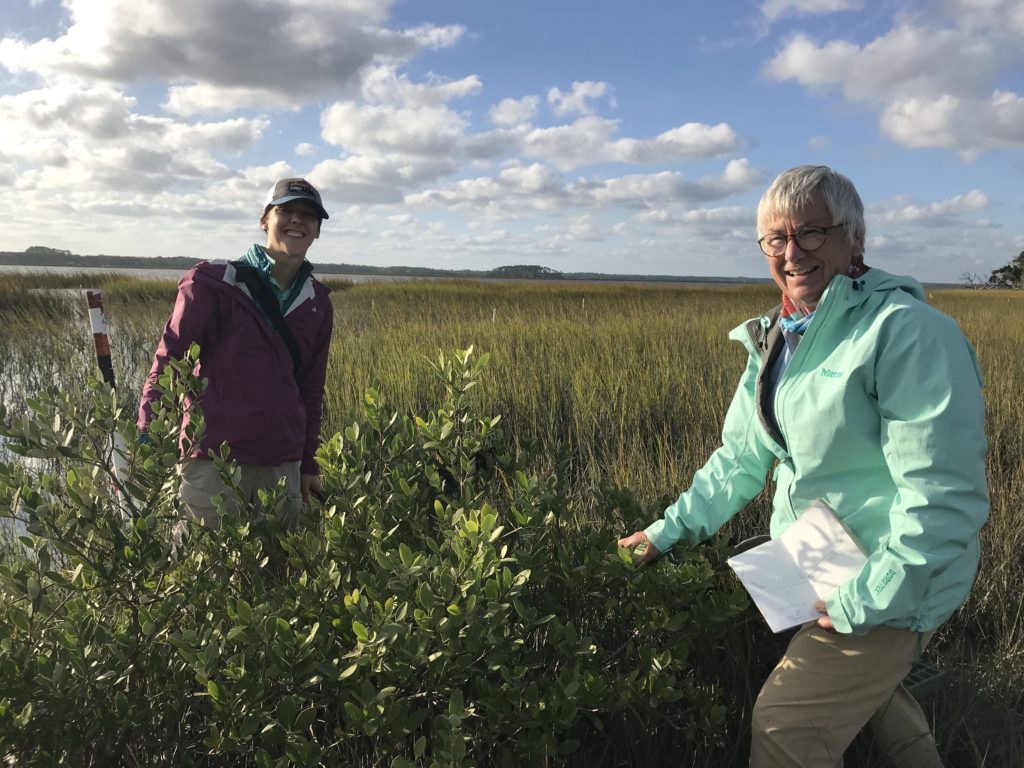
Tall mangroves growing close to the coast.

The activities are as follows:

In the tropics and subtropics, mangroves dominate the coast. There are many different species of mangroves, but they are all share a unique characteristic compared to other trees – they can tolerate having their roots submerged in salt water.

Mangroves are globally important for many reasons. They form dense forested wetlands that protect the coast from erosion and provide critical habitat for many animals. Mangrove forests also help in the fight against climate change. Carbon dioxide is a greenhouse gas that is a main driver of climate change. During photosynthesis, carbon dioxide is absorbed from the atmosphere by the plants in a mangrove forest. When plants die in mangrove forests, decomposition is very slow. The soils are saturated with saltwater and have very little oxygen, which decomposers need to break down plants. Because of this, carbon is stored in the soils for a long time, keeping it out of the atmosphere.

Sean is a scientist studying coastal mangroves in the Florida Everglades. Doing research in the Everglades was a dream opportunity for Sean. He had long been fascinated by the unique plant and animal life in the largest subtropical wetland ecosystem in North America. Mangroves are especially exciting to Sean because they combine marine biology and trees, two of his favorite things! Sean had previously studied freshwater forested wetlands in Virginia, but had always wanted to spend time studying the salty mangrove forests that exist in the Everglades. 

Sean Charles taking soil samples amongst inland short mangroves.

Sean arrived in the Everglades with the goal to learn more about the factors important for mangrove forests’ ability to hold carbon in their soils. Upon his arrival, he noticed a very interesting pattern – the trees were much taller along the coast compared to inland. This is because mangroves that grow close to the coast have access to important nutrients found in ocean waters, like phosphorus. These nutrients allow the trees to grow large and fast. However, living closer to the coast also puts trees at a higher risk of damage from storms, and can lead to soils and dead plants being swept out to sea. 

Sean thought that the combination of these two conditions would influence how much carbon is stored in mangrove soils along the coast and inland. Larger trees are generally more productive than smaller ones, meaning they might contribute more plant material to soils. This led Sean to two possible predictions. The first was that there might be more carbon in soils along the coast because taller mangroves would add more carbon to the soil compared to shorter inland mangroves. However, Sean thought he might also find the opposite pattern because the mangroves along the coast have more disturbance from storms that could release carbon from the soils. 

To test these competing hypothesis, the team of scientists set out into the Everglades in the Biscayne National Park in Homestead, Florida. Their mission was to collect surface soils and measure mangrove tree height. To collect soils, they used soil cores, which are modified cylinders that can be hammered into the soil and then removed with the soil stuck in the tube. Tree height was measured using a clinometer, which is a tool that uses geometry to estimate tree height. They took these measurements along three transects. The first transect was along the coast where trees had an average height of 20 meters. The second transect between the coast and inland wetlands where trees were 10 meters tall, on average. The final transect was inland, with average tree height of only 1 meter tall.  With this experimental design Sean could compare transects at three distances from the coast to look for trends. 

Once Sean was back in the lab, he quantified how much carbon was in the soil samples from each transect by heating the soil in a furnace at 500 degrees Celsius. Heating soils to this temperature causes all organic matter, which has carbon, to combust. Sean measured the weight of the samples before and after the combustion. The difference in weight can be used to calculate how much organic material combusted during the process, which can be used as an estimate of the carbon that was stored in the soil. 

Featured scientist: Sean Charles from Florida International University

Flesch–Kincaid Reading Grade Level = 9.6

Additional teacher resources related to this Data Nugget:

Candid camera: Capturing the secret lives of carnivores

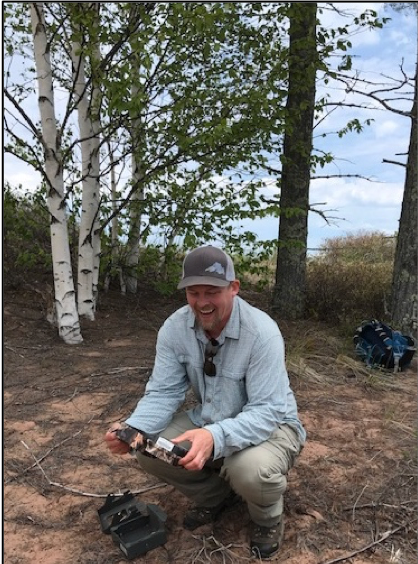
Erik demonstrating how to place a camera trap on a tree on Stockton Island.

The activities are as follows:

Carnivores, animals that eat meat, captivate people’s interest for many reasons – they are charismatic, stealthy, and can be dangerous. Not only are they fascinating, they’re also ecologically important. Carnivores help keep prey populations in balance. They often target old, sick, or weak individuals. This results in more resources for healthier prey. Carnivores also impact prey’s behavior and population sizes, which can have further effects down the food web. For example, if there are too many herbivores, such as deer, the plants in an ecosystem may be eaten to a point where they can’t survive. In this way, carnivores help the plant community by either reducing the number of herbivores in an ecosystem, or changing how or where prey forage for food. 

Despite their importance and our interest in carnivores, they are very hard to monitor. Not only do they have naturally low population sizes because they are at the top of the food chain, they also have a natural ability to hide and blend into their environment. Erik is a wildlife biologist who is interested in taking on this challenge. He wants to learn more about carnivores and what factors affect where they live. Learning more about where carnivores are found can help scientists with conservation efforts.

Erik lives on the southern shore of Lake Superior, the largest lake (by area) in the world. This area is home to the Apostle Islands National Lakeshore – including 21 islands and a 12-mile stretch of the mainland in northern Wisconsin. The Apostle Islands vary in many ways – size, distance from the mainland, highest elevation, historical and current human use, plant communities, and even small differences in climate. The islands are so remote that scientists really didn’t know which carnivores lived on the islands. There is evidence from historical reports that red fox and coyotes lived on some of the islands. More recently, black bears have been observed by visitors as they are hiking or camping. Erik wanted to know which species of carnivores are on each island. As he began to explore methods to document wildlife on the islands, Erik and his collaborators were shocked to discover that American martens, Wisconsin’s only state endangered species, live on some of the islands.

Erik thought a promising step in learning more about what drives carnivores to live on different islands in the archipelago would be to apply what has been learned from islands in the ocean. He referred to a fundamental theory in ecology called the theory of island biogeography. This theory predicts that island size and its distance to the mainland affects the biodiversity, or number of species, found on that island. Specifically, larger islands will have higher carnivore biodiversity because there are more resources and space to support more species than smaller areas. In contrast, islands farther away from the mainland will have lower carnivore biodiversity because more isolated islands are harder for wildlife to reach. 

Erik wanted to test whether the theory of island biogeography also applied to the Apostle Islands. Just like the classic research on island biogeography, some islands are closer to the mainland and they range in size. To inventory where each carnivore is found, Erik and his collaborators and students set up 164 wildlife cameras on 19 of the islands. They made their way out to the remote islands by boat and then bushwhacked their way to the sites, which are not along trails. Often this means they have to push through thick brush and climb over fallen trees, but it’s important to put the cameras in all habitat types, not just those that are enjoyable to walk through. When the research team arrived at a site, they mounted a camera on a tree at waist height. Whenever an animal came into the frame of a camera, a photo was taken and stored on a memory card. The cameras were left on the islands year-round from 2014-2019. Every 6 months Erik and his collaborators would traverse through the thick woods to swap out memory cards and batteries. During this time, they noticed that four of the cameras had not worked properly, so they used the pictures from 160 of the cameras. 

Back at the college, the research team spent countless hours identifying which animals triggered the cameras. The cameras had taken over 200,000 photos over three years including 7,000 wildlife visits. Of these visits, 1,970 were from carnivores! They found 10 different kinds of carnivores, including: American marten, black bear, bobcat, coyote, fisher, gray fox, gray wolf, raccoon, red fox and weasels. After the pictures were processed, Erik used this information to map out which islands the animals were found. For this study, he used species richness, or the number of different species observed on each island, to answer his question. 

Map of the Apostle Islands with the richness, or number of different carnivore species, detected on each island.

Featured scientists: Erik Olson from Northland College, Tim Van Deelen, and Julie Van Stappen from the National Park Service. Support for this lesson was provided by the National Park Service with funding from the Great Lakes Restoration Initiative.

Flesch–Kincaid Reading Grade Level = 11.2

Additional teacher resources related to this Data Nugget:

The study and results described in this Data Nugget have been published:

  • Allen, M.L., Farmer, M.J., Clare, J.J., Olson, E.R., Van Stappen, J., Van Deelen, T.R. 2018. Is there anybody out there? Occupancy of the carnivore guild in a temperate archipelago. Community Ecology 19(3): 272-280.

Citizen science site where students can view and identify animals found in pictures from cameras placed around Wisconsin.

There have been several news articles about this research:

Picky eaters: Dissecting poo to examine moose diets

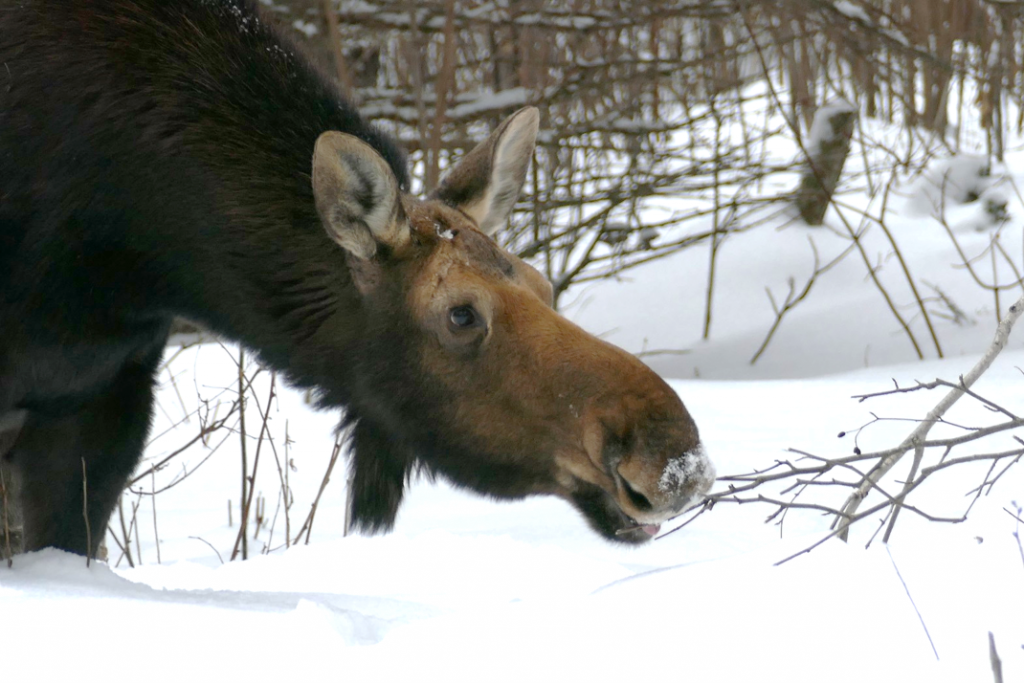
Moose chomping on a forest plant

When you eat at a restaurant, do you always order your favorite meal? Or do you like to look at the menu and try something new? Humans have so many meal options that it can be hard to decide what to eat, but we also have preferences for certain food over others. Animals have fewer decisions to make. They have to choose from food options available in their environment. Do animals search for specific food types or eat any food they find?

Scientists who study the ecology of the remote Isle Royale National Park are interested in knowing more about how moose decide which plants to eat. Isle Royale is a large (44 miles long and 8 miles wide) island found within Lake Superior. On the island, wolves are the main predators of moose. The wolf and moose populations have been studied there for over 60 years, making it the longest continuous study of predator-prey dynamics.

In recent years, the wolf population struggled to rebound because there were very few adults reproducing. Without their natural predators, the moose population has increased dramatically, in 2000 there were approximately 500 moose, but since that time the population has grown to over 2,000 moose! Moose are browsers, meaning they eat leaves and needles, fruits, or twigs that are found on woody plants. Having too many moose on the island would take a toll on the island’s plant community. Bite by bite, moose may be chomping away at the forest and changing the Isle Royale ecosystem as we know it.

To try to fix this problem, the National Park Service is working to restore the wolf population by relocating adults from other Lake Superior packs to the island. However, this will take several years and in the meantime moose will continue to have an effect on the plant community. Scientists Sarah, John, and their colleagues realize how important it is to monitor which plants the moose are eating. The scientist team wanted to know whether moose simply eat the plants that they come across, or if they show preference for certain plants. 

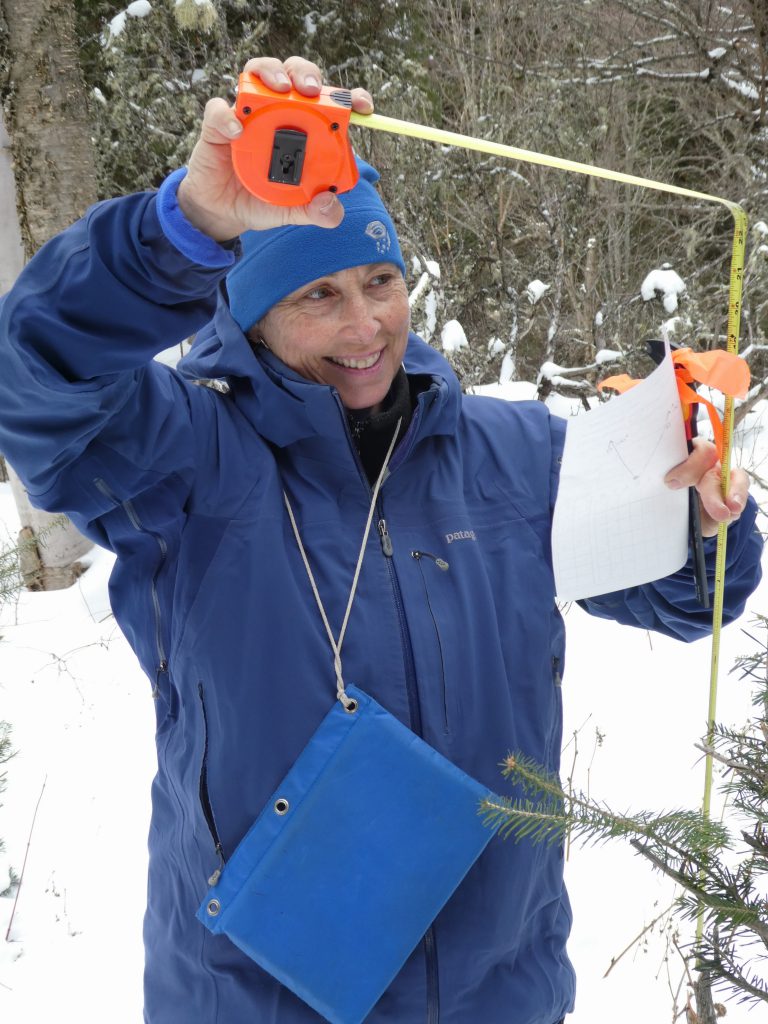
Surveying woody plants in Isle Royale National Park

One thing that could affect moose food preference is the nutrition level of the different plants. In the winter, deciduous plants lose their leaves, unlike conifers that are green all year round. In the winter, moose end up eating the edges of twigs from deciduous plants, but can still eat needles of conifers. Needles are easier for moose to digest and have more nutrients than twigs so the scientists thought moose would seek out coniferous plants, like balsam fir and cedar, even if they were less common in the environment.

Starting in 2004, the scientist team selected 14 sites across the island and started collecting moose poop, also called fecal pellets, at the end of winter. Back in the lab, the fecal pellets were examined closely under a microscope to determine what the moose were eating. Many plants have identifiable differences in cellular structures, so the scientists were able to look at the magnified fragments and record how much balsam fir, cedar, and deciduous plants the moose had been eating. 

To understand preference, the scientists also needed to know which plants were in the area that the moose were living. They did plant surveys at the beginning and end of the study to estimate the percent of different woody plants that are in the forest. Because woody plants are long-living, the forest didn’t change too much from year to year. 

Once they had the forest plant surveys and the moose diets analyzed from the fecal pellets, they were able to analyze whether moose selectively eat. If a moose was randomly eating the plant types that it came across, it would have similar amounts of plants in its diet than what is found in the forest. If a moose shows preference for a plant type, it would have a higher percent of that food in their diet than what is found in the forest. Moose could also be avoiding certain food types, which would be when they have a lower percent of a plant type in its diet than in the environment.

Featured scientist: Sarah Hoy, John Vucetich and John Henderson from Michigan Technological University.Support for this lesson was provided by the National Park Service with funding from the Great Lakes Restoration Initiative.

Flesch–Kincaid Reading Grade Level = 10.1

Additional teacher resources related to this Data Nugget:

The study and results described in this Data Nugget have been published. If students are curious to know more about the study design and how sites were selected, there is an approachable methods section available in the article:

  • Hoy, S.R., Vucetich, J.A., Liu, R., DeAngelis, D.L., Peterson, R.O., Vucetich, L.M., & Henderson, J.J. 2019. Negative frequency-dependent foraging behavior in a generalist herbivore (Alces alces) and its stabilizing influence on food-web dynamics. Journal of Animal Ecology.

There have been several news stories about this research:

Website with more information on the Isle Royale Wolf-Moose Study, including additional datasets to examine with students.


Testing the tolerance of invasive plants

Casey out in the field.

The activities are as follows:

Casey is a biologist who grew up with dogs as pets. His dogs were all the same species and had some things in common – they all had a tail, ears, and fur. But, each dog also had its own unique appearance – tail length, ear shape, and fur color. These things are called traits. Casey became interested in how slight differences in traits make individuals unique. 

As Casey observed in dogs, not all individuals in the same species are exactly alike. This is also true in plants. When we look closely at individual plants of the same species, we often see that each is slightly different from the next. Some grow faster. Some have more leaves than others. Some are better at defending themselves against herbivores that might eat them. 

People move species around the globe, and some of these species cause problems where they are introduced. These trouble-making species are called invasive species. Casey wanted to apply what he knew about trait differences to the environment around him, so he chose to study invasive plants and their traits. He wants to know what it is about invasive species that make them able to invade. Casey thought that maybe certain traits cause invasive species to be more troublesome than others. The individual plants that have invaded other parts of the world might have different traits that made them successful in that environment. Plants in their new invasive range might be slightly different than plants in the native range where they came from.  

Along with other members of his lab, Casey is studying an invasive plant species called burr clover. The lab collected seeds of burr clover from all different parts of the world. Some of the seeds came from the native range around the Mediterranean Sea (e.g. Italy, France, and Morocco) and some came from areas where they are invasive (e.g. Japan, Brazil, and the United States). The plants from the invasive range have already proven that they can invade new areas. Studying traits in native and invasive ranges would allow Casey to learn more about how those individuals invaded in the first place. Because Casey thought trait differences might have caused certain individuals of burr clover to become invasive, he predicted that individuals from the invasive range would have different traits than those from the native range. 

Casey’s field site where he studies Burr Clover

The lab decided to look at one trait in particular – how much an individual plant was affected by herbivores, which is called tolerance. The most tolerant individuals can still grow and produce fruits, even when herbivores eat a lot of their tissue. Casey thought that individuals from the invasive range would be more tolerant than individuals from the native range. One reason the invading individuals may have been successful is that they were more tolerant of herbivores in their new environment.The fruits contain seeds that make new plants, so plants that make more fruits can invade more easily. If individuals from the invasive range can make more fruits, even when herbivores are around, then they may reproduce and spread more quickly. 

So, Casey and his lab collected seeds from 22 individual plants from the native range and 22 individual plants from the invasive range. Each plant produces many seeds, so they collected several seeds from each individual. They created 24 2×2-meter plots in a field in California. Into each plot they planted 2-4 seeds from each individual plant and the seeds were planted in a random order in each plot. In all, there were 3,349 plants! In half of the plots, they removed any insects that might eat the plants. To do this they randomly chose half of the plots and sprayed them with insecticide, which kills insects. They sprayed the other half of the plots with water as a control. They wanted to know how many fruits were made by plants under good conditions so they could compare to plants that are being eaten by herbivores. After the plants grew all spring, they measured how many small, spiky fruits each plant produced. They compared how many fruits each plant produced in the plots with insects and the plots without insects. 

Featured scientist: Casey terHorst from California State University, Northridge

Flesch–Kincaid Reading Grade Level = 8.3

All washed up? The effect of floods on cutthroat trout

The activities are as follows:

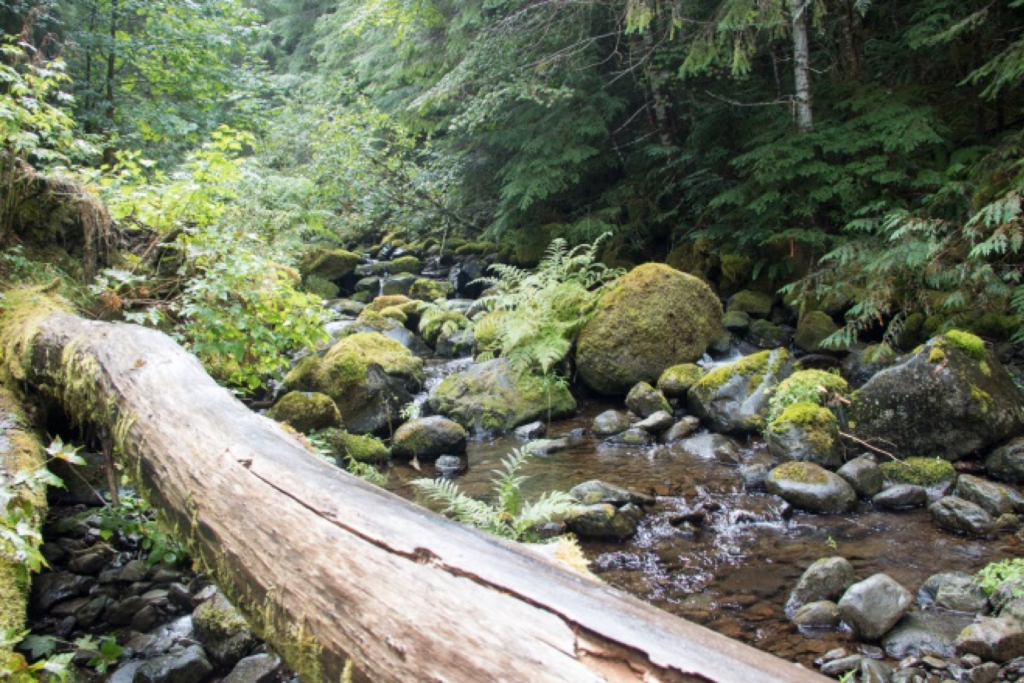
Mack Creek, a healthy stream located within the old growth forests in Oregon. It has a diversity of habitats because of various rocks and logs. This creates diverse habitats for juvenile and adult trout.

Streams are tough places to live. Fish living in streams have to survive droughts, floods, debris flows, falling trees, and cold and warm temperatures. In Oregon, cutthroat trout make streams their home. Cutthroat trout are sensitive to disturbances in the stream, such as pollution and sediment. This means that when trout are present it is a good sign that the stream is healthy.

Floods are very common disturbances in streams. During floods, water in the stream flows very fast. This extra movement picks up sediment from the bottom of the stream and suspends it in the water. When sediment is floating in the water it makes it harder for fish to see and breathe, limiting how much food they can find. Floods may also affect fish reproduction. If floods happen right after fish breed and eggs hatch, young fish that cannot swim strongly may not survive. Although floods can be dangerous for fish, they are also very important for creating new habitat. Floods expand the stream, making it wider and adding more space. Moving water also adds large boulders, small rocks, and logs into the stream. These items add to the different types of habitat available. 

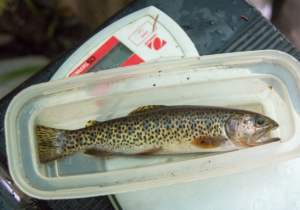
A cutthroat trout. It is momentarily unhappy, because it is not in its natural, cold Pacific Northwest stream habitat.

Ivan and Stan are two scientists who are interested in whether floods have a large impact on the survival of young cutthroat trout. They were worried because cutthroat trout reproduce during the spring, towards the end of the winter flood season. During this time juvenile trout,less than one year old, are not good swimmers. The fast water from floods makes it harder for them to survive. After a year, juvenile trout become mature adults.These two age groups live in different habitats. Adult trout live in pools near the center of streams. Juvenile trout prefer habitats at the edges of streams that have things like rocks and logs where they can hide from predators. Also, water at the edges moves more slowly, making it easier to swim. In addition, by staying near the stream edge they can avoid getting eaten by the adults in stream pools.

Ivan and Stan work at the H.J. Andrews Long Term Ecological Research site. They wanted to know what happens to cutthroat trout after winter floods. Major floods occur every 35-50 years, meaning that Ivan and Stan would need a lot of data. Fortunately for their research they were able to find what they needed since scientists have been collecting data at the site since 1987!

To study how floods affect trout populations, Ivan and Stan used data from Mack Creek, one of the streams within their site. They decided to look at the population size of both juvenile and adult trout since they occupy such different parts of the stream. For each year of data they had, Ivan and Stan compared the juvenile and adult trout population data, measured as the number of trout, with stream discharge, or a measure of how fast water is flowing in the stream. Stream discharge is higher after flooding events. Stream discharge data for Mack Creek is collected during the winter when floods are most likely to occur. Fish population size is measured during the following summer each year. Since flooding can make life difficult for trout, they expected trout populations to decrease after major flooding events.

Featured scientists: Ivan Arismendi and Stan Gregory from Oregon State University. Written by: Leilagh Boyle.

Flesch–Kincaid Reading Grade Level = 7.5

Additional teacher resource related to this Data Nugget:

Tree-killing beetles

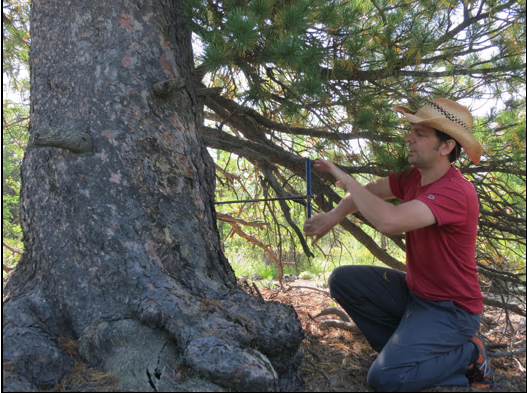
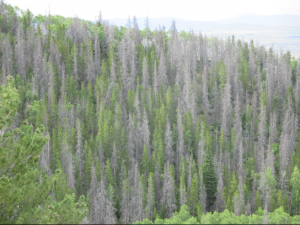
A Colorado forest impacted by a mountain pine beetle outbreak. Notice the dead trees mixed with live trees. Forests like this with dead trees from mountain pine beetle outbreaks cover millions of acres across western North America.

The activities are as follows:

A beetle the size of a grain of rice seems insignificant compared to a vast forest. However, during outbreaks the number of mountain pine beetles can skyrocket, leading to the death of many trees. The beetles bore their way through tree bark and introduce blue stain fungi. The blue stain fungi kills the tree by blocking water movement. Recent outbreaks of mountain pine beetles killed millions of acres of lodgepole pine trees across western North America. Widespread tree death caused by mountain pine beetles can impact human safety, wildfires, nearby streamflow, and habitat for wildlife.

Mountain pine beetles are native to western North America and outbreak cycles are a natural process in these forests. However, the climate and forest conditions have been more favorable for mountain pine beetles during recent outbreaks than in the past. These conditions caused more severe outbreaks than those seen before.

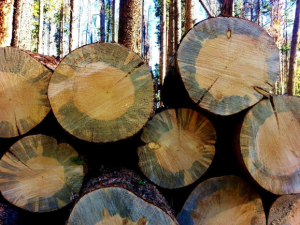
Logs from mountain pine beetle killed lodgepole pine trees. The blue stain fungi is visible around the edge of each log. Mountain pine beetles introduce this fungus to the tree.

When Tony moved to Colorado, he drove through the mountains eager to see beautiful forests. The forest he saw was not the green forest he expected. Many of the trees were dead! Upon closer examination he realized that some forests had fewer dead trees than others. This caused him to wonder why certain areas were greatly impacted by the mountain pine beetles while others had fewer dead trees. Tony later got a job as a field technician for Colorado State University. During this job he measured trees in mountain forests. He carefully observed the forest and looked for patterns of where trees seemed to be dead and where they were alive.

Tony thought that the size of the trees in the forest might be related to whether they were attacked and killed by beetles. A larger tree might be easier for a beetle to find and might be a better source of food.To test this idea, Tony and a team of scientists visited many forests in northern Colorado. At each site they recorded the diameter of each tree’s trunk, which is a measure of the size of the tree. They also recorded the tree species and whether it was alive or dead. They then used these values to calculate the average tree size and the percent of trees killed for each site.

Featured scientist: Tony Vorster from Colorado State University

Flesch–Kincaid Reading Grade Level = 8.3

There is one scientific paper associated with the data in this Data Nugget. The citation and PDF of the paper is below:

Students can complete this Data Nugget along with Tony! In this video, Tony provides more background on how he became interested in doing research, how he collects his data, and details on how to construct graphs.

Are forests helping in the fight against climate change?

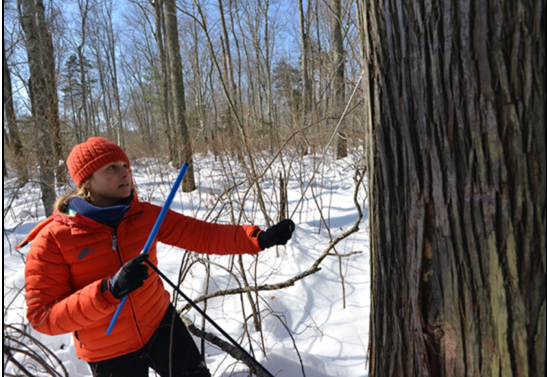
Bill setting up a large metal tower in Harvard Forest in 1989, used to measure long-term CO2 exchange.

The activities are as follows:

As humans drive cars and use electricity, we release carbon in the form of carbon dioxide (CO2) into the air. Because COhelps to trap heat near the surface of the earth, it is known as a greenhouse gas and contributes to climate change. However, carbon is also an important piece of natural ecosystems, because all living organisms contain carbon. For example, when plants photosynthesize, they take COfrom the air and turn it into other forms of carbon: sugars for food and structural compounds to build their stems, roots, and leaves. When the carbon in a living tree’s trunk, roots, leaves, and branches stays there for a long time, the carbon is kept out of the air. This carbon storage helps reduce the amount of COin the atmosphere. However, not all of the COthat trees take from the air during photosynthesis remains as part of the tree. Some of that carbon returns to the air during a process called respiration.

Another important part of the forest carbon cycle happens when trees drop their leaves and branches or die. The carbon that the tree has stored breaks down in a process called decomposition. Some of the stored carbon returns to the air as CO2, but the rest of the carbon in those dead leaves and branches builds up on the forest floor, slowly becoming soil. Once carbon is stored in soil, it stays there for a long time. We can think of forests as a balancing act between carbon building up in trees and soil, and carbon released to the air by decomposition and respiration. When a forest is building up more carbon than it is releasing, we call that area a carbon sink, because overall more COis “sinking” into the forest and staying there. On the other hand, when more carbon is being released by the forest through decomposition and respiration, that area is a carbon source, because the forest is adding more carbon back into the atmosphere than it is taking in through photosynthesis.

In the 1990s, scientists began to wonder what role forests were having in this exchange of carbon in and out of the atmosphere. Were forests overall storing carbon (carbon sink), or releasing it (carbon source)? Bill is one of the scientists who decided to explore this question. Bill works at the Harvard Forest in central Massachusetts, a Long-Term Ecological Research site that specializes in setting up big experiments to learn how the environment works. Bill and his team of scientists realized they could measure the COcoming into and out of an entire forest. They built large metal towers that stand taller than the forest trees around them and use sensors to measure the speed, direction, and COconcentration of each puff of air that passes by. Bill compares the COin the air coming from the forest to the ones moving down into the forest from the atmosphere. With the COdata from both directions, Bill calculates the Net Ecosystem Exchange (or NEE for short). When more carbon is moving into the forest than out, NEE is a negative number because COis being taken out of the air. This often happens during the summer when trees are getting a lot of light and are therefore photosynthesizing. When more COis leaving the forest, it means that decomposition and respiration are greater than photosynthesis and the NEE is a positive number. This typically happens at night and in the winter, when trees aren’t photosynthesizing but respiration and decomposition still occur. By adding up the NEE of each hour over a whole year, Bill finds the total amount of COthe forest is adding or removing from the atmosphere that year.

Bill and his team were very interested in understanding NEE because of how important it is to the global carbon cycle, and therefore to climate change. They wanted to know which factors might cause the NEE of a forest to vary. Bill and other scientists collected data on carbon entering and leaving Harvard Forest for many years to see if they could find any patterns in NEE over time. By looking at how the NEE changes over time, predictions can be made about the future: are forests taking up more COthan they release? Will they continue to do so under future climate change?

Featured scientist: Bill Munger from Harvard University. Written by: Fiona Jevon.

Flesch–Kincaid Reading Grade Level = 10.5

Additional teacher resource related to this Data Nugget:

  • There are several publications based on the data from the Harvard Forest LTER. Citations below:
    • Wofsy, S.C., Goulden, M.L., Munger, J.W., Fan, S.M., Bakwin, P.S., Daube, B.C., Bassow, S.L. and Bazzaz, F.A., 1993. Net exchange of CO2 in a mid-latitude forest. Science260(5112), pp.1314-1317.
    • Goulden, M.L., Munger, J.W., Fan, S.M., Daube, B.C. and Wofsy, S.C., 1996. Exchange of carbon dioxide by a deciduous forest: response to interannual climate variability. Science271(5255), pp.1576-1578.
    • Barford, C.C., Wofsy, S.C., Goulden, M.L., Munger, J.W., Pyle, E.H., Urbanski, S.P., Hutyra, L., Saleska, S.R., Fitzjarrald, D. and Moore, K., 2001. Factors controlling long-and short-term sequestration of atmospheric CO2 in a mid-latitude forest. Science294(5547), pp.1688-1691.
    • Urbanski, S., Barford, C., Wofsy, S., Kucharik, C., Pyle, E., Budney, J., McKain, K., Fitzjarrald, D., Czikowsky, M. and Munger, J.W., 2007. Factors controlling CO2 exchange on timescales from hourly to decadal at Harvard Forest. Journal of Geophysical Research: Biogeosciences112(G2).
    • Wehr, R., Munger, J.W., McManus, J.B., Nelson, D.D., Zahniser, M.S., Davidson, E.A., Wofsy, S.C. and Saleska, S.R., 2016. Seasonality of temperate forest photosynthesis and daytime respiration. Nature534(7609), p.680.
  • Our Changing Forests Schoolyard Ecology project – Do your students want to get involved with research monitoring carbon cycles in forests? Check out this hands-on field investigation, led by a team of Ecologists at Harvard Forest. Students can contribute to this study by monitoring a 20 meter by 20 meter plot in a wooded area near their schools.
  • Video showcasing 30 years of research at the Harvard Forest LTER
  • A cool article about the diversity of research being done at Harvard Forest – Researchers blown away by hurricane simulation
  • Additional images from Harvard Forest, diagrams of NEE, and a vocabulary list can be found in this PowerPoint.

Bringing back the Trumpeter Swan

Joe with a Trumpeter Swan.

The activities are as follows:

The Kellogg Bird Sanctuary was created in 1927 to provide safe nesting areas for waterfowl such as ducks, geese, and swans. During that time many waterfowl species were in trouble due to overhunting and the loss of wetland habitats. One species whose populations had declined a lot was the Trumpeter Swan. Trumpeter swans are the biggest native waterfowl species in North America. At one time they were found across North America, but by 1935 there were only 69 known individuals in the continental U.S.! The swans were no longer found in Michigan.

The reintroduction, or release of a species into an area where they no longer occur, is an important tool in helping them recover. In the 1980s, many biologists came together to create a Trumpeter Swan reintroduction plan. Trumpeter Swans in North America can be broken up into three populations – Pacific Coast, Rocky Mountain, and Interior. The Interior is further broken down into Mississippi/Atlantic and High Plains subpopulations. Joe, the Kellogg Bird Sanctuary manager and chief biologist, wrote and carried out a reintroduction plan for Michigan. Michigan is part of the Mississippi/Atlantic subpopulation. Joe and a team of biologists flew to Alaska in 1989 to collect swan eggs to be reared at the sanctuary. After two years the swans were released throughout Michigan.

The North American Trumpeter Swan survey has been conducted approximately every 5 years since 1968 as a way to estimate the number of swans throughout their breeding range. The survey is conducted in late summer when young swans can’t yet fly but are large enough to count. Although the surveys are conducted across North America, the data provided focuses on just the Interior Population, which includes swans in the High Plains and Mississippi/Atlantic Flyways.

Featured scientist: Wilbur C. “Joe” Johnson from the W.K. Kellogg Bird SanctuaryWritten by: Lisa Vormwald and Susan Magnoli from Michigan State University.

Flesch–Kincaid Reading Grade Level = 11.5

Additional teacher resource related to this Data Nugget:

A video on Trumpeter Swan reintroduction efforts that could be shown before the Data Nugget to engage students with the topic, or after to expand the research beyond the one study:

SaveSave

SaveSave

SaveSave

SaveSave

SaveSave

The case of the collapsing soil

An area in the Florida Everglades where strange soil collapse has been observed.

The activities are as follows:

As winds blow through the large expanses of grass in the Florida Everglades, it looks like flowing water. This “river of grass” is home to a wide diversity of plants and animals, including both the American Alligator and the American Crocodile. The Everglades ecosystem is the largest sub-tropical wetland in North America. One third of Floridians rely on the Everglades for water. Unfortunately, this iconic wetland is threatened by rising sea levels caused by climate change. Sea level rise is caused by higher global temperatures leading to thermal expansion of water, land-ice melt, and changes in ocean currents.

With rising seas, one important feature of the Florida Everglades may change. There are currently large amounts of carbon stored in the wetland’s muddy soils. By holding carbon in the mud, coastal wetlands are able to help in the fight against climate change. However, under stressful conditions like being submersed in sea water, soil microbes increase respiration. During respiration, carbon stored in the soil is released as carbon dioxide (CO2), a greenhouse gas. As sea level rises, soil microbes are predicted to release stored carbon and contribute to the greenhouse effect, making climate change worse.

Shelby collecting soil samples from areas where the soil has collapsed in the Everglades.

Shelby and John are ecologists who work in southern Florida. John became fascinated with the Everglades during his first visit 10 years ago and has been studying this unique ecosystem ever since. Shelby is interested in learning how climate change will affect the environment, and the Everglades is a great place to start! They are both very concerned with protecting the Everglades and other wetlands. Recently when John, Shelby, and their fellow scientists were out working in the Everglades they noticed something very strange. It looked like areas of the wetland were collapsing! What could be the cause of this strange event?

John and Shelby thought it might have something to do loss of carbon due to sea level rise. They wanted to test whether the collapsing soils were the result of increased microbial respiration, leading to loss of carbon from the soil, due to stressful conditions from sea level rise. They set out to test two particular aspects of sea water that might be stressful to microbes – salt and phosphorus.

Phosphorus is found in sea water and is a nutrient essential for life. However, too much phosphorus can lead to over enriched soils and change the way that microbes use carbon. Sea water also contains salt, which can stress soil microbes and kill plants when there is too much. Previous research has shown that both salt and phosphorus exposure on their own increase respiration rates of soil microbes.

A photo of the experimental setup. Each container has a different level of salt and phosphorus concentration.

To test their hypotheses, a team of ecologists in John’s lab developed an experiment using soils from the Everglades. They collected soil from areas where the soil had collapsed and brought it into the lab. These soils had the microbes from the Everglades in them. Once in the lab, they put their soil and microbes into small vials and exposed them to 5 different concentrations of salt, and 5 different concentrations of phosphorus. The experiment crossed each level of the two treatments. This means they had soil in every possible combination of treatments – some with high salt and low phosphorus, some in low salt and high phosphorus, and so on. Their experiment ran for 5 weeks. At the end of the 5 weeks they measured the amount of COreleased from the soils.

Featured scientists: John Kominoski and Shelby Servais from Florida International University. Written by Shelby, John, and Teresa Casal.

Flesch–Kincaid Reading Grade Level = 9.2

SaveSave

SaveSave

SaveSave

SaveSave

SaveSave

SaveSave

SaveSave

SaveSave

SaveSave

SaveSave

Which would a woodlouse prefer?

Woodlice are small crustaceans that live on land. They look like bugs, but are actually more closely related to crabs and lobsters! Photo credit Liz Henwood.

The activities are as follows:

Woodlice are small crustaceans that live on land. They look like bugs, but are actually more closely related to crabs and lobsters. To escape predators they hide in dark places. They spend most of their time underground and have very poor eyesight.

One day, when digging around in the dark dirt of her compost pile, Nora noticed that there were many, many woodlice hiding together. This made her wonder how woodlice decide where to live. Because woodlice have very simple eyesight, Nora thought that maybe they use dark and light colors to decide where to go. They might choose to move towards darker colors and away from lighter colors to prevent ending up above ground where predators can easily find them.

Nora collecting woodlice from the compost pile.

Nora, along with classmates in her ecology class at Michigan State University, decided to run an experiment to study woodlice behavior. She collected 10 woodlice from her compost pile and placed them in a jar. She brought the jar into the lab. Then she chose a set of trays to work with from what she had in the lab – white, with tall sides. The sides of the tray were tall and smooth so the woodlice were not able to climb out. On one end of the tray Nora put some dark soil, and on the other side she put lighter leaves. If her hypothesis was correct, Nora predicted that woodlice would more often choose to move towards the dark soil habitat, compared to the lighter leaves habitat.

For each trial, Nora gently picked up a single woodlouse with forceps. She then placed it in the center of the tray. All the woodlice were positioned so they started facing the top of the tray, not at either habitat type. The woodlice then chose to move towards one end of the tray or the other. When they reached one of the piles the students recorded which habitat they chose. It was then picked up with forceps. Nora and her classmates recorded its length and placed it in a new jar so it could be released back into the compost pile once the experiment was done.

The tray where the preference trials were conducted. To the right of the tray is the soil pile, and to the left is the leaf pile. The center was purposefully left empty and wiped down before each run.

After running this experiment and looking at the data, Nora realized it did not work. The small sample size of only 10 individuals was not enough to see a pattern. Also, she realized that after one woodlouse went a certain way, all the others would follow it, maybe because they were following a scent trail. She decided she had to do the experiment again, this time with more woodlice and in a way that would prevent them following each other’s scent trails.

For her second try, Nora collected 51 woodlice from a different compost pile. Just like the first experiment, Nora placed lighter leaves on one end of a white tray and dark soil on the other. All the methods were the same, except for a few important changes. To get rid of scent trails, this time Nora wiped down the middle of the tray with a clean wet paper towel between trials. She also added equal amounts of water to both habitats to control for humidity. This ensured that if woodlice did show a preference for either habitat it would be due to habitat color, not humidity. This time Nora used a stopwatch and recorded how long it took for an individual to choose one of the two habitats.

Featured scientist: Nora Straquadine from Michigan State University

 Flesch–Kincaid Reading Grade Level = 7.7

Additional teacher resource related to this Data Nugget:

  • PowerPoint slideshow of images of woodlice and Nora’s experiment.
  • A great video to show before the Data Nugget to engage students with the activity – gives background on woodlice and describes the role that water plays for these crustaceans that live on land:

  • A video of woodlice on a fallen tree. This video has no audio, but can be useful for students to observe woodlice behavior:


About Nora: Nora is currently an undergraduate getting her B.S. in Zoology with a concentration in Zoo and Aquarium as well as a minor in Marine Ecosystem Management from Michigan State University. Although aquatic life is her main interest, she think it’s important to appreciate other animal groups and take a break to play and explore the nature around you. That curiosity was how she was able to volunteer in labs on campus from entomology to genetics, and how she came to spend a summer at the Kellogg Biological Station in Michigan.

SaveSave

SaveSave

SaveSave

SaveSave

SaveSave

SaveSave

SaveSave