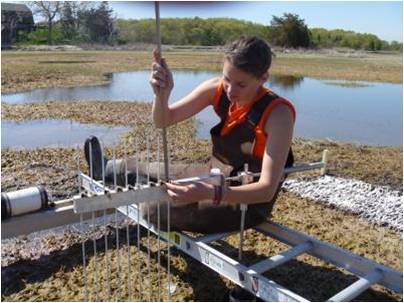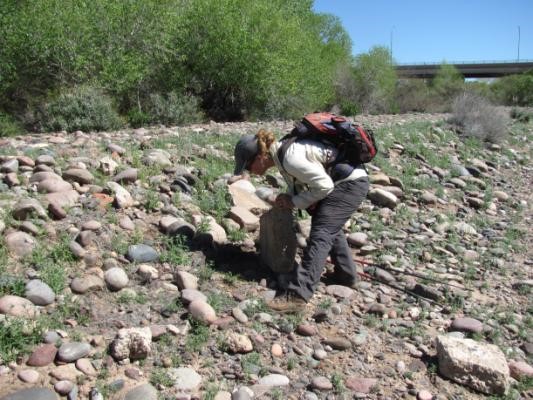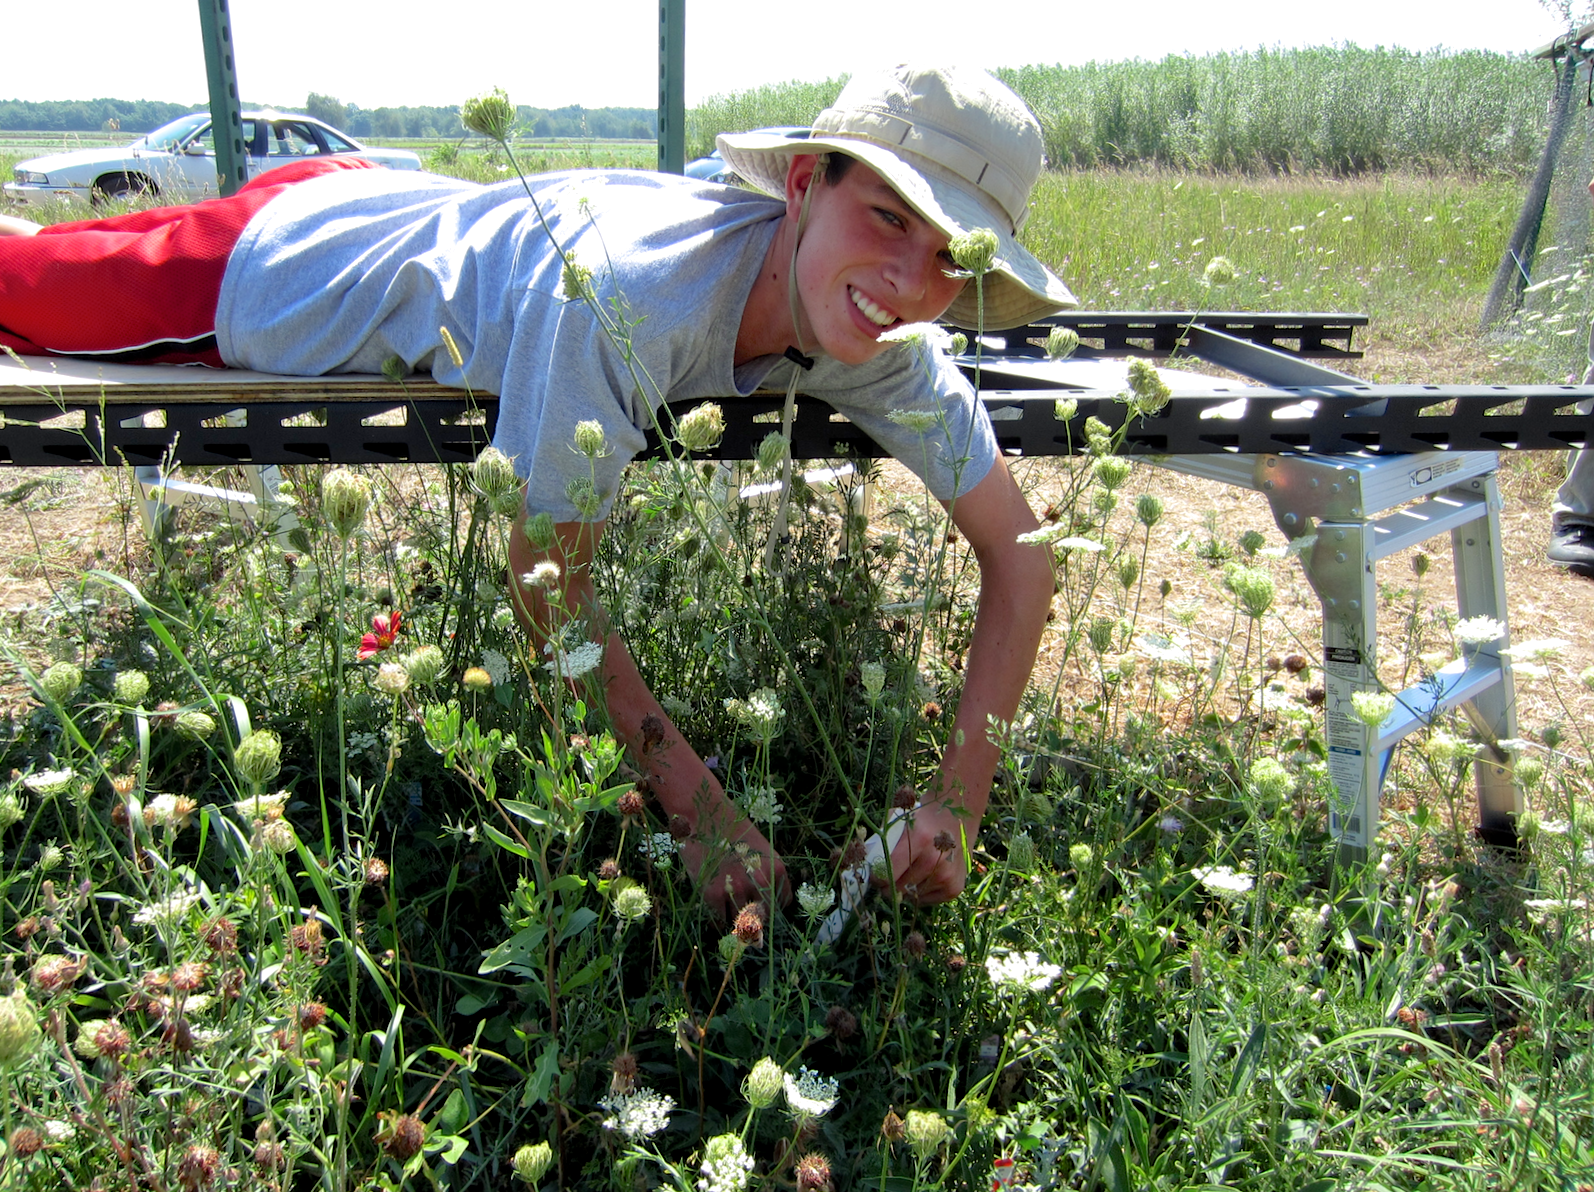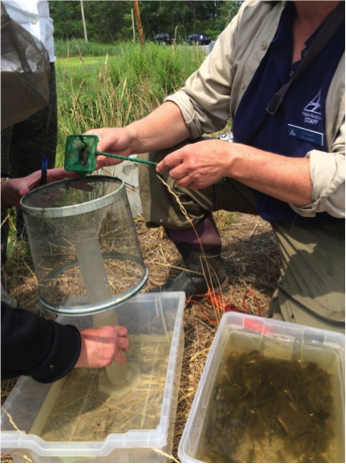
Collecting mummichogs and other fish out of research traps.
The activities are as follows:
- Teacher Guide
- Student activity, Graph Type A, Level 4
- Student activity, Graph Type B, Level 4
- Student activity, Graph Type C, Level 4
- Powerpoint – Views of the marsh and experiment
- Grading Rubric
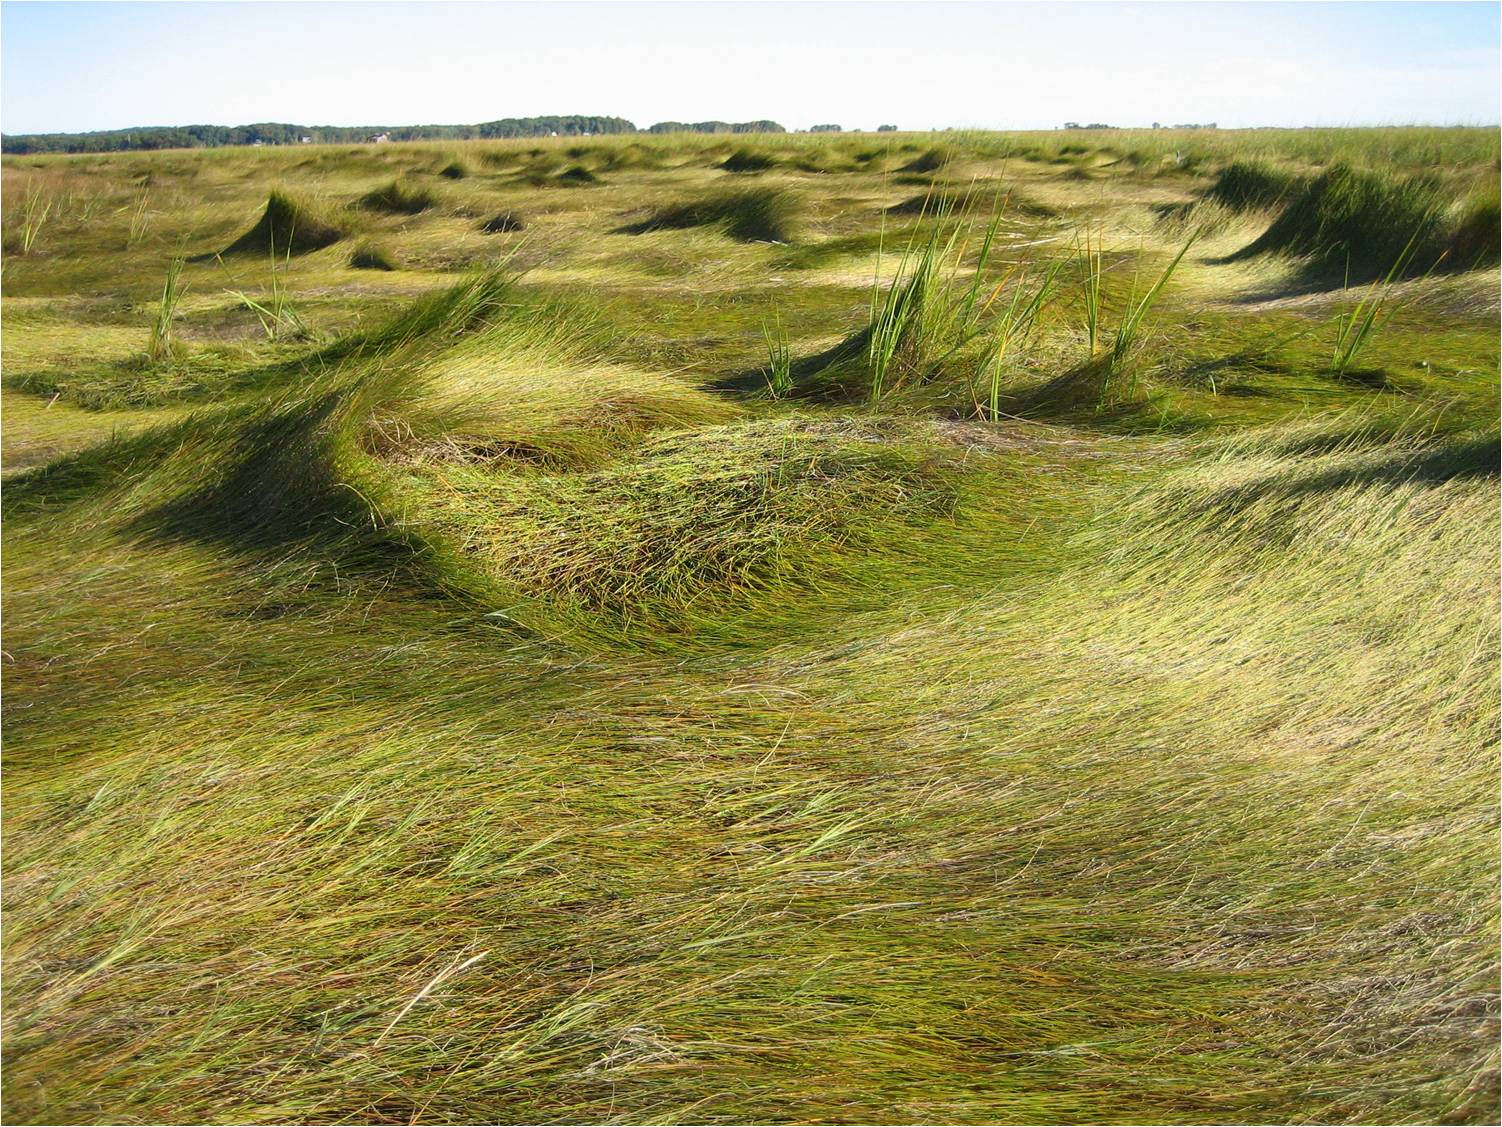
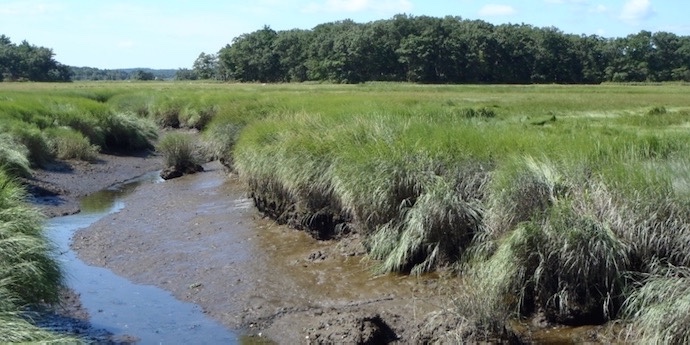
Salt marshes are important habitats and contain a wide diversity of species. These ecosystems flood with salt water during the ocean’s high tide and drain as the tide goes out. Fresh water also flows into marshes from rivers and streams. Many species in the salt marsh can be affected when the movement of salt and fresh water across a tidal marsh is blocked by human activity, for example by the construction of roads. These restrictions to water movement, or tidal restrictions, can have many negative effects on salt marshes, such as changing the amount of salt in the marsh waters, or blocking fish from accessing different areas.
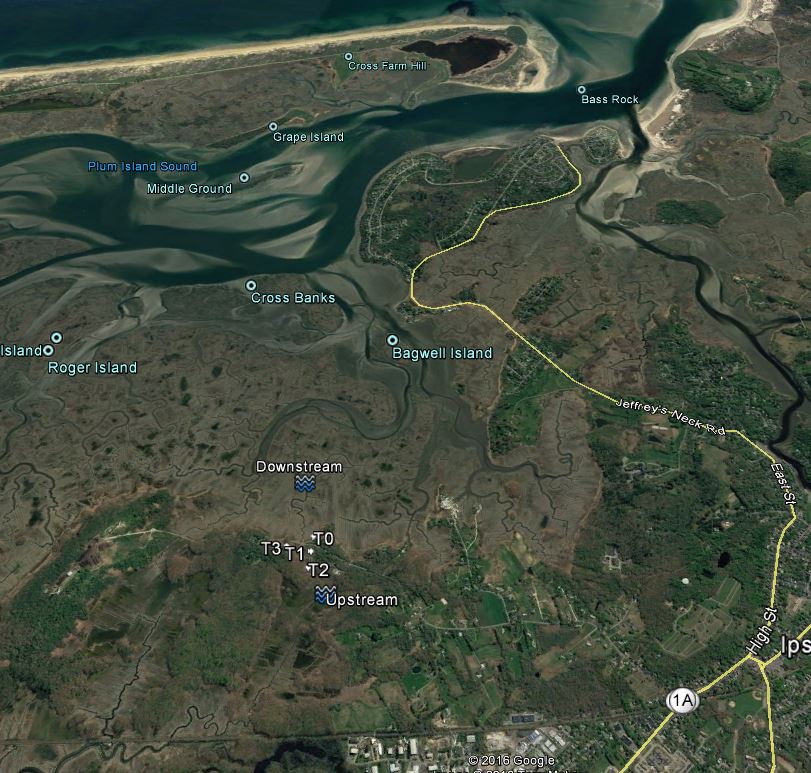
Local managers are working to remove tidal restrictions and bring back valuable habitat. At the same time, scientists are working to study how the remaining tidal restrictions impact fish populations. To do this, they measure the number of fish found upstream of tidal restrictions, which is the side connected to the river’s freshwater but cut off from the ocean when the restriction is in place. By taking measurements before and after the restriction is removed, scientists can study the impacts that the restriction had on fish populations
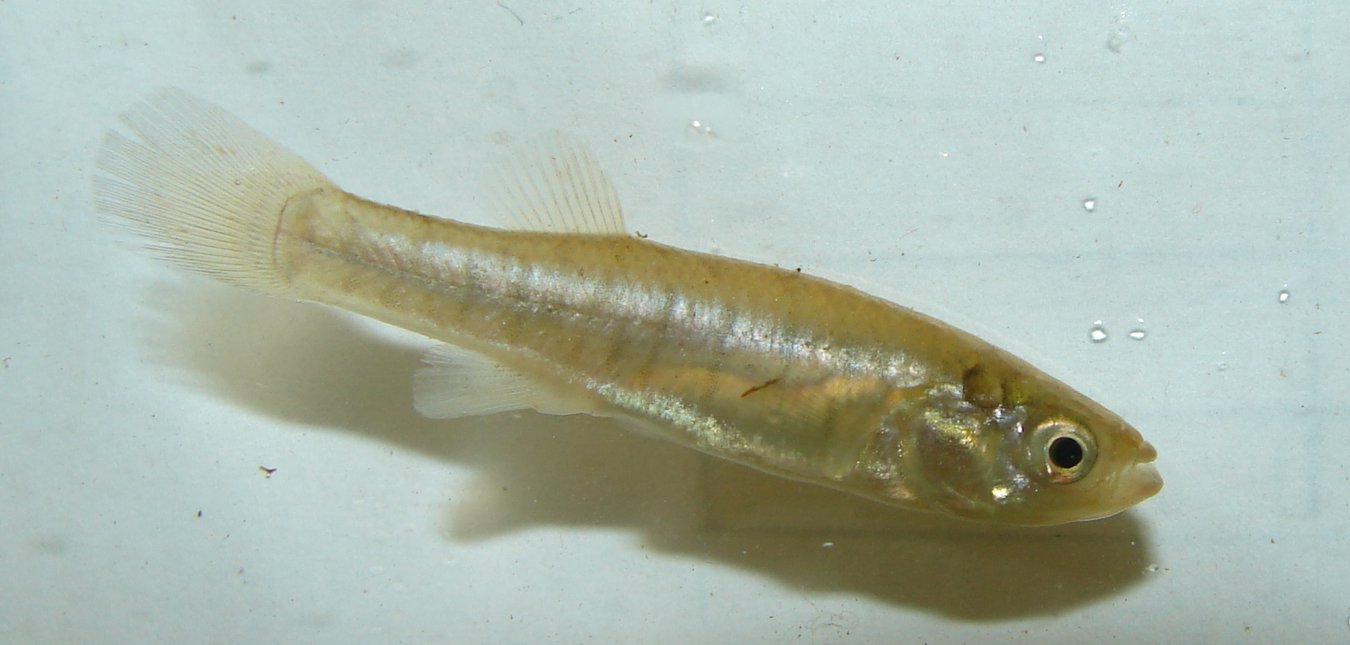
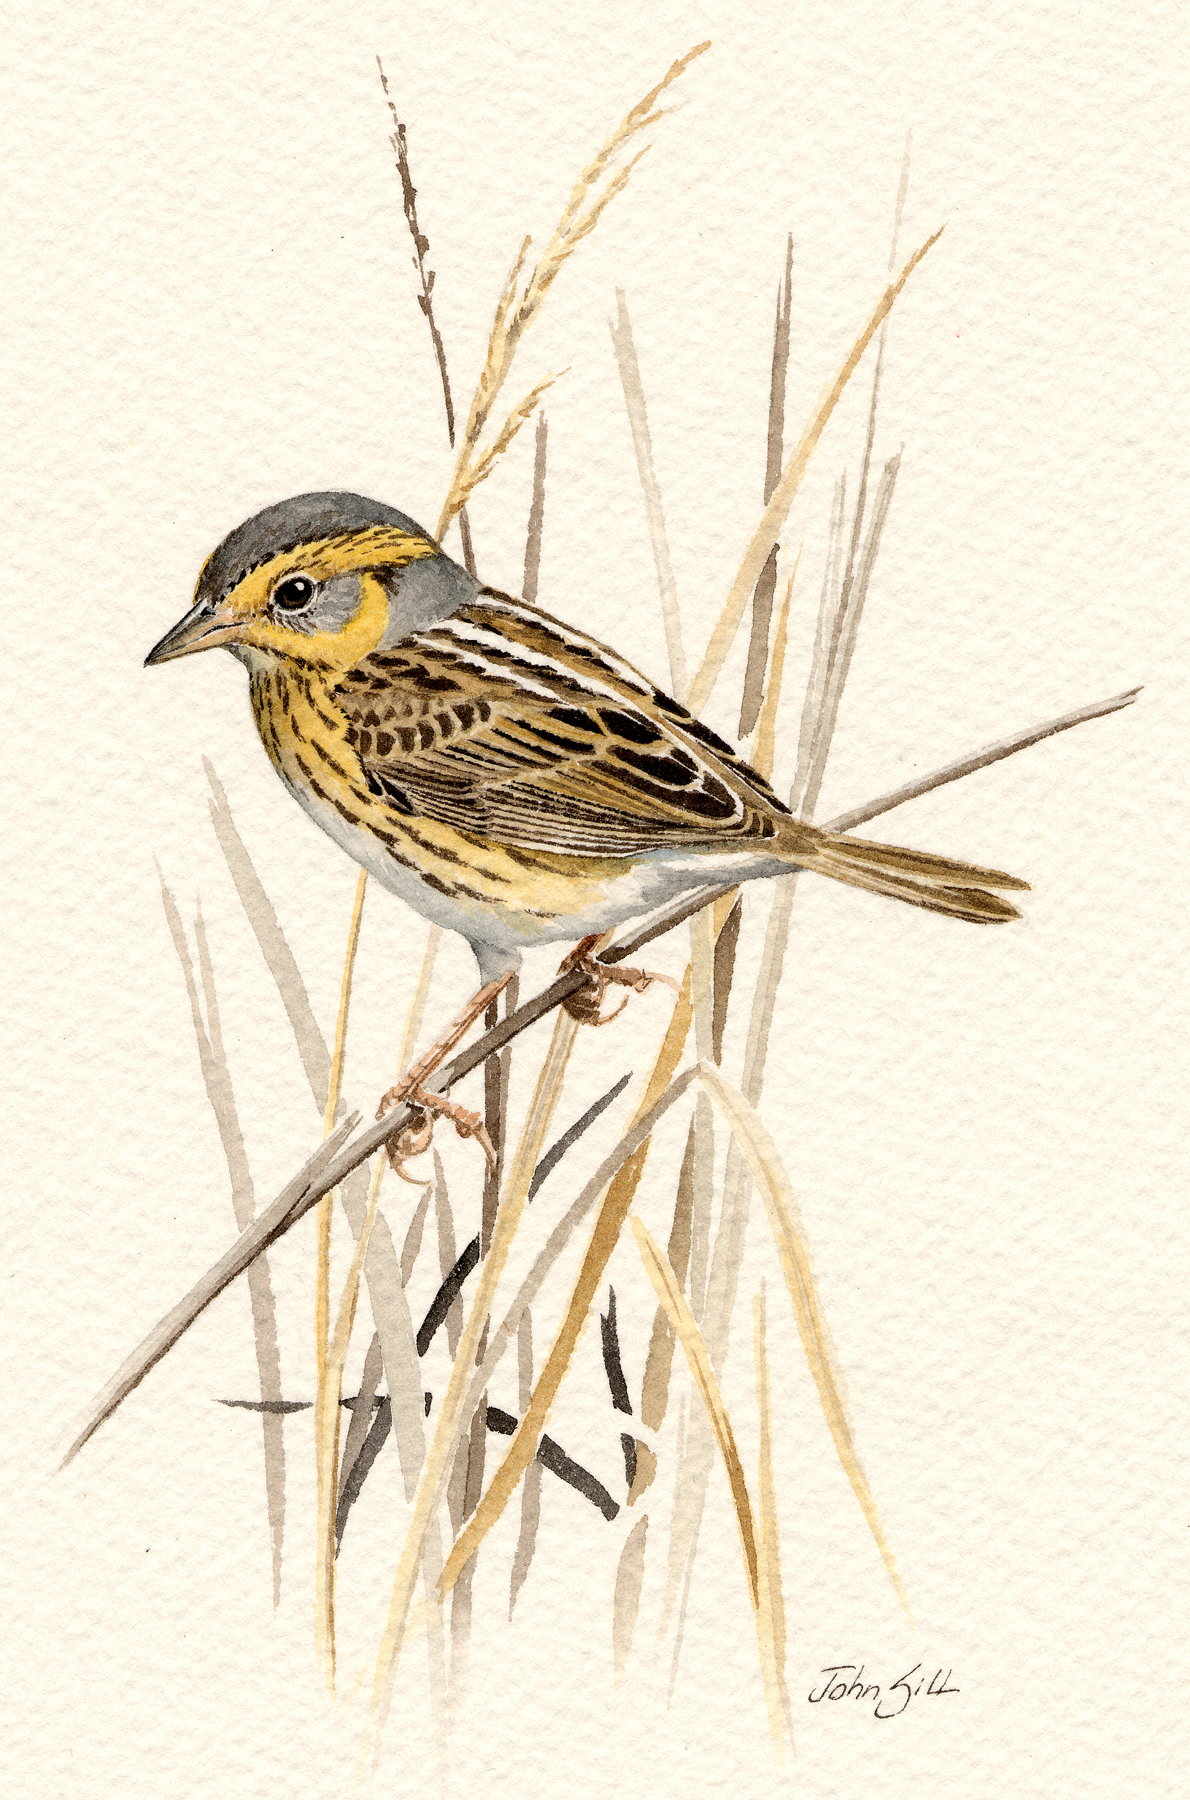
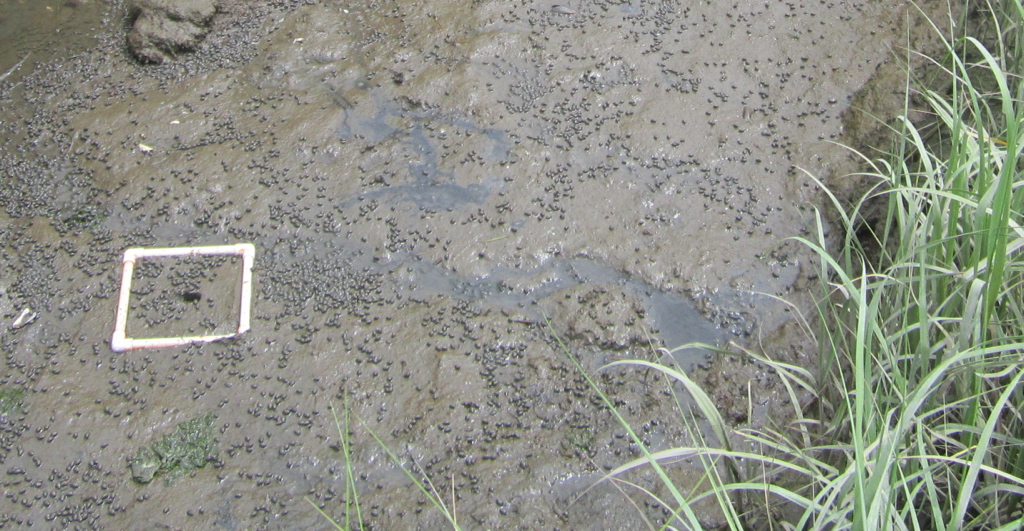
Mummichogs are a small species of fish that live in tidal marshes all along the Atlantic coast of the United States.
Mummichogs are a small species of fish that live in tidal marshes all along the Atlantic coast of the United States. They can be found in most streams and marsh areas and are therefore a valuable tool for scientists interested in comparing different marshes. The absence of mummichogs in a salt marsh is likely a sign that it is highly damaged.
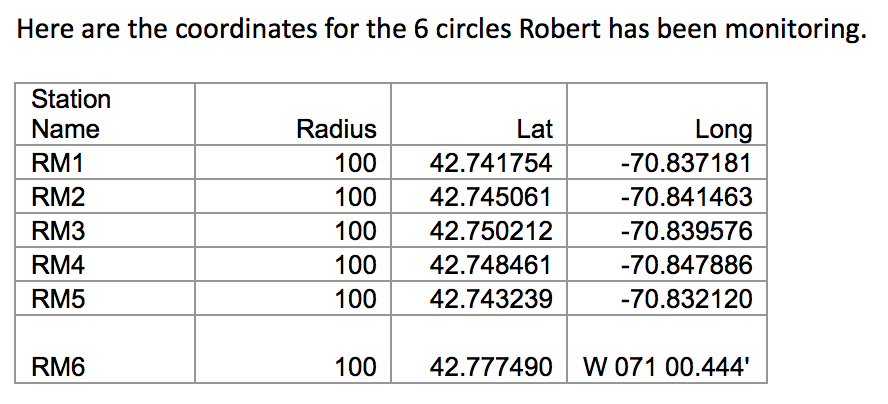
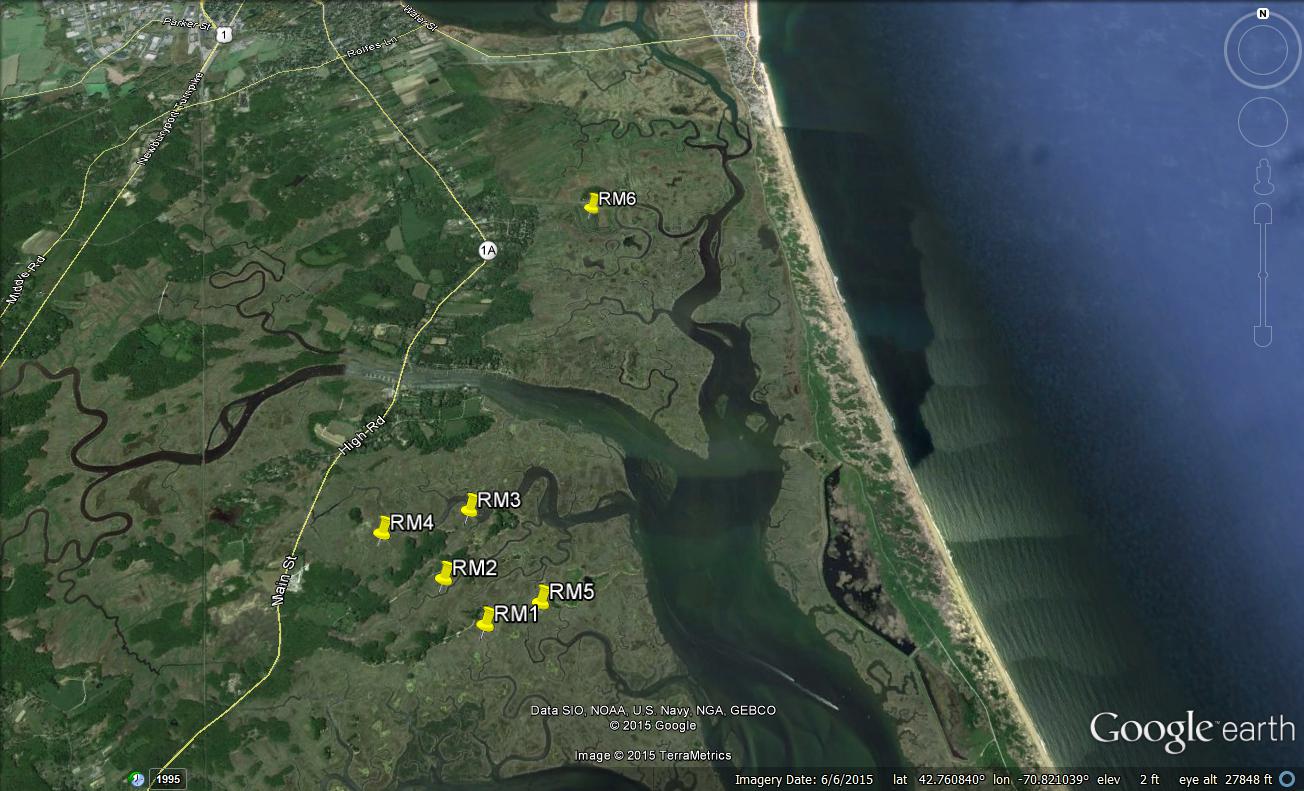
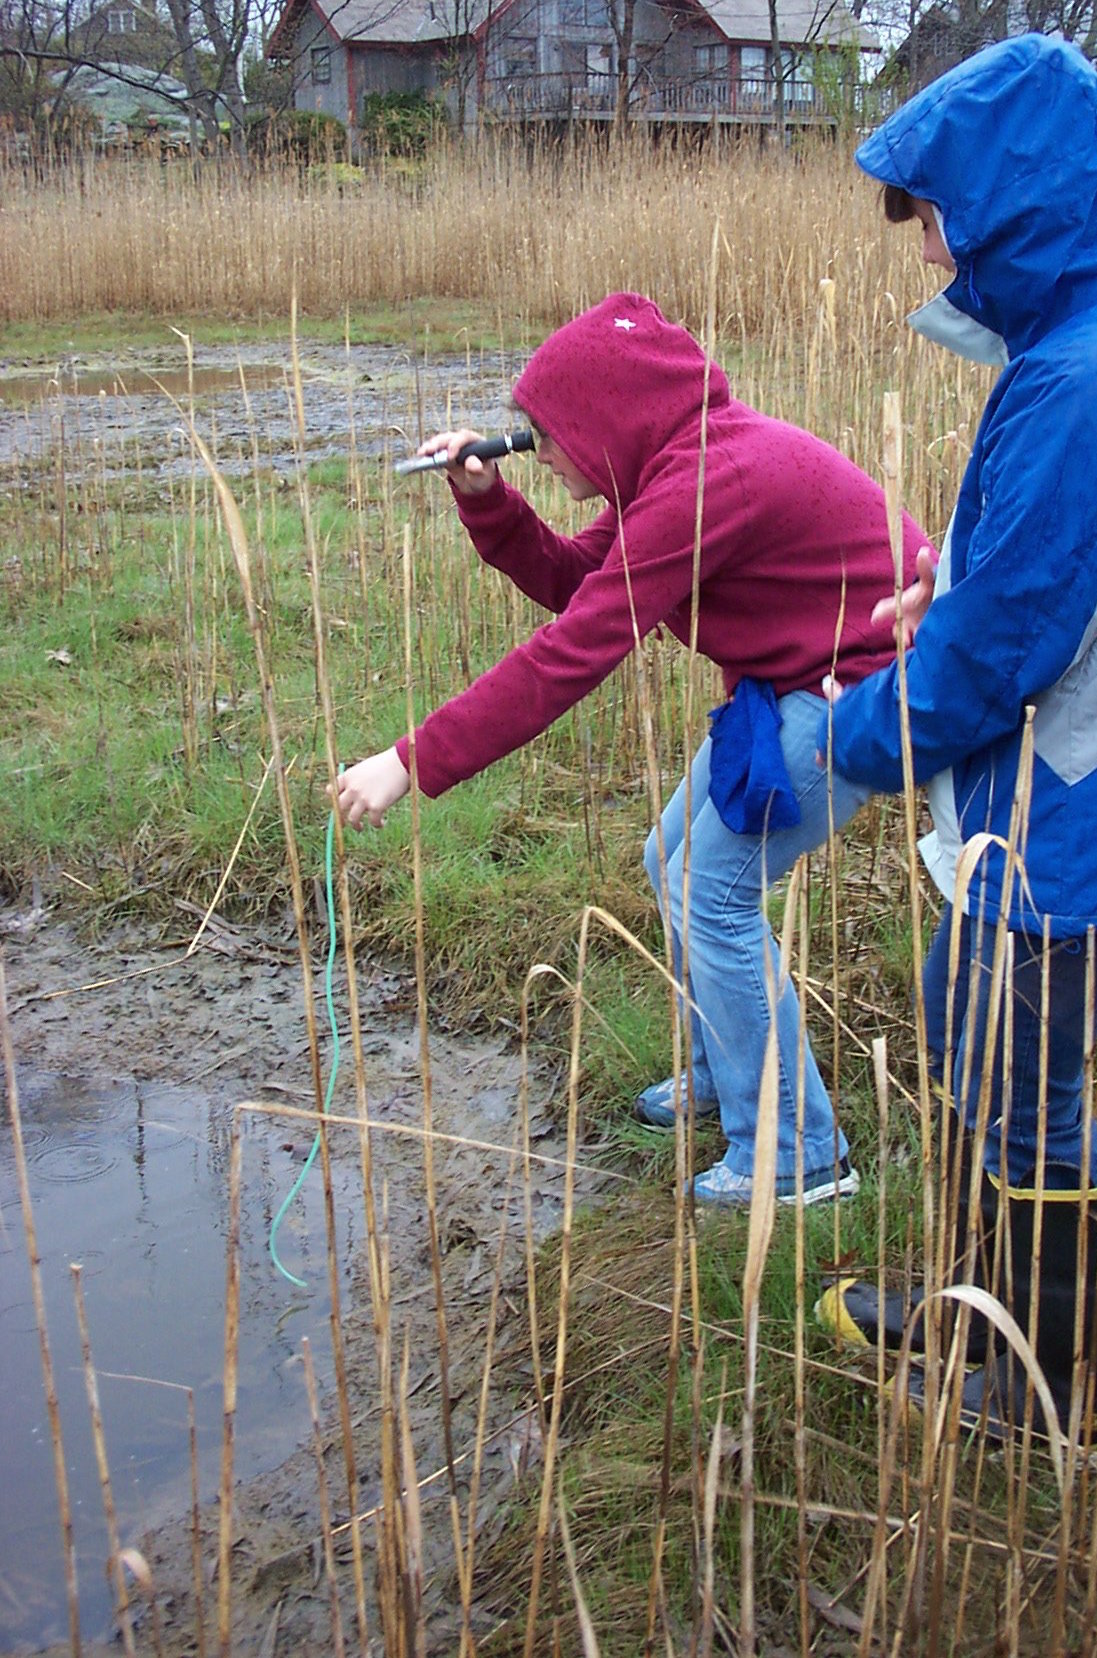
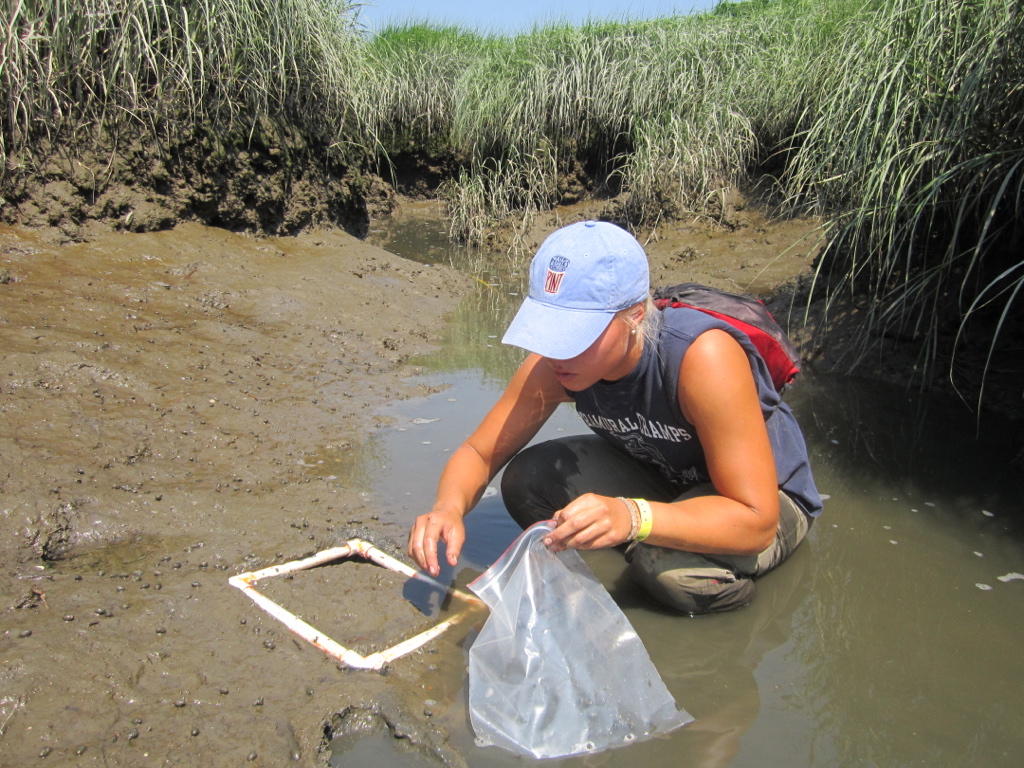
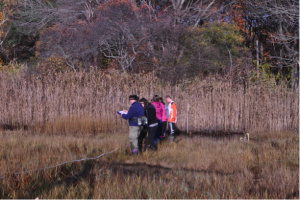
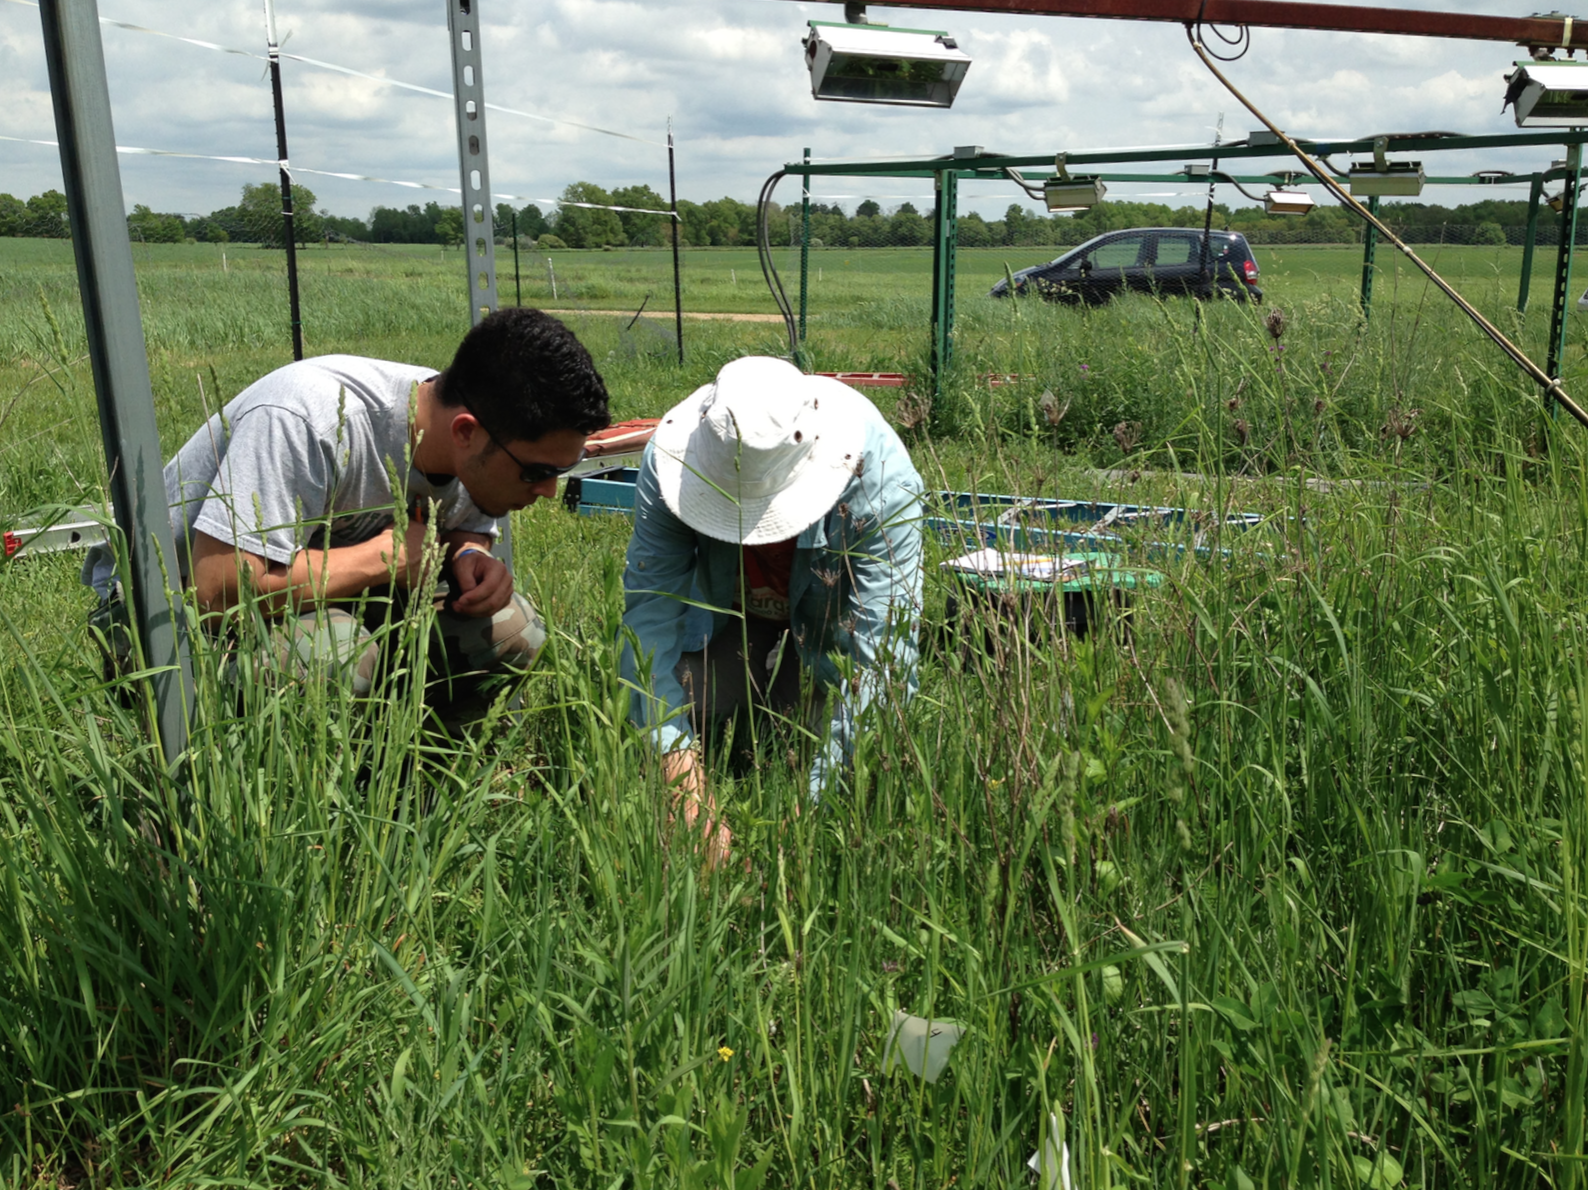
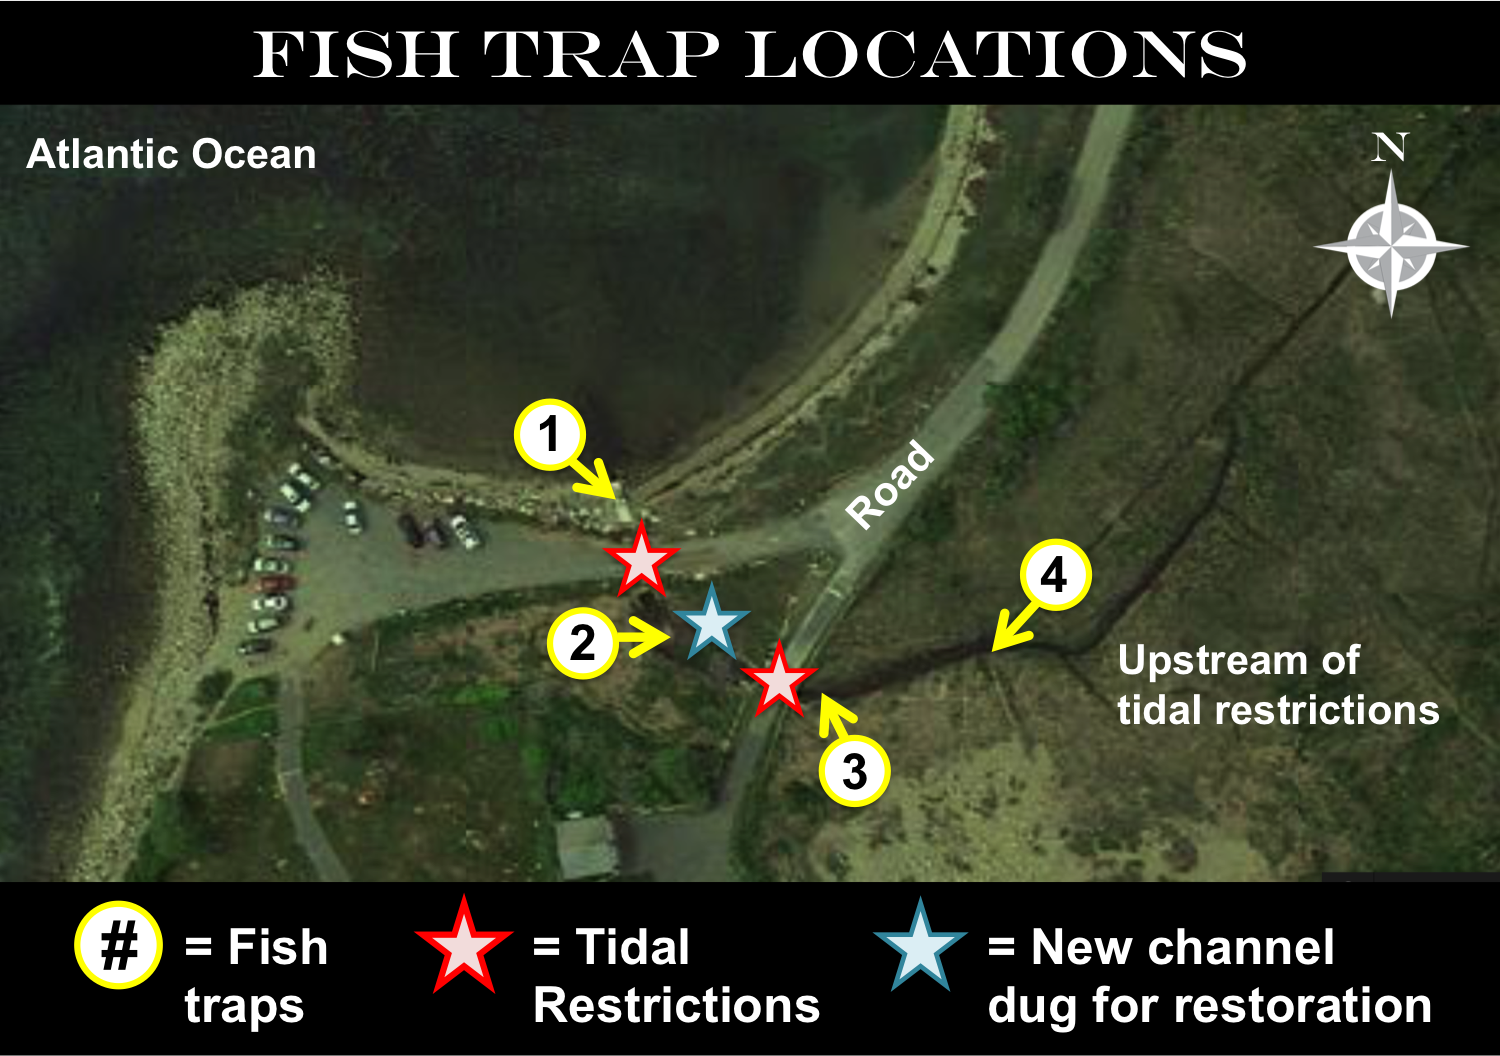
In Gloucester, MA, students participating in Mass Audubon’s Salt Marsh Science Project are helping Liz and Robert use mummichogs to examine the health of a salt march. In 2002 and 2003 Liz, Robert, and the students set traps upstream of a road, which was acting as a tidal restriction. These traps collected mummichogs and other species of fish. The day after they set the traps, the students counted the number of each fish species found in the traps.

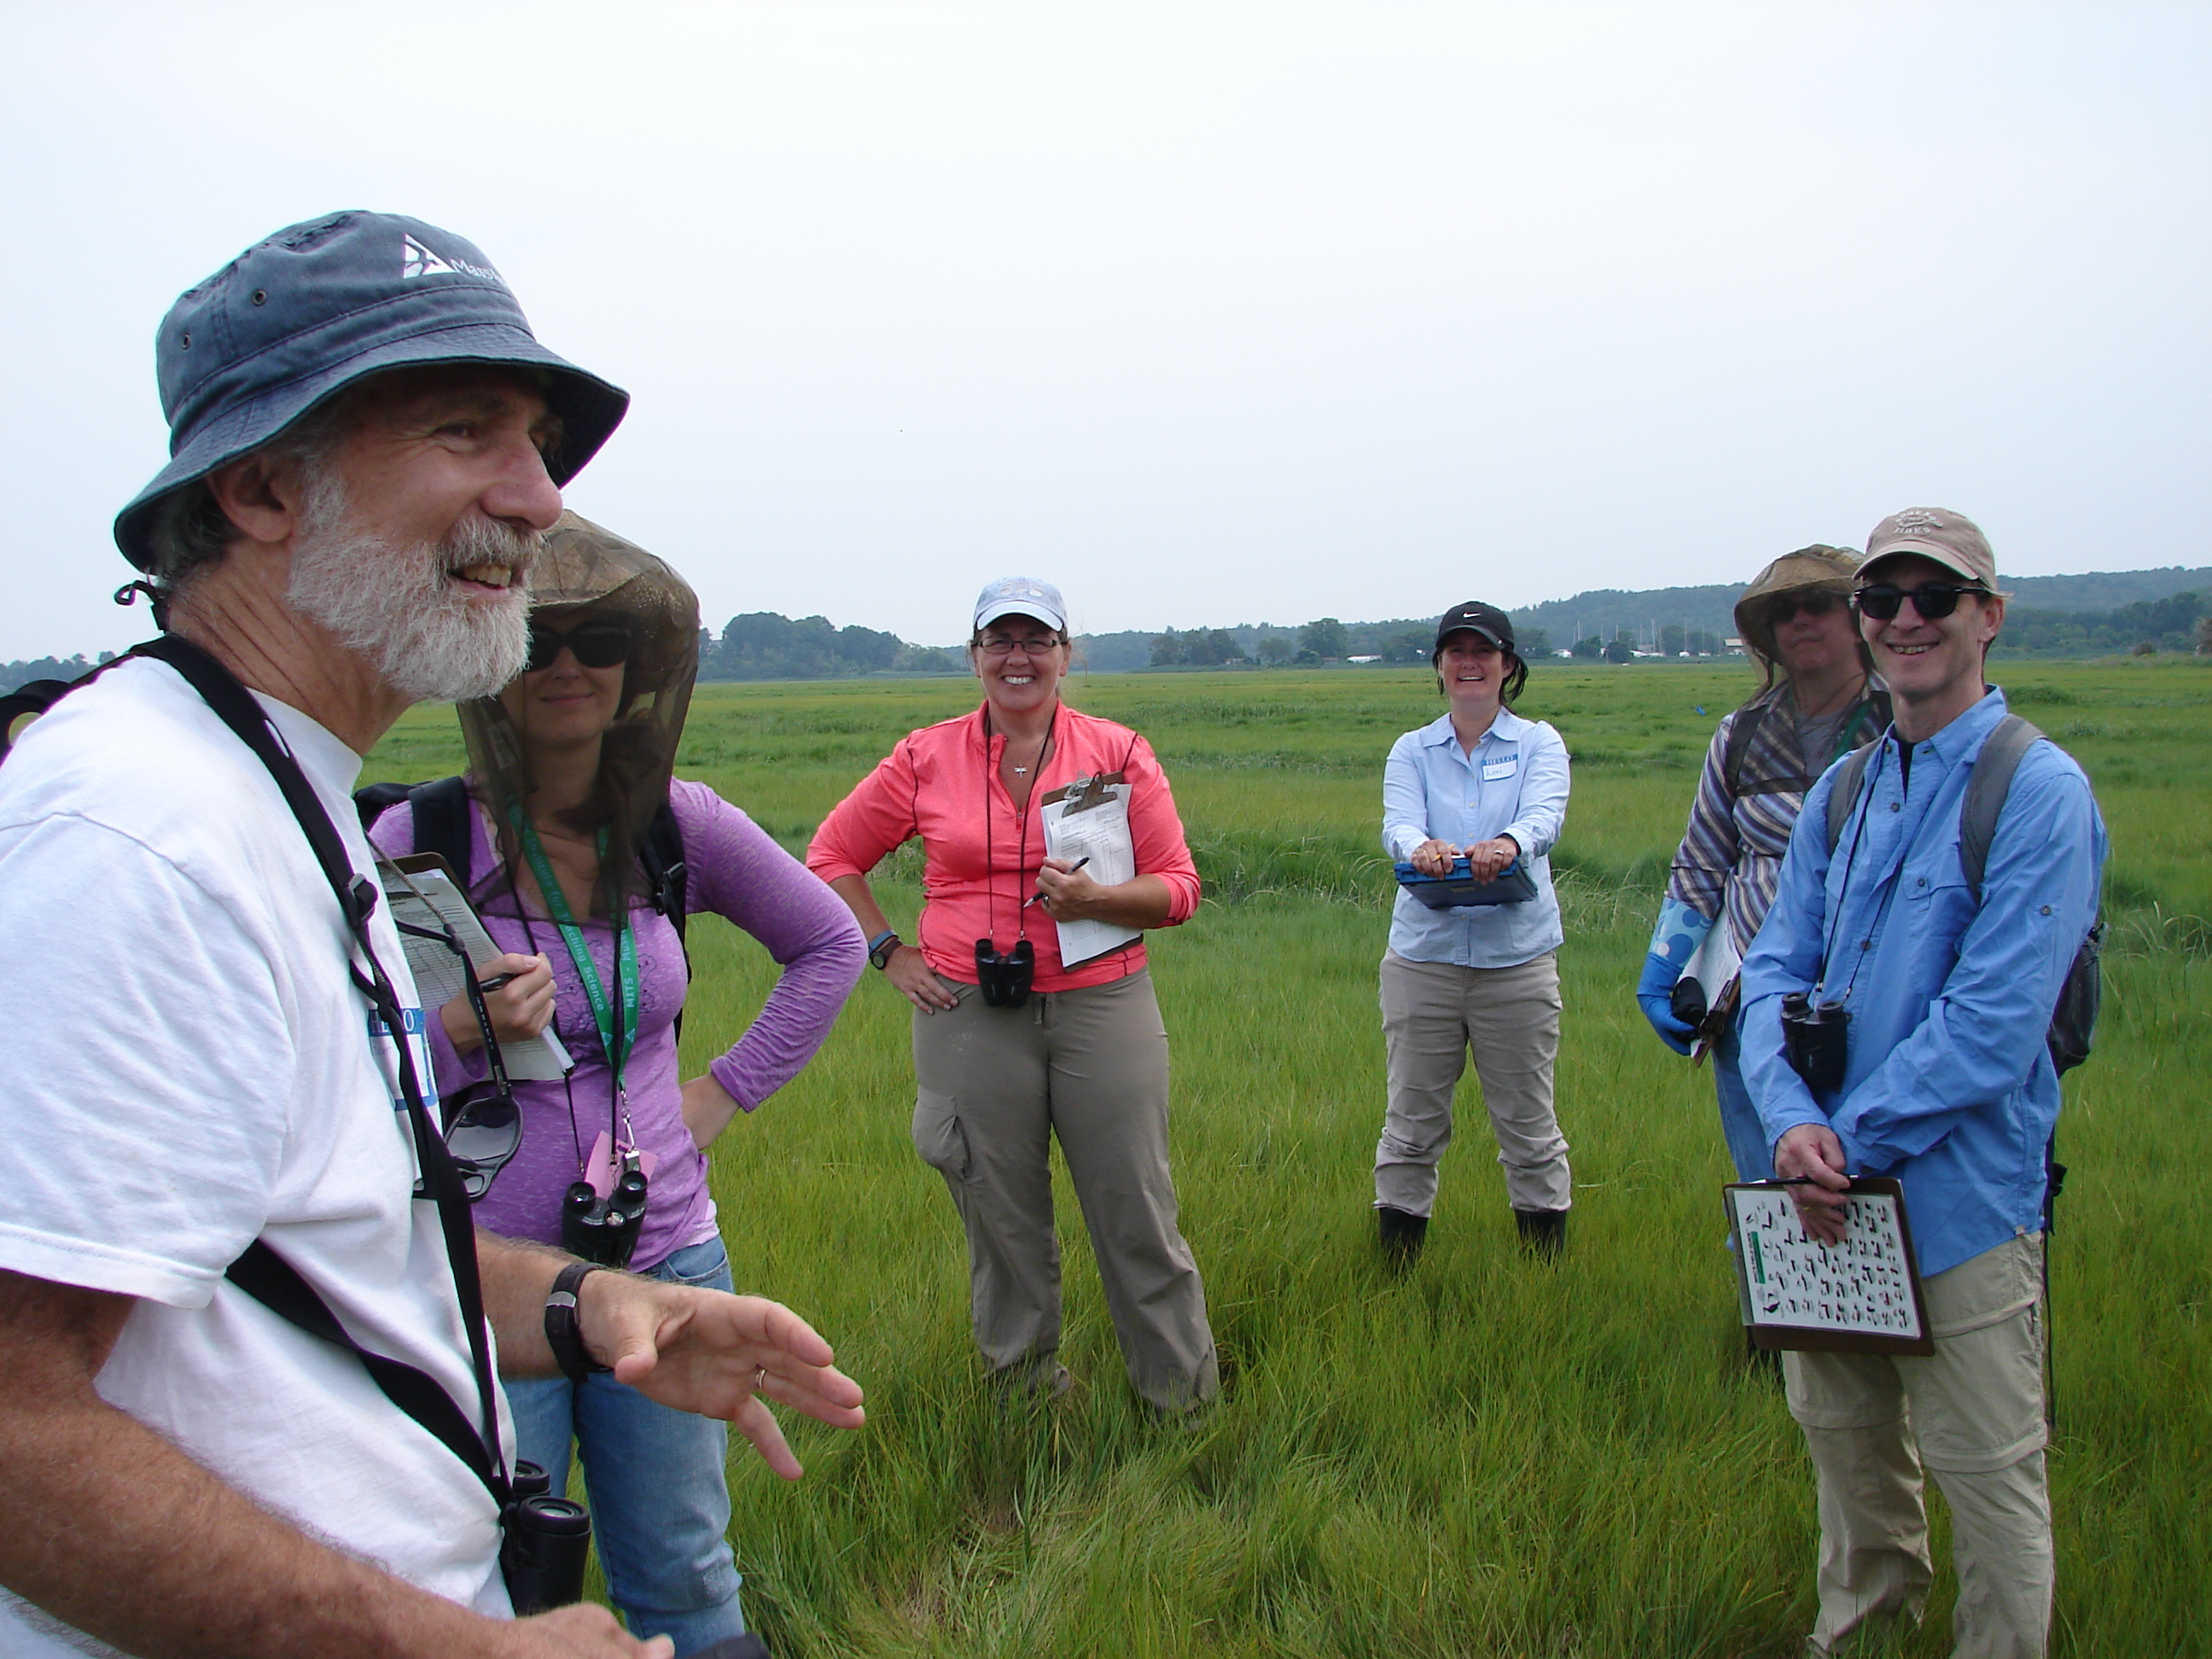
Students participating in Mass Audubon’s Salt Marsh Science Project Count fish at Eastern Point Wildlife Sanctuary, Gloucester, MA
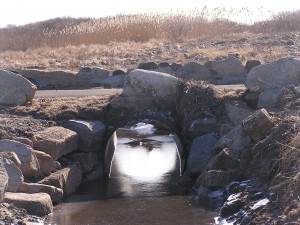
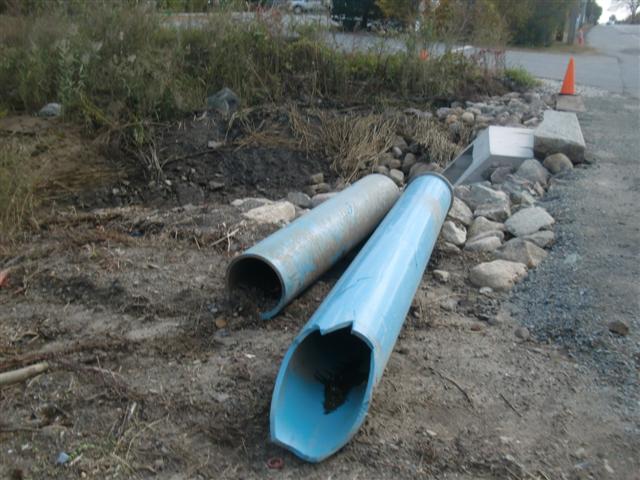
In December 2003, a channel was dug below the road to remove the tidal restriction and restore the marsh. From 2004 to 2007, students in the program continued to place traps in the same upstream location and collect data in the same way each year. Students then compared the number of fish from before the restoration to the numbers found after the restriction was removed. The students thought that once the tidal restriction was removed, mummichogs would return to the upstream locations in the marsh.
Featured scientists: Liz Duff and Robert Buchsbaum from Mass Audubon. Written by: Maria Maradianos, Samantha Scola, and Megan Wagner.
Flesch–Kincaid Reading Grade Level = 10.9
Additional teacher resources related to this Data Nugget:
- Data is available at Mass Audubon’s Salt Marsh Science websites on the Salt Marsh Science Project and their Fish Results & Data.
- This activity has been aligned to the NGSS and is listed on the NSTA website.
- To view images from the restoration, marsh, and data collection, check out our PowerPoint presentation to accompany this Data Nugget.
- This research was funded by the National Science Foundation as part of the Plum Island Ecosystems Long Term Ecological Research site.