“If it wasn’t for the geese, you and I would not be here today because our ancestors would not have made it. When long, hard winters emptied people’s food caches early, starvation loomed. Return of geese in April saved us.” – Chuck Hunt, born and raised on the Yukon-Kuskokwim Delta
Spring geese are an essential food source for subsistence communities like Chevak, Alaska. Elders in western Alaska Native communities have observed a decrease in geese returning to their villages over time. These changes affect the local communities and could also affect the local ecosystem.
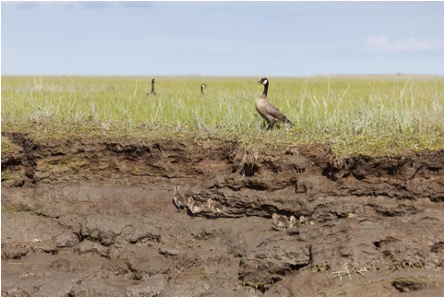
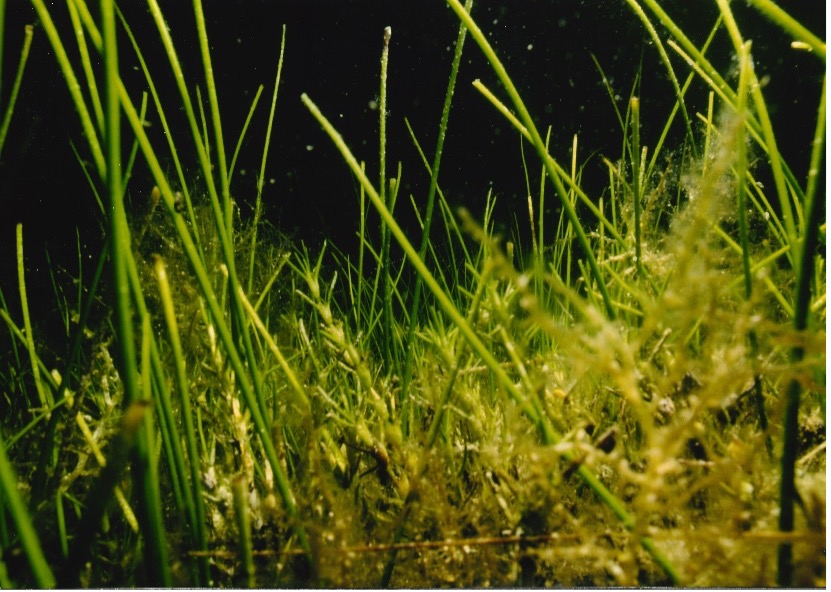
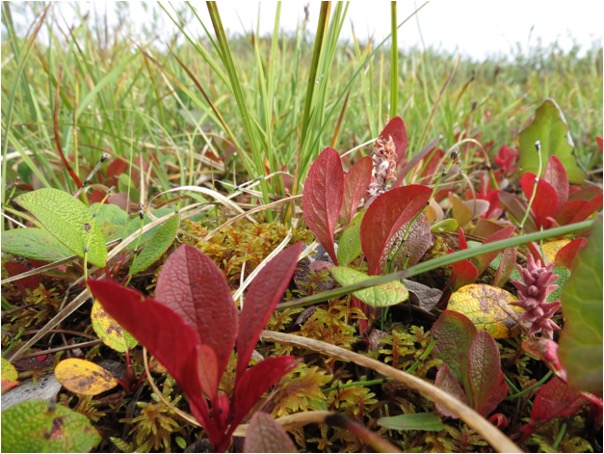
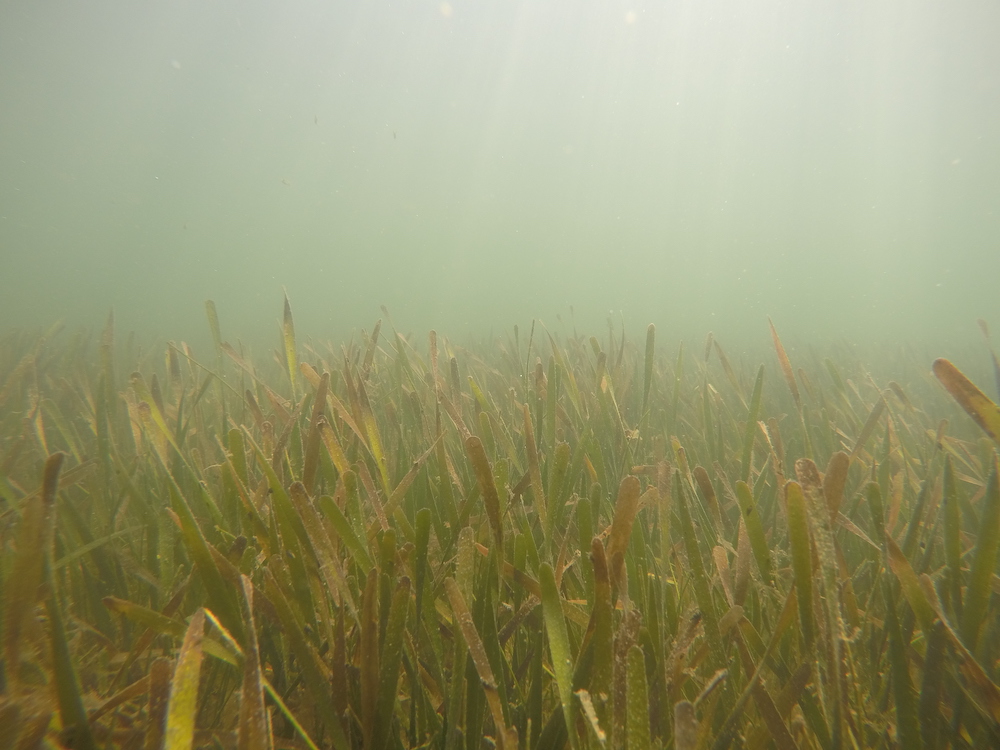
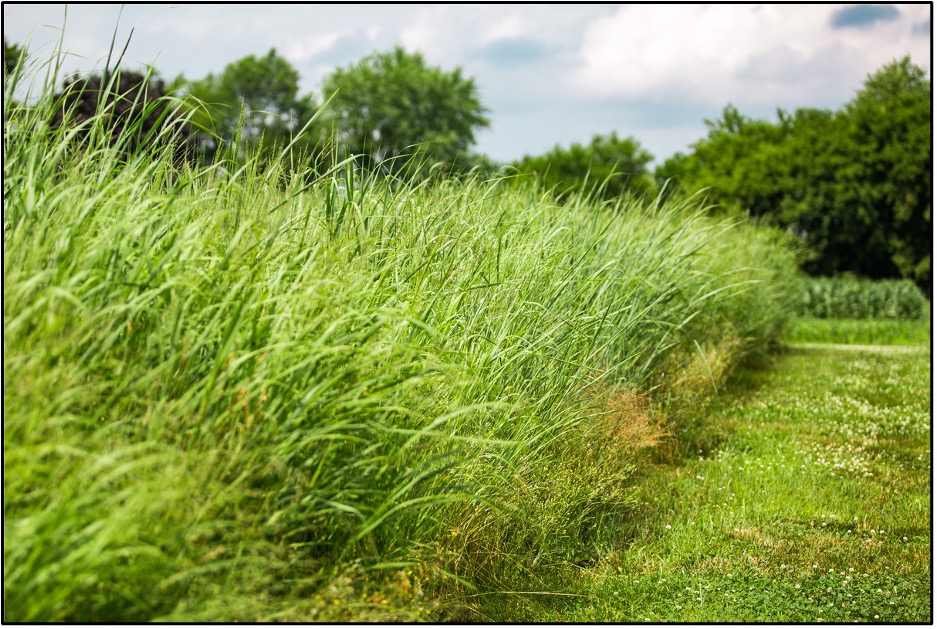
One way geese change their environment is by eating grass. In the Yukon-Kuskokwim Delta in western Alaska, birds from every continent on Earth migrate to this sub-Arctic habitat to lay their eggs and raise their young. Once they arrive, geese eat a ton of grass. They graze only in specific areas, called grazing lawns, leaving the rest of the vegetation alone.
When geese graze on wetland plants, they remove plant matter, potentially decreasing the amount of carbon dioxide, or CO2, that is absorbed during photosynthesis. As plants photosynthesize, they take CO2 from the atmosphere and turn it into glucose (a sugar) and oxygen. Gross primary production is the total amount of energy that plants capture from sunlight to grow and live before they use up some of that energy for themselves. Plants can slow climate change by removing CO2 from the atmosphere and turning it into plant matter, like leaves and roots.
Trisha is a scientist who became interested in ways that animals can affect the carbon cycle through their interactions with the environment. She wondered whether fewer geese returning to western Alaska could have global consequences that extend beyond remote communities. She thought that if geese ate enough grass, they may limit photosynthesis. This is important because it could change whether this ecosystem is a carbon sink or a carbon source. An ecosystem is called a carbon sink if it absorbs more CO2 through photosynthesis than it releases through respiration. Alternatively, an ecosystem can be a carbon source if more CO2 is released than absorbed. We want ecosystems to be carbon sinks because then they keep CO2 out of the atmosphere, where it contributes to global warming.
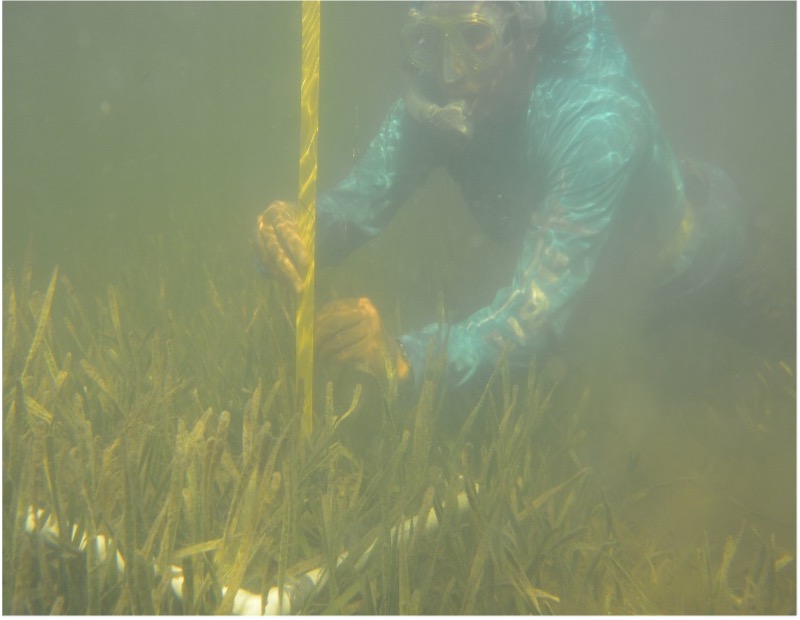
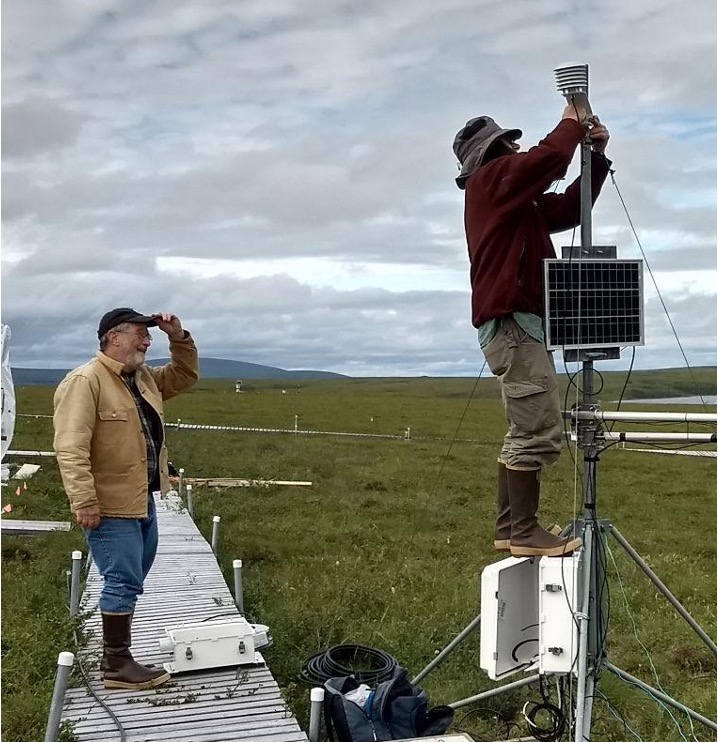
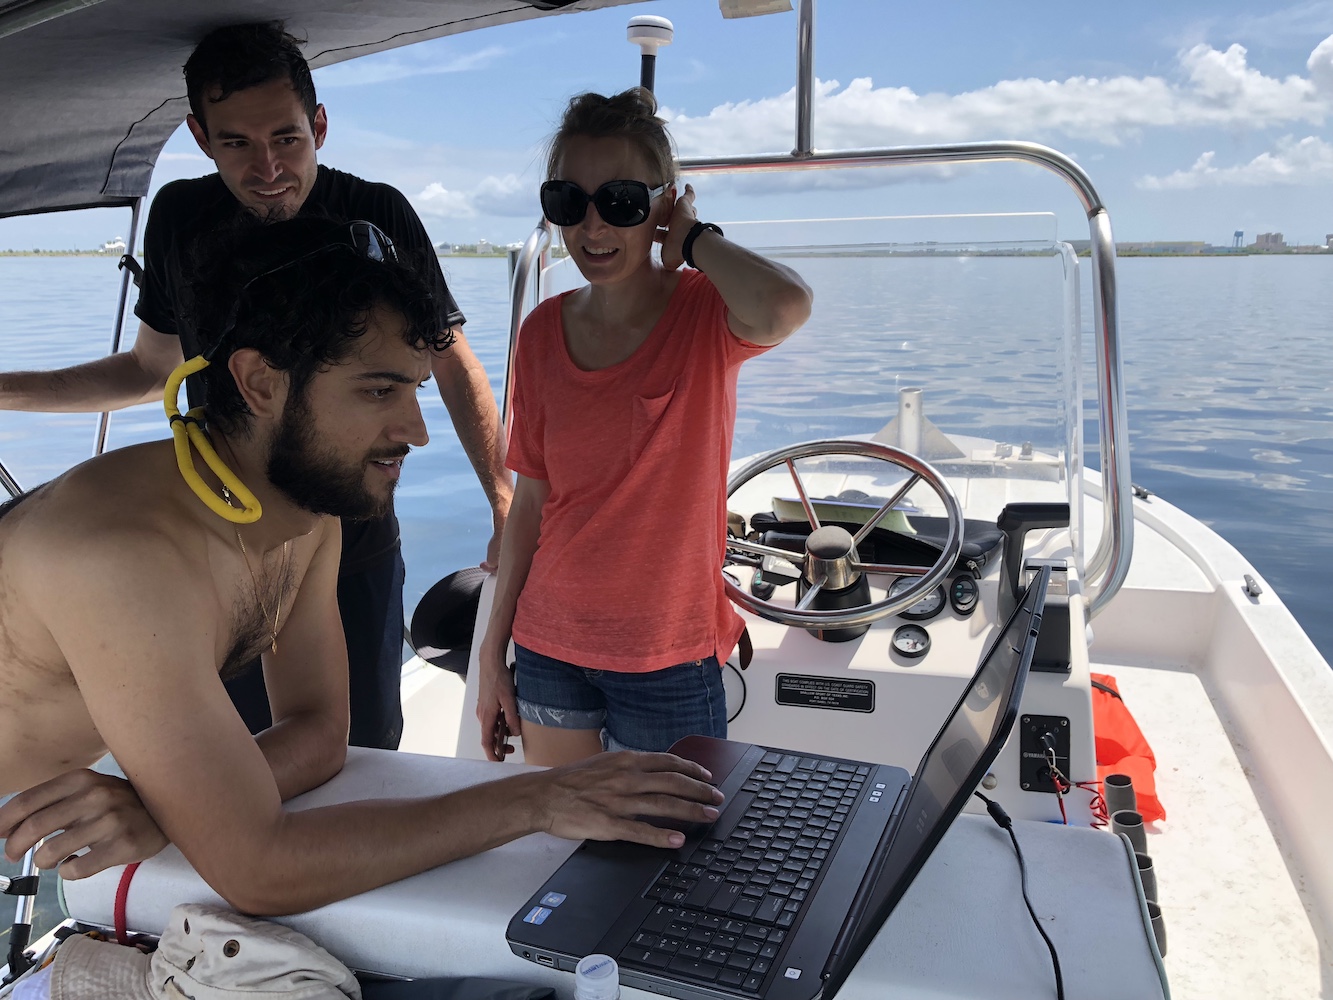
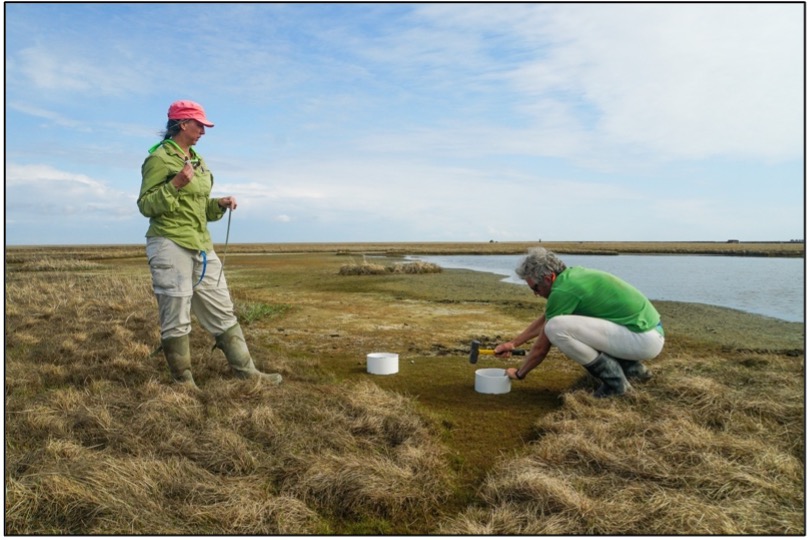
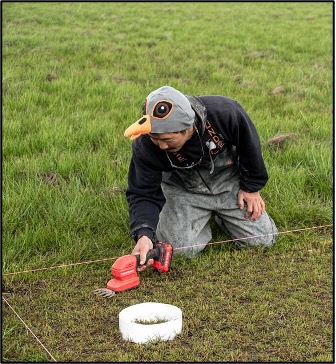
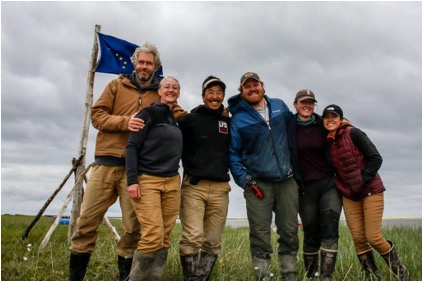
To test her idea, Trisha teamed up with fellow scientists Bonnie, Karen, and Jaron to take a closer look at how grazing grass influences whether the Y-K Delta ecosystem is releasing or absorbing CO2. To do their experiment they had to get creative. They considered getting a lot of geese, bringing them to an ungrazed area, and letting them chow down. However, it’s hard to capture geese and get them to graze exactly where you want. So instead, the research team simulated the effects of geese by cutting the grass to mimic nibbling and then gently vacuuming the pieces of grass to remove them.
The team set up six different experimental areas. Inside each area were two plots: one that was left ungrazed, and the other which was artificially grazed. The research team then used a piece of equipment called a LI-COR to measure the quantity of CO2 in the air above each plot. They recorded the CO2 levels during the day and night. The comparison from day to night is one way to look at gross primary production and respiration in a system. At night, when there is no light, plants can’t photosynthesize, so the detected CO2 will be from respiration. The levels during the day represent a combination of CO2 absorption by plants and release from respiration.
To assess whether the ecosystem is a carbon sink or source, we need to determine the difference between respiration and gross primary production, or net ecosystem exchange (NEE). A negative NEE means the ecosystem absorbs more CO2 than it emits. A positive NEE means the ecosystem is releasing more CO2 than it is absorbing. In this way, scientists classify an ecosystem as either a carbon sink that is storing carbon or a carbon source that is releasing carbon into the atmosphere.
Featured scientists: Trisha Atwood, Karen Beard, and Jaron Adkins from Utah State University and Bonnie Waring from Imperial College. Written by Andrea Pokrzywinski.
Flesch–Kincaid Reading Grade Level: 8.9
Additional teacher resources related to this Data Nugget:
Check out this website created by teacher Andrea who participated in the research and wrote this Data Nugget. You will find additional lesson plans, videos, slides, and articles to use in the classroom!
- PBS news article about this research
- Video on geese and the carbon cycle
- Birds, Plants, and Climate Transform the Y-K Delta
- Grazing, Trampling, and Fecal Deposition by Brant in the YK Delta
- Charlotte – A Gas Analyzer System on the Y-K Delta
- Interview with scientist Trisha Atwood
- Google Slides for more information on Carex, the genus of grass that these Arctic geese graze.