Collaborative cropping: Can plants help each other grow?

The activities are as follows:

Alfalfa (middle) planted in a Kernza® field.

Most of the crops grown on farms in the United States are annual plants, like corn, soybeans, and wheat. Annual plants die every year after harvest and must be replanted the following year. Preparing farm fields for replanting every year can erode soils and hurt important bacteria and fungi living in the soil.

One way to change how we produce food is to grow more perennial crops. Perennial plants live for many years and don’t need to be replanted. Perennials stay in the ground all year and start growing right away in the spring before annual crops are even planted. This early growth also gives perennial crops a “head-start” in competing with annual weed species that emerge later in the season.

While there are potential benefits of perennial crops, they are not commonly planted because they tend to make lower profits for farmers than annual crops. Crop scientists are still examining potential options to make perennial crops work at a large scale for farmers. For twenty years, researchers at The Land Institute in Kansas and at the University of Minnesota have been looking at a new perennial grain, called Kernza®, that could be used as an alternative to wheat and rye annual crops. Kernza® comes from the seeds of a plant called intermediate wheatgrass. Because Kernza® is such a new crop, scientists still have a lot to learn about it. Before it can be widely used by farmers, they want to know what field conditions help the plants grow to ensure the crop makes money for farmers.

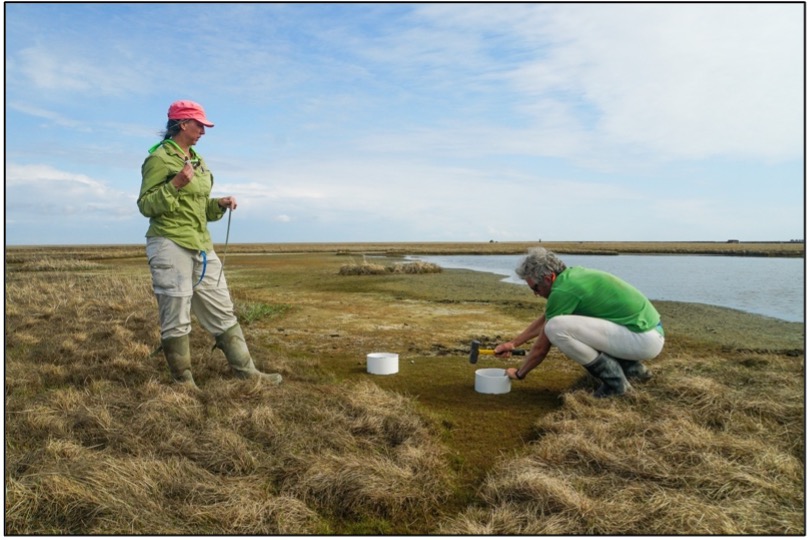
Dr. Jake Jungers taking a soil core in a Kernza® field.

One strategy to improve field conditions for perennial crops is to plant legumes in the field alongside them. Legumes can make nitrogen, a nutrient that plants need to grow, more available to the plants around them. Additionally, farmers can select legume species that typically don’t compete with the crop but may outcompete weeds.

Jake is an ecologist who uses his knowledge about plants to make agriculture more sustainable. Jake wanted to do some research into alfalfa, a type of perennial legume that might work well with Kernza®. Jake thought that growing alfalfa alongside Kernza® would lead to increased profit and yield for two reasons. One, because it would add nitrogen to the soil to boost crop growth. Two, because alfalfa would compete with agricultural weed species, making valuable resources available for the crop plants.

To test this idea, Jake set up an experiment with his team. Alfalfa was grown with Kernza® at three different locations in Minnesota in 2019. The study was replicated four times at each site, with the same amount of alfalfa and Kernza® planted into each field. At the end of the growing season, the fields were harvested, and the plants were sorted into three categories: Kernza®, alfalfa, and weed species. He further sorted Kernza® by grain, which can be used for food, and straw, which can be used for animal feed. Jake wanted to compare yield, or plant growth per unit area, across the plant categories. To do this, he weighed all the plants in each category to get the biomass and then divided by the area of the field.

Featured scientist: Jake Jungers (he/him) from the University of Minnesota

Written by Claire Wineman (she/her)

Flesch–Kincaid Reading Grade Level = 8.5

Surviving the flood

Andrew writing down field notes in an urban stream.

The activities are as follows:

When imagining a stream, you may think of pristine water flowing through a forest or mountain valley. However, streams are found everywhere, including cities. Many of these urban streams run through a pipe, disappear underground, or are filled with water that doesn’t seem to be moving. These streams are often overlooked because they appear more like deep ditches or canals, but they play an important role in water management.

When rain falls in a forest, it flows through the soil, moving in the small spaces between soil particles. Eventually, it reaches a stream. This journey slows the water and prevents flooding. However, when rain falls in an urban area, it often does not move through soil before getting to a stream. Urban streams are instead surrounded by buildings, roads, and parking lots. Water races over these surfaces, causing rapid flooding. This water, called stormwater runoff, can cause a stream to go from ankle-deep to over your head in just a few hours!

A team of stream ecologists, including graduate student Andrew and his advisor Dave, wanted to see whether stormwater floods disturb urban stream ecosystems. Urban streams provide important habitat for many species – fish, insects, crustaceans, bacteria, and algae. Andrew and Dave have observed how large stormwater floods can sweep algae off rocks or bury algae with sediment that is washed in from parking lots. However, algae and other organisms in urban streams are used to living in a habitat with frequent disturbance and can cling to the rocks during small floods.

Andrew downloading data from the data loggers.

Andrew and Dave focused their research on algae because they are an important part of aquatic ecosystems. Algae use energy from sunlight and building blocks from carbon dioxide gas to create sugar and oxygen. This process is called photosynthesis. By photosynthesizing during the day and not at night, algae cause large changes in the amount of oxygen in stream water. Taking a closer look at these daily oxygen changes, you can see how well algae are doing and how healthy a stream is.

Andrew and Dave monitored daily changes in the stream by using sensors that collect oxygen concentrations every 10 minutes.

Andrew and Dave also needed to measure the intensity of flooding during different kinds of storms. They used a measure called discharge, which accounts for both the amount of water flowing in a stream and how fast it’s moving. During a rain event, the time when the most water at the highest speed is rushing through the stream is called the peak discharge. For this measure, Andrew and Dave had some help from the United States Geological Survey, which has instruments in streams and rivers all over the country measuring discharge all the time. Looking at this dataset, Andrew detected a total of 13 storm events of different sizes during a one-year study period.

When the peak discharge is very high, the fast-moving water and flooding disturb algae by sweeping them off rocks and other surfaces, sending them downstream with the flow of water, and the algae are unable to photosynthesize. To answer their question, they looked at the oxygen concentrations for the day leading up to and following the 13 storms that Andrew identified. The difference in oxygen produced by algae before and after storms is a simple way to look at whether the algae resist the flooding or are disturbed by the flooding. If the oxygen concentration is the same after the storm as it was before the storm, the algae were resistant. If oxygen is lower after the storm than before the storm, that means that the algae were disturbed. Andrew and Dave thought that intense storms with high discharge will disrupt the algae more, resulting in lower oxygen concentrations after a storm than before a storm.

Featured scientists: Andrew Blinn (he/him) and Dave Costello (he/him) from Kent State University

The research and data found in this activity come from the STORMS project, which investigates how stormwater management decisions influence hydrology and stream health in tributaries of the Cuyahoga River Watershed of Ohio.

Flesch–Kincaid Reading Grade Level = 10.3

Additional teacher resources related to this Data Nugget include:

Benthic buddies

Danny and Kaylie sampling benthic animals

The activities are as follows:

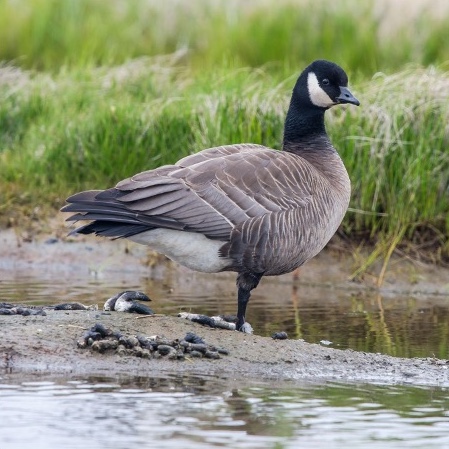
Lagoons are areas along the coast where a shallow pocket of sea water is separated from the ocean most of the time. During some events, like high tides, the ocean water meets back up with the lagoon. Coastal lagoons are found all over the world – even in the most northern region of Alaska, called the High Arctic!

These High Arctic lagoons go through many extreme changes each season. In April, ice completely covers the surface. The mud at the bottom of the shorelines is frozen solid. In June, the ice begins to break up and the muddy bottoms of the lagoons begin to thaw. The melting ice adds freshwater to the lagoons and lowers the salt levels. In August, lagoon temperatures continue to rise until there is only open water and soft mushy sediment.

You would think these harsh conditions would make High Arctic lagoons not suitable to live in. However, these lagoons support a surprisingly wide range of marine organisms! Marine worms, snails, and clams live in the muddy sediment of these lagoons. This habitat is also called the bottom, or benthic, environment. Having a rich variety of benthic animals in these habitats supports fish, which migrate along the shoreline and eat these animals once the ice has left. And people who live in the Arctic depend on fishing for their food.

Ken, Danny, and Kaylie are a team of scientists from Texas interested in learning more about how the extreme seasons of the High Arctic affect the marine life that lives there. They want to know whether the total number of benthic species changes with the seasons. Or does the benthic community of worms, snails, and clams stay constant throughout the year regardless of ice, freezing temperatures, and large changes in salt levels? The science team thought that the extreme winter conditions in the Arctic lagoons cause a die-off each year, so there would be fewer species found at that time. Once the ice melts each year, benthic animals likely migrate back into the lagoons from deeper waters and the number of species would increase again.

Ken, Danny, and Kaylie had many discussions about how they could answer their questions. They decided the best approach would be to travel to Alaska to take samples of the benthic animals. To capture the changes in lagoon living conditions, they would need to collect samples during the three distinct seasons.

Benthic organisms from a sample

The science team chose to sample Elson Lagoon because it is in the village of Utqiaġvik, Alaska and much easier to reach than other Arctic lagoons. They visited three times. First, in April, during the ice-covered time, again in June when the ice was breaking up, and a final time in summer when the water was warmer. In April, they used a hollow ice drill to collect a core sample of the frozen sediment beneath the ice. In June and August, they deployed a Ponar instrument into the water, which snaps shut when it reaches the lagoon bottom to grab a sample. Each time they visited the lagoon, they collected two sediment samples.

Back in the lab, they rinsed the samples with seawater to remove the sediment and reveal the benthic animals. The team then sorted and identified the species present. They recorded the total number of different species, or species richness, found in each sample.

Featured scientists: Ken Dunton, Daniel Fraser, and Kaylie Plumb from the University of Texas Marine Science Institute

Written by: Maria McDonel from Flour Bluff and Corpus Christi Schools

Flesch–Kincaid Reading Grade Level = 8.9

Additional teacher resources related to this Data Nugget include:

Does more rain make healthy bison babies?

A bison mom and her calf.

The activities are as follows:

The North American Bison is an important species for the prairie ecosystem. They are a keystone species, which means their presence in the ecosystem affects many other species around them. For example, they roll on the ground, creating wallows. Those wallows can fill up with water and create a mini marsh ecosystem, complete with aquatic plants and animals. They also eat certain kinds of food – especially prairie grasses. What bison don’t eat are wildflowers, so where bison graze there will be more flowers present than in the areas avoided by bison. This affects many insects, especially the pollinators that are attracted to the prairie wildflowers that are abundant in in the bison area. 

Not only do bison affect their environment, but they are also affected by it. Because bison eat grass, they often move around because the tastiest meals might be scattered in different areas of the prairie. Also, as bison graze down the grass in one area they will leave it in search of a new place to find food. The amount of food available is largely dependent upon the amount of rain the area has received. The prairie ecosystem is a large complex puzzle with rain and bison being the main factors affecting life there. 

The Konza Prairie Biological Station in central Kansas has a herd of 300 bison. Scientists study how the bison affect the prairie, and how the prairie affects the bison. Jeff started at Konza as a student, and today he is the bison herd manager. As herd manager, if is Jeff’s duty to track the health of the herd, as well as the prairie. 

One of the main environmental factors that affect the prairie’s health is rainfall. The more rain that falls, the more plants that grow on the prairie. This also means that in wetter years there is more food for bison to eat. Heavier bison survive winters better, and then may have more energy saved up to have babies in the following spring. Jeff wanted to know if a wet summer would actually lead to healthier bison babies, called calves, the following year.

Jeff and other scientists collect data on the bison herd every year, including the bison calves. Every October, all the bison in the Konza Prairie herd are rounded up and weighed. Since most of the bison calves are born in April or May, they are about 6 months old by the time are weighed. The older and the healthier the calf is, the more it weighs. Very young calves, including those born late in the year, may be small and light, and because of this they may have a difficult time surviving the winter. 

Jeff also collects data on how much rain and snow, called precipitation, the prairie receives every year. Precipitation is measured daily at the biological station and then averaged for each year. Precipitation is important because it plays a direct role in how well the plants grow. 

Jeff and a herd of bison on the Konza prairie.
Konza LTER logo

Featured scientist: Jeff Taylor from the Konza Prairie Biological Station

Written by: Jill Haukos, Seton Bachle, and Jen Spearie

Flesch–Kincaid Reading Grade Level = 8.7

Additional teacher resources related to this Data Nugget include:

  • The full dataset for bison herd data is available online! The purpose of this study is to monitor long-term changes in individual animal weight. The datasets include an annual summary of the bison herd structure, end-of-season weights of individual animals, and maternal parentage of individual bison. The data in this activity came from the bison weight dataset (CBH012).
  • For more information on calf weight, check out the LTER Book Series book, The Autumn Calf, by Jill Haukos.

Changing climates in the Rocky Mountains

Lower elevation site in the Rocky Mountains: Temperate conifer forest. Photo Credit: Alice Stears.

The activities are as follows:

Each type of plant needs specific conditions to grow and thrive. If conditions change, such as temperature or the amount of precipitation, plant communities may change as well. For example, as the climate warms, plant species might start to shift to higher latitudes to follow the conditions where they grow best. But what if a species does well in cold climates found at the tops of mountains? Because they have nowhere to go, warming puts that plant species at risk.  

To figure out if species are moving, we need to know where they’ve lived in the past, and if climates are changing. One way that we can study both things is to use the Global Vegetation Project. The goal of this project is to curate a global database of plant photos that can be used by educators and students around the world. Any individual can upload photos and identify plant species. The project then connects each photo to information on the location’s biome, ecoregion, and climate, including data tracking precipitation and temperature over time. The platform can also be used to explore how the climates of different regions are changing and use that information to predict how plant communities may change. 

Daniel is a scientist who is interested in sharing the Global Vegetation Project data with students. Daniel became interested in plants and vegetation when he learned in college that you can simply walk through the woods and prairie, collect wild seeds, germinate the plants, and grow them to restore degraded landscapes. Plants set the backdrop for virtually every landscape that we see. He thinks plants deserve our undivided attention.

Daniel and his team wanted to create a resource where students can look deeper into plant communities and their climates. Much of the inspiration for the Global Vegetation Project came from the limitations to undergraduate field research during the COVID-19 pandemic. Students in ecology and botany classes, who would normally observe and study plants in the field, were prevented from having these opportunities. By building an online database with photos of plants, students can explore local plants without having to go into the field and can even see plants from faraway places. 

Daniel’s lab is based in the Rocky Mountains in Wyoming, where the plants are a showcase in both biodiversity and beauty. These communities deal with harsh conditions: cold, windy and snowy winters, hot and dry summers, and unpredictable weather during spring and fall. The plants rely on winter snow slowly melting over spring and into summer, providing moisture that can help them survive the dry summers. 

The Rocky Mountains are currently facing many changes due to climate change, including drought, increased summer temperatures, wildfires, and more. This creates additional challenges for the plants of the Rockies. Drought reduces the amount of precipitation, decreasing the amount of water available to plants. In addition, warmer temperatures in winter and spring shift more precipitation to rain instead of snow and melts snow more quickly. Rain and melted snow rapidly move through the landscape, becoming less available to plants in need. On top of all this, hotter, drier summers further decrease the amount of water available, stressing plants in an already harsh environment. If these trends continue, there could be significant impact on the types of plants that are able to grow in the Rocky Mountains. These changes will have an impact on the landscape, organisms that rely on plants, and humans as well.

Daniel and his colleagues pulled climate data from a Historic period (1961-2009) and Current period (2010-2018). They selected two locations in Wyoming to focus on: a lower elevation montane forest and a higher elevation site. To study climate, they focused on temperature and precipitation because they are important for plants. They wanted to study how temperature and precipitation patterns changed overall and how they changed in different seasons. They predicated temperatures would be higher in the Current period compared to the Historic period in both locations. For precipitation, they predicted there would be drier summers and wetter springs.

Featured scientist: Daniel Laughlin from The University of Wyoming. Written by: Matt Bisk.

Flesch–Kincaid Reading Grade Level = 10.5

Additional teacher resource related to this Data Nugget:

Nitrate: Good for plants, bad for drinking water

Evelyn is a scientist at the University of Minnesota. She studies nitrate pollution and how growing perennial crops may prevent it from entering our drinking water.

The activities are as follows:

Nitrogen is the most abundant element in our atmosphere. All living things need nitrogen to live and grow, but plants and animals can’t use the atmospheric form. Instead, many plants extract nitrogen from the soil and in the case of crops, we supply nitrogen through fertilizer, in a form called nitrate.

Nitrate dissolves well in water. This helps make it easy for plants to use, but it can also end up in rivers and groundwater. Groundwater with just 10 milligrams of nitrate per liter is not safe to drink because it can lead to a higher risk of cancer and birth defects. It is really expensive to remove nitrate from drinking water. Towns whose groundwater is contaminated must either pay to remove it or find a new drinking water source. Virtually all nitrate pollution comes from fertilizers used on crops, so one way to address this problem is to change the way we farm.

Annual plants live for just one season and typically have smaller shallower root systems than perennial plants, which live for multiple seasons. Most farmland grows annuals like corn and soybeans, but we get some of our food from perennials like apples, hazelnuts, and raspberries. Perennials stay in the ground all year and start growing right away in the spring before annual crops are even planted. Perennial grasses are particularly good at growing deep roots and taking up lots of nitrate from the soil. If we could produce more food from perennial plants instead of annual plants, crops may absorb enough nitrate to prevent it from getting into our drinking water.

For twenty years, researchers at The Land Institute in Kansas and at the University of Minnesota have been working on a new perennial grain crop called Kernza®, the seeds from a plant called intermediate wheatgrass. Kernza® can be used like wheat or rye, but it has a larger, deeper root system than regular annual wheat. Perennial plants’ deep roots are really good at absorbing dissolved nitrate in soil, so scientists wanted to study Kernza® in the field to see if it would prevent nitrate getting into groundwater.

Evelyn is one of these researchers. She grew up in Minneapolis, Minnesota and as a high school student, she was surprised to learn that agriculture has a huge impact on soil and water quality, wildlife habitat, and biodiversity. She wanted to help protect the environment, so she studied Food Systems at the University of Minnesota. A few years later, she joined a project that involved planting Kernza® in rural areas to prevent and reduce nitrate contamination of drinking water. Farmers, city officials, water managers, and scientists worked together to find solutions. This project inspired Evelyn to study Kernza® and nitrate for her master’s degree.

In her experiment, Evelyn planted plots of Kernza® (foreground) and plots with a corn-soybean rotation (background). This photo was taken in a corn year. Lysimeters are used to collect groundwater samples. The white posts are holding up the lysimeter sampling tubes.

To see if Kernza® helped absorb more nitrate from soil than annual crops, Evelyn and her colleagues ran an experiment. They planted plots of Kernza® and other plots that rotated between corn and soybean every year. Plots with Kernza® and corn were fertilized with nitrogen. Soybean plots were not fertilized.

In the plots, they installed lysimeters: long tubes that go down several feet to collect soil water from below where most plant roots can reach it. Soil water is the water that sits between soil particles. It can be taken up by plant roots or trickle down into the groundwater that is used for drinking wells. Once it moves deeper than a plant’s roots, it can’t be taken up and is very likely to reach the groundwater. Evelyn took water samples from the lysimeters every ten days and analyzed them for nitrate concentration.  If more nitrate is found in soil water under corn and soybean plots than Kernza®, this would be good evidence that Kernza® takes up more nitrate and helps protect groundwater.

Featured scientist: Evelyn Reilly (she/her) from University of Minnesota

Flesch–Kincaid Reading Grade Level = 10.9

Mowing for monarchs, Part II

In Part I you explored data that showed monarchs prefer to lay their eggs on young milkweeds that have been mowed, compared to older milkweed plants. But, is milkweed age the only factor that was changed when Britney and Gabe mowed patches of milkweeds? You will now examine whether mowing also affected the presence of monarch predators.

A scientist measuring a milkweed plant.
A scientist, Lizz D’Auria, counting the number of monarch predators on milkweed plants in the experiment.

The activities are as follows:

The bright orange color of monarch butterflies signals to their enemies that they are poisonous. This is a warning that they do not make a tasty meal. Predators, like birds and spiders, that try to eat monarch butterflies usually become sick. Many people think that monarch butterflies have no enemies because they are poisonous. But, in fact they do have a lot of predators, especially when they are young.

Monarchs become poisonous from the food they eat. Adult monarchs lay their eggs on milkweed plants, which have poisonous sap. When the eggs hatch, the caterpillars chomp on the leaves. Young caterpillars are less poisonous because they haven’t eaten much milkweed yet. And monarch eggs are not poisonous at all to predators.

Britney and Gabe met with their friends, Doug and Nate, who are scientists. Doug and Nate thought that Britney and Gabe’s experiment might have changed more than just the age of the milkweed plants in the patches they mowed. By mowing their field sites they were also cutting down the plants in the rest of the community. These plants provide habitat for predators, so mowing all of the plants would affect the predators as well. These ideas led to another potential explanation for the results Britney and Gabe saw in their data. Because all plants were cut in the mowed patches, there was nowhere for monarch predators to hang out. Britney and Gabe came up with an alternative hypothesis that perhaps monarch butterflies were choosing to lay their eggs on young milkweed plants because there were fewer predators nearby. To test this new idea, Britney and Gabe went back to their experimental site and started collecting data on the presence of predators in addition to egg number. Remember that in each location, they had a control patch, which was left alone, and a treatment patch that they mowed. The control patches had older milkweed plants and a full set of plants in the community. The mowed patches had young milkweed plants with short, chopped plants nearby. For the whole summer, they went out weekly to all of the patches. They counted the number of predators found on the milkweed plants so they could compare the mowed and unmowed patches.

Predators of monarch butterflies.
There are many different species that eat monarch butterfly eggs and young caterpillars. These are just a few of the species that Gabe and Britney observed during their experiment.

Featured scientists: Doug Landis and Nate Haan from Michigan State University and Britney Christensen and Gabe Knowles from Kellogg Biological Station LTER.

Flesch–Kincaid Reading Grade Level = 8.2

Additional resources related to this Data Nugget:

  • A news article discussing declining monarch populations and the causes that might be contributing to this trend.

Going underground to investigate carbon locked in soils 

Mineral-associated organic matter (MAOM) at the bottom of a test tube in a salt solution.

The activities are as follows:

Soil is an important part of the carbon cycle because it traps carbon, keeping it out of the atmosphere and locked underground. At a global level, the amount of carbon stored by soil is more than is found in all of the plants and the atmosphere combined. Carbon trapped underground does not contribute to the rising carbon dioxide concentration in our atmosphere that leads to climate change. For decades, scientists have been researching how much carbon our soils can store to understand its role in slowing the pace of climate change.

Carbon enters the soil when plants and animals die, and their organic matter is decomposed by soil bacteria and fungi. Sometimes it is broken down into very small molecules. These molecules become attached to minerals in the soil, like clay particles. We call this mineral-associated organic matter (MAOM). The carbon is connected to minerals with very strong chemical bonds. Because these bonds are hard to break, the carbon stays in the soil for long periods of time and accumulates on clay minerals. 

Some studies have shown that the carbon in MAOM can be trapped in soils for thousands of years! When more of the carbon in the soil is attached to minerals and locked in the soil for longer time periods, the ecosystem is serving an important role in keeping carbon out of the atmosphere. 

Ashley in the lab, using a saltwater solution to isolate mineral-associated organic matter (MAOM) from soil samples.

Ashley is working to understand how much stable carbon there is in soils, and the role of climate. Microbes work faster in warmer and wetter conditions, which results in quicker decomposition. Ashley thought this rapid decomposition would cause organic matter to be broken down into smaller particles sooner. Therefore, she thought that in warmer or wetter environments, more soil carbon would attach to minerals and become stable MAOM. In colder or drier environments, she expected this process to happen more slowly, leading to a smaller amount of MAOM in the soil.

To test these ideas, Ashley used soil samples from forests with different climates throughout the Eastern United States. Soil samples were collected from New Hampshire to Alabama by teams of researchers using the same sampling protocol. The samples were mailed to Ashley’s lab at Indiana University for analysis. Ashley measured the amount of MAOM in each soil sample by taking advantage of a key feature: MOAM is heavy! Ashley submerged each soil sample in a saltwater solution, and the parts that floated were discarded, while the parts that sunk to the bottom were classified as MAOM. She then rinsed the salt off and measured the amount of carbon in the MAOM with an instrument called an elemental analyzer. She compared this number to the amount of carbon in the whole soil sample to calculate what percentage of the total soil carbon was attached to minerals.

Featured scientist: Ashley Lang from Indiana University

Flesch–Kincaid Reading Grade Level = 10.8

Additional teacher resources related to this Data Nugget:

Salty sediments? What bacteria have to say about chloride pollution

Lexi taking water quality measurements at Cedar Creek in Cedarburg, WI.

The activities are as follows:

In snowy climates, salt is applied to roads to help keep them safe during the winter. Over time, salt – in the form of chloride – accumulates in snowbanks. Once temperatures begin to warm in the spring, the snow melts and carries chloride to freshwater lakes, streams, and rivers. This runoff can quickly increase the salt concentration in a body of water. 

In large amounts, salt in the water is harmful to aquatic organisms like fish, frogs, and invertebrates. However, there are some species that thrive with lots of salt. Salt-loving bacteria, also known as halophiles, grow in extreme salty environments, like the ocean. Unlike other bacteria and organisms that cannot tolerate high salinity, halophiles use the salt in the environment for their day-to-day cellular activities. 

Lexi is a freshwater scientist who is interested in learning more about how ecosystems respond to this seasonal surge of chloride in road salts. She thought that there may be enough chloride from the road salt after snowmelt to change the bacteria community living in the sediment. More salt would support halophiles and likely harm the species that cannot tolerate a lot of salt. 

By taking a water sample and measuring the chloride concentration, we can see a snapshot in time of how toxic the levels are to organisms. However, the types of bacteria in sediments take a while to change. Halophiles may be able to tell us a long-term story of how aquatic organisms respond to chloride pollution. Lexi’s main goal is to use the presence of halophiles as a measure of how much chloride has impacted the health and water quality of river or stream ecosystems. This biological tool could also help cities identify areas that may be getting salted beyond what is necessary to keep roads safe.

Lexi expected that there would be few, or maybe no, halophiles in rural areas where there are not many roads. She also thought halophiles would be widespread in urban environments where there are many roads. Because salt impacts the streams year after year, she expected that halophiles would become permanent members of the microbial community and increase in winter and spring. Therefore, she also wanted to track whether halophiles remain in the sediment throughout the year, increasing in numbers when salt levels become high. 

She began to sample sediments from two different rivers in Southeastern Wisconsin. The urban Kinnickinnic River site is in Milwaukee, WI, and the Menomonee River site is in a rural environment outside of the city. She selected these sites because they offer a good comparison. Because there are more roads, and thus saltier snowmelt, the Kinnickinnic site in the city should have higher chloride concentrations than the Menomonee site. 

When visiting her sites throughout the year, Lexi collected multiple water and sediment samples. Every time she visited, she also recorded important water quality characteristics such as pH, conductivity, and temperature of the water. She then brought the samples to the laboratory and analyzed each for its chloride concentration. To measure the quantity of halophiles in the sediment, Lexi used a process where the sediment is shaken in water to separate the bacteria from the sediment and suspend them in the water. Samples from the water were then plated on a growth medium that contained a very high salt concentration. Because the growth medium was so salty, Lexi knew that if bacteria colonies grew on the plate, they would most likely be halophiles because most bacteria do not thrive in salty environments. Lexi counted the number of bacteria colonies that grew on the plates for each sample she had collected.

Featured scientist: Lexi Passante from the University of Wisconsin-Milwaukee

Flesch–Kincaid Reading Grade Level = 12.0

Some videos about Lexi and her research:

Additional teacher resources related to this Data Nugget:

Ant wars!

Three pavement ants touch antennae to determine if they are nestmates. Photo courtesy Michael Greene.

The activities are as follows:

The ants crawling into and out of cracks along sidewalks are called pavement ants. They live in groups called colonies, which are made up of a few queens and many worker ants. A colony lives together inside a nest, a physical structure. Worker ants use their antennae to touch the bodies of other ants. Certain chemicals tell them if the ant is from their colony or a different colony. Nestmates are ants from the same colony, and non-nestmates are ants from other colonies. 

Neighboring colonies often compete for food, leading to tension. If an ant finds a non-nestmate, it organizes a large war against the nearby colony. This results in huge sidewalk battles that can include thousands of ants fighting for up to 12 hours! These ant wars often involve worker ants grabbing body parts of non-nestmate ants. 

Andrew, Jazmine, John, Mike, and Ken all work together to study the social and chemical cues that drive behaviors in animals. They were curious to learn more about the triggers that lead to colony wars. Worker ants don’t have a leader, so the scientists wanted to know how large wars are organized. The team started by reading lots of research articles and learned that there are several factors that may affect an ant’s decision to fight. These include the odor of other ants they meet, the size of the ant’s colony, and the season. The team also knew from their own experiments that if an ant meets a fellow nestmate before meeting a non-nestmate, it was more likely to fight.

A colony war involving thousands of pavement ants. Photo credit: Michael Greene.

All of this information helped the team realize that interactions with nestmates were an important part of the decisions that start ant wars with non-nestmakes. To build on this, they wanted to know whether the decision to fight was affected by ant density, which is the number of ants within an area. They thought that at higher densities the ants would be more likely to interact, leading to more fights with non-nestmates. If more wars are observed at higher ant densities, increased interactions with nestmates might be part of the story.

To answer their question, the team collected ants from different colonies in Denver, Colorado for two separate experiments. They brought them back to the lab to set up trials in a plastic tank arena.

Experiment 1: For the first set of behavioral trials, the researchers varied the number of ants in the tank, ranging from 2 to 20 ants. The size of the tank remained constant, and there were always equal numbers of nestmates and non-nestmates. This means the ratio of nestmates to non-nestmates was always 1:1, but the density varied by how many ants were included in the experiment. They performed 18 trials for each density treatment in their experiment.

At the start of every trial, ants from each colony were in separate areas so that they could interact with nestmates first. Earlier work had shown that when ants in each area interact, they touch antennae to another ant’s body. These interactions create a brain state that makes an ant more likely to fight an ant from another colony. Then the scientists removed a barrier revealing the ants from the other colony. They watched the ants for 3 minutes. During that time they recorded the number of ants that were fighting. This way they could compare how likely the ants were to fight at different densities. They predicted there would would be more fighting at higher ant densities.

Experiment 2: The scientists also wanted to measure the effect of density on the interaction rates between just nestmates. This experiment allowed the scientists to understand how the rate of interactions affected levels of neurochemicals in brains, creating the brain state that increased the likelihood that an ant would be aggressive. For these trials, they placed different densities of nestmate ants in a tank. They randomly picked an ant during each trial and counted the number of times it contacted a nestmate ant. Different groups of ants were used in each trial and each experiment. They observed the number of interactions at different densities and expected nestmate ants to have more interactions at higher densities.

Featured scientists: Andrew Bubak, Jazmine Yaeger, John Swallow, and Michael J. Greene from the University of Colorado-Denver; Kenneth Renner from the University of South Dakota. Written by: Gabrielle Welsh

Flesch–Kincaid Reading Grade Level = 9.0

Additional teacher resources related to this Data Nugget:

A news article about the research: