Seagrass survival in a super salty lagoon

A researcher in the Dunton Lab measures seagrasses underwater using a mask, snorkel, and a white PVC quadrat.

The activities are as follows:

Seagrasses are a group of plants that can live completely submerged underwater. They grow in the salty waters along coastal areas. Seagrasses are important because they provide a lot of benefits for other species. Like land plants, seagrasses use sunlight and carbon dioxide to grow and produce oxygen in a process called photosynthesis. The oxygen is then used by other organisms, such as animals, for respiration. Other organisms use seagrasses for food and habitat. Seagrass roots hold sediments in place, creating a more stable ocean bottom. In addition, the presence of seagrasses in coastal areas slows down waves and absorbs some of the energy, protecting shorelines.

Unfortunately, seagrasses are disappearing worldwide. Some reasons include damage from boats, disease, environmental changes, and storms. Seagrasses are sensitive to changes in their environment because they have particular conditions that they prefer. Temperature and light levels control how fast the plants can grow while salinity levels can limit their growth. Therefore, it is important to understand how these conditions are changing so that we can predict how seagrass communities might change as well.

Ken is a plant ecologist who has been monitoring seagrasses in southern Texas for over 30 years! Because of his long-term monitoring of the seagrasses in this area, Ken noticed that some seagrass species seemed to be in decline. Kyle started working with Ken during graduate school and wanted to understand more about what environmental conditions might have caused these changes. 

Manatee grass (Syringodium filiforme) located within the Upper Laguna Madre.

Texas has more seagrasses than almost any other state, and most of these plants are found in a place called Laguna Madre. During his yearly seagrass monitoring, Ken noticed that from 2012 – 2014 one of the common seagrasses, called manatee grass, died at many locations across Laguna Madre. Since then, the seagrass has grown back in some places, but not others. Kyle thought this would be an opportunity to look back at the long-term dataset that Ken has been collecting to see if there are any trends in environmental conditions in years with seagrass declines.

Each year, Ken, Kyle, and other scientists follow the same research protocols to collect data to monitor Laguna Madre meadows. Seagrass sampling takes place 2 – 4 times a year, even in winter! To find the manatee grass density, scientists dig out a 78.5 cm2 circular section (10 cm diameter) of the seagrass bed while snorkeling. They then bring samples back to the lab and count the number of seagrasses. While they are in the field, they also measure environmental conditions, like water temperature and salinity. A sensor is left in the meadow that continuously measures the amount of light that reaches the depth of the seagrass.

Kyle used data from this long-term monitoring to investigate his question about how environmental conditions may have impacted manatee grass. For each variable, he calculated the average across the sampling dates to obtain one value for that year. He wanted to compare manatee grass density with salinity, water temperature, and light levels that reach manatee grass. He thought there could be trends in environmental conditions in the years that manatee grass had low or high densities.

Featured scientists: Kyle Capistrant-Fossa (he/him) & Ken Dunton (he/him) from the U-Texas at Austin

Flesch–Kincaid Reading Grade Level 9.8

Additional teacher resources related to this Data Nugget:

There is another Data Nugget that looks at these seagrass meadows! Follow Megan and Kevin as they look at how photosynthesis can be monitored through the sound of bubbles and the acoustic data they produce.

Follow this link for more information on the Texas Seagrass Monitoring Program, including additional datasets to examine with students.

There are articles in peer-reviewed scientific journals related to this research, including:

National Park Service information about the Gulf Coast Inventory and Monitoring.

Texas Parks and Wildlife information on seagrass:

Eavesdropping on the ocean

Scientists heading out to the proposed wind energy site.

The activities are as follows:

Most of our energy in the United States comes from fossil fuels like natural gas, coal, and oil. These energy sources are efficient, but they release greenhouse gases into the atmosphere when burned. They are also non-renewable, meaning there is a limited supply. Renewable energy options collect energy from sources that are naturally replenished, such as sunshine, wind, and even ocean waves. By using renewable energy sources, we can fuel our lives without depleting fossil fuel supplies.

Windmills have been used by humans to capture energy from the wind long before electricity was discovered. Historically, they were used to pump water and grind grains to make flour. Today, they are used to generate electricity that can be used in your home. Most of these modern windmills (also known as turbines) are located on land, but researchers and engineers are exploring a new type of site – the ocean.

Offshore wind energy sites in the U.S. are usually at least 20 miles from land. Winds that blow over the ocean are much more consistent than on land, making offshore energy more reliable. In addition, land that can be used for windmills is limited, especially in areas where there are already a lot of people. Offshore wind energy could be a solution where there are a lot of people living along the coast.

Scientists attach a weight to the line and wait to get into position to deploy a drifting recorder

Careful planning goes into these large-scale projects. Before any construction begins, scientists want to make sure the benefits outweigh the costs. One topic of concern is marine mammals. Many marine mammals, like whales, are federally protected, and some are endangered species. Scientists are worried that the construction of offshore windmills could impact the whales that live or migrate through the designated wind energy areas.

Whales use sound transmitted through the water to survive. Just like many animals on land, they use sound to communicate, navigate, find food, and avoid predators or other threats. Noise from construction activities could cause whales to avoid the area. They may need to find a new area to find food, rest, or find mates. Whales typically migrate, so loud noises could also interfere with their migration route.

Shannon is an acoustic ecologist, meaning she uses sound and how it is transmitted to learn more about organisms and their environment. She works with Desray, who is a research biologist specializing in marine mammals. Together, they are leading a large project to collect sound data to assess the risks of a proposed offshore wind energy site off the coast of central California. One specific goal they have is to see whether it is possible to identify the best time of year to build the wind energy platforms with the least disturbance to marine mammals. To do this, they had to learn more about when whales are using and traveling through the area of the proposed site.

Acoustic ecology is a way to learn more about whales and their behavior through sound, which is important because visual detections are limited and take a lot of time out at sea. Instead, scientists can analyze acoustic data to detect which species are present. Each species makes different sounds with unique patterns, and by listening, we can identify which species are in the area. 

Shannon Rankin and Anne Simonis let out the line with the acoustic recorder and surface floats.

Shannon and a large team of supporting scientists worked together to design floating acoustic recorders. They partnered with Desray to deploy them in the proposed offshore wind energy area. Once the recorders are launched, the team uses satellite location to follow the movement of the recorders from shore. They let the recorders drift in the open ocean for several days before they board a large research boat and pick them up again. While the recorders are drifting, they are continuously recording the ocean sounds below. These drifting recorders cover a larger spatial area, for a longer time, than other types of passive acoustic monitoring methods. The team launched the acoustic recorders in different seasons to learn which whale species are using the proposed site throughout the year and to assess what time of year would have the lowest whale presence near the construction site.

Featured scientists: Shannon Rankin from the NOAA Southwest Acoustic Ecology Lab and Desray Reeb from the Bureau of Ocean Energy Management

Flesch–Kincaid Reading Grade Level 9.4

Additional teacher resources related to this Data Nugget:

  • The NOAA team members on this project have put together a blog series, called “Sound Bytes,” to share the stories and impacts of the ADRIFT research highlighted in this activity. This blog series features many perspectives showcasing how underwater sound, in the form of acoustic data, can be used to learn more about marine mammals.
  • Students can learn more about how acoustic data is analyzed and what it looks like visually by checking out the Ocean Voices project on Zooniverse. Here they can participate in a guided introduction to humpback whale and ship sounds from drifting acoustic recorders and help scientists classify sounds on the recordings.
  • These data were collected as part of the ADRIFT project, led by the Southwest Acoustic Ecology Lab run by the National Oceanic and Atmospheric Administration and the Bureau of Ocean Energy Management.
  • NOAA has a wide variety of lesson plans that you could use to supplement this activity. Here is a set of activities for elementary, middle, and high school on bioacoustics.
  • Lesson on bioacoustics by Seagrant and Woods Hole Oceanographic Institute.
  • For more lessons and activities about wind energy, check out the K-12 teaching materials by the Office of Energy and Renewable Energy.
  • A collection of videos that show the spectrograms and audio recordings for various marine mammals that you could share with students.
  • There is an extensive PowerPoint that has additional information about the ADRIFT acoustics project and other research being done.
Video of a drifting acoustic recorder launch. Turn on subtitles for information about the process.

This study was funded in part by the U.S. Department of the Interior, Bureau of Ocean Energy Management through Interagency Agreement M20PG00013 with the U.S. Department of Commerce, National Oceanic and Atmospheric Administration, National Marine Fisheries Service (NMFS), Southwest Fisheries Science Center (SWFSC).

The prairie burns with desire

Stuart showing an Echinacea flower setting seed.

The activities are as follows:

Fire plays a crucial role for prairie habitats across North America. Native Americans have long observed that lush and green pastures grow after a wildfire. In many areas, it is part of current and historical native culture to imitate this natural process by deliberately burning the prairie in a controlled way. This land management practice has many benefits, such as helping native grasses form seeds, thinning out plants, and enhancing habitat for prairie animals. By using controlled fires to cultivate these areas, Native Americans increase the availability of food and connect to the environment and their cultural traditions.

Some land management agencies plan prescribed burns to increase the health of prairie ecosystems. However, fire is still suppressed in many North American prairies due to the possible damage to human development. In these areas, scientists have observed that fire suppression contributes to local plant species extinctions, but we do not know why.

Stuart is a scientist interested in how fire can help prairie plants. In the late 1990s, Stuart was in central Minnesota searching for prairie plants in the Echinacea genus. The prairie was ablaze with flowers, so he had no difficulty finding plenty of plants. He tagged each plant so that he could study them again in the future. However, when he returned the following year, the field had almost no flowers! He kept returning to this same field. A few years later he found the site was again filled with flowers. That year there had been a prairie fire. Visually seeing the impacts of fire on the landscape is a memory he will not forget.

Stuart became interested in learning more about how fire affects the reproduction of native prairie plants. He knew that Echinacea plants grow in many places, but they have a hard time making seeds. This genus cannot self-pollinate, meaning they must be fertilized with pollen from a genetically different plant. Echinacea plants are also dependent on insects, such as bees, to pollinate them.

Echinacea flower

In 1996, a research team started collecting data on Echinacea plants in a large research site in Minnesota. This prairie site had a schedule for prescribed burns, or controlled fires that are started by experts to manage the land. These burns would happen every 4-6 years during the spring.

The team established a set of plot locations that they visited each summer. They searched for and mapped the location of all flowering Echinacea plants within these plots. They took measurements on each Echinacea plant – whether it was flowering, and the distance to its second closest Echinacea neighbor.

Stuart decided to take a new look at this long-term dataset. He had two ideas for how fire might be helping Echinacea plants. First, fire might help all the plants get on the same schedule and make flowers at the same time. This synchrony, or flowering at the same time, could help pollen get from one flower to another. Second, fire might remove competing plants from the area, opening up bare ground for new seeds to establish. This would allow Echinacea plants to be closer to one another, again making it easier for pollen to move between flowers.

With these data, Stuart could compare years with and without prescribed burns to see whether fire helped Echinacea flowering. To look at whether fire decreased the space between blooming Echinacea plants, he looked at the distance between a focal plant and its second-closest neighbor. To see whether fire increased the synchrony of flowering, Stuart used the data to calculate the proportion of Echinacea plants that were in bloom during the summer sampling period.

Featured scientist: Stuart Wagenius from the Chicago Botanic Gardens Written by: Harrison Aakre

Flesch–Kincaid Reading Grade Level = 8.6

Additional teacher resources related to this Data Nugget:

More information about the Echinacea project, based in Minnesota. There are additional datasets to explore, blog posts from the field, identification guides, and pictures of the experiments.

Article to learn about cultural perspectives that are traditionally not represented in textbooks. Native Americans have, and continue to incorporate ecology, observations, and making sense of patterns for millennia.

For more information about indigenous knowledges, or traditional ecological knowledge, check out the following websites:

Published journal article about this research. Wagenius, S. et al. 2020. Fire synchronizes flowering and boosts reproduction in a widespread but declining prairie species. Proceedings of the National Academy of Sciences.

Which tundra plants will win the climate change race?

Some arctic Tundra plant species monitored in this experiment.
Arctic tundra plant species monitored in this experiment.

The activities are as follows:

The Arctic, the northernmost region of our planet, is home to a unique biome known as tundra. While you might think of the arctic tundra as a blanket of snow and polar bears, this vast landscape supports a diversity of unique plant and animal species. The tundra is an area without trees that supports many species of plants, mammals, birds, insects, and microbes. 

Arctic environments present many challenges to plants. Temperatures only creep above freezing for about three months each year. This short arctic summer means that the species that live there only have a brief period to grow and reproduce. From mid-May to the end of July the sun doesn’t set, so there’s plenty of light available. Plants need this light for photosynthesis to make sugars for food. 

Even when there is light, plants need to wait until the snow has melted and the soil has thawed enough for them to grow. Tundra plants have short roots since they can’t grow through frozen ground. These roots try to get nutrients the plant needs from the soil. But with the soil so cold, decomposition is very slow. This means that microbes cannot easily convert dead plant material into nutrients that plants need such as nitrogen and phosphorus. For this reason, the growth of tundra plants is usually limited by nutrients.

Climate change is altering the arctic environment. With warmer seasons and fewer days with snow covering the ground, soils are thawing more deeply and becoming more nutrient-rich. With more nutrients available, some plant species may be able to outcompete other species by growing taller and making more leaves than other plant species. This means that climate change may alter the whole ecosystem game in the tundra. Instead of nutrients limiting plant growth, it may shift to a game of competition between plants reaching for light.

Gus (left) and Jim (right) set up a weather station to monitor air temperature and humidity on the tundra.

To simulate the environmental conditions, we can look at long-term data from two scientists, Gus and Terry, who started working at the Toolik Field Station in northern Alaska in the 1970s. They conducted a series of experiments and learned that two nutrients, nitrogen and phosphorus, limited plant growth in the tundra. Then, in 1981, they set up a new experiment where they added both nutrients to experimental plots every year. Gus and Terry compared plant growth between these fertilized plots and control plots that were not fertilized. They wanted to figure out how each plant species would respond to more nutrients over the long term and what would happen to the plant community to see if some species would outcompete others in the fertilized conditions. This experiment is one way to mimic future conditions and test hypotheses about what we might expect to see.

The fertilizer was added every year in early June after the snow melted off the plots. Beginning in 1983, other scientists, such as Laura and Ruby, began to sample these plots. They dug out small 20-centimeter by 20-centimeter samples of tundra and brought them back to the nearby Toolik Field Station. In the lab, the tundra sample was separated into individual plant species and “plucked” to sort by different plant tissue types: leaves, stems, and roots. Then these plants were dried and weighed to determine the biomass (mass of living tissue) of each species in the sample. The fertilized and non-fertilized plots were sampled and plucked six times between 1983 and 2015. This means that many of the scientists who sampled the plots in 2015 had not yet been born when the experiment started in 1981!

Featured scientists: Gus Shaver (he/him), Jim Laundre (he/him), Laura Gough (she/her), and Ruby An (she/her) from Toolik Field Station, Arctic Long-term Ecological Research Site

Flesch–Kincaid Reading Grade Level = 8.6

Additional teacher resources related to this Data Nugget:

A difficult drought

A field of switchgrass studied by biofuels researchers.

The activities are as follows:

Most people use fossil fuels like natural gas, coal, and oil daily. We use them to generate much of the energy that gets us from place to place, power our homes, and more. Fossil fuels are very efficient at producing energy, but they also come with negative consequences. For example, when burned, they release greenhouse gases like carbon dioxide into our atmosphere. The right balance of greenhouse gasses is needed to keep our planet warm enough to live on. However, because we have burned so many fossil fuels, the earth has gotten too hot too fast, resulting in climate change. Scientists are looking for other ways to fuel our lives with less damage to our environment.

Substituting fossil fuels with biofuels is one of these options. Biofuels are fuels made from plants. Unlike fossil fuels, which take millions of years to form, biofuels are renewable. They are made from plants grown and harvested every few years. Using biofuels instead of fossil fuels can be better for our environment because they do not release ancient carbon like burning fossil fuels does. In addition, the plants made into biofuels take in carbon dioxide from the atmosphere as they grow.

To become biofuels, plants need to go through a series of chemical and physical processes. The sugar stored in plant cells must undergo fermentation. In this process, microorganisms, like yeast, transform the sugars into ethanol that can be used for fuels. Trey is a scientist at the Great Lakes Bioenergy Center. He is interested in seeing how yeast’s ability to transform sugar into fuel is affected by environmental conditions in fields, such as temperature and rainfall.

When there was a major drought in 2012, Trey used the opportunity to study the impacts of drought. The growing season had very high temperatures and very low rainfall. These conditions make it more difficult for plants to grow, including switchgrass, a prairie grass being studied as a potential biofuel source.

Trey knew that drought affects the amount and quality of switchgrass that can be harvested. He wanted to find out if drought also had effects on the ability of yeast to transform the plants’ sugars into ethanol. Stress from droughts is known to cause a build-up of compounds in plant cells that help them survive during drought. Trey thought that these extra compounds might harm the yeast or make it difficult for the yeast to break down the sugars during the fermentation process. Trey and his team predicted that if they fed yeast a sample of switchgrass grown during the 2012 drought, the yeast would struggle to ferment its sugars and produce fewer biofuels as a result.  

To test their idea, the team studied two different sets of switchgrass samples that were grown and collected in Wisconsin. One set of switchgrass was grown in 2010 under normal conditions. The other set was grown during the 2012 drought. The team introduced the two samples to yeast in a controlled setting and performed four fermentation tests for each set of switchgrass. They recorded the amount of ethanol produced during each test.

Featured scientists: Trey Sato from the University of Wisconsin-Madison. Written by Marina Kerekes.

Flesch–Kincaid Reading Grade Level = 8.2

Additional teacher resources related to this Data Nugget include:

There are other Data Nuggets that share biofuels research. Search this table for “GLBRC” to find more! Some of the popular activities include:

The Great Lakes Bioenergy Research Center (GLBRC) has many biofuel-related resources available to K16 educators on their webpage.

For activities related specifically to this Data Nugget, see:

Lake Superior Rhythms

A sandy Lake Superior shoreline near Bayfield, WI.

The activities are as follows:

Gena and Ali are sisters who grew up in Bayfield, Wisconsin on the south shore of Lake Superior. When they were young, they spent many summer days sailing in the Apostle Islands National Lakeshore with their parents and friends. As they relaxed on the beach, they would watch how the lake changed. Even over a short period of time, they would see the landscape change. In just a few hours, a rock that was visible above the water’s surface when they arrived would slowly become submerged, only to reappear several hours later.

In high school, Gena and Ali set out to learn about the geophysical forces acting on Lake Superior. They wanted to investigate why they would sometimes see such dramatic fluctuations in water levels. They also wanted to know why water from rivers and streams would sometimes flow out into the lake, while other times it would flow back into the tributaries.

Ali presents research results on how the seiche changes the local water levels.

They learned that large lakes exhibit a phenomenon called a seiche (pronounced saysh). Like tides, a seiche is a periodic rising and falling of water levels. However, tides and seiches are caused by two different forces. Whereas tides are connected to the sun and moon, seiches are caused by changes in atmospheric pressure and strong winds.

Many atmospheric events can exert force on the water, including storms that come and go, heavy rain, cold fronts blowing through, or the calming of strong winds. You can think of Lake Superior as a giant bathtub, and the seiche is the water sloshing back and forth as it is pushed by a force and then released.

Gena and Ali realized that the seiche probably explained the water level changes they saw on Lake Superior. They became curious to learn more about the lake’s seiche pattern. An atmospheric event can cause the water to slosh from one side of the lake to the other several times. They predicted the seiche would look like a wave pattern as the water comes and goes.

The sensor with data recorder on the dock inside a boathouse.

To test their ideas, they decided to investigate how often the water switched directions and how much the water level changed because of the seiche. In other words, they wanted to measure the amplitude and period of the seiche. The amplitude is the height of a wave from its midpoint, or equilibrium. The amplitude can be calculated as half of the water level change from its highest and lowest point in a cycle. The length of time it takes to complete one full back-and-forth cycle is called the period. You can track the period of the seiche by how much time has passed from one peak to the next peak.

Over their summer break, Gena and Ali started to plan how they could document changes in water levels in their hometown. With permission, Gena and Ali placed a sensor inside a boathouse that was protected from wave action. The sensor measured the distance to the nearest object and was set to collect a data point every six minutes. Gena and Ali placed the sensor so that it faced the surface of the water. That way, it would document changes in the water level throughout time.

Featured scientists: Gena (she/her) and Ali Gephart (she/her), Bayfield High School.

Written by: Richard Erickson, Bayfield High School, and Hannah Erickson, Boston Public Schools.

Flesch–Kincaid Reading Grade Level = 8.8

Additional teacher resources related to this Data Nugget include:

  • Here is a link to learn more about the physics of waves.
  • Visit this NOAA website to learn more about seiche behavior and characteristics.

Size matters – and so does how you carry it!

The activities are as follows:

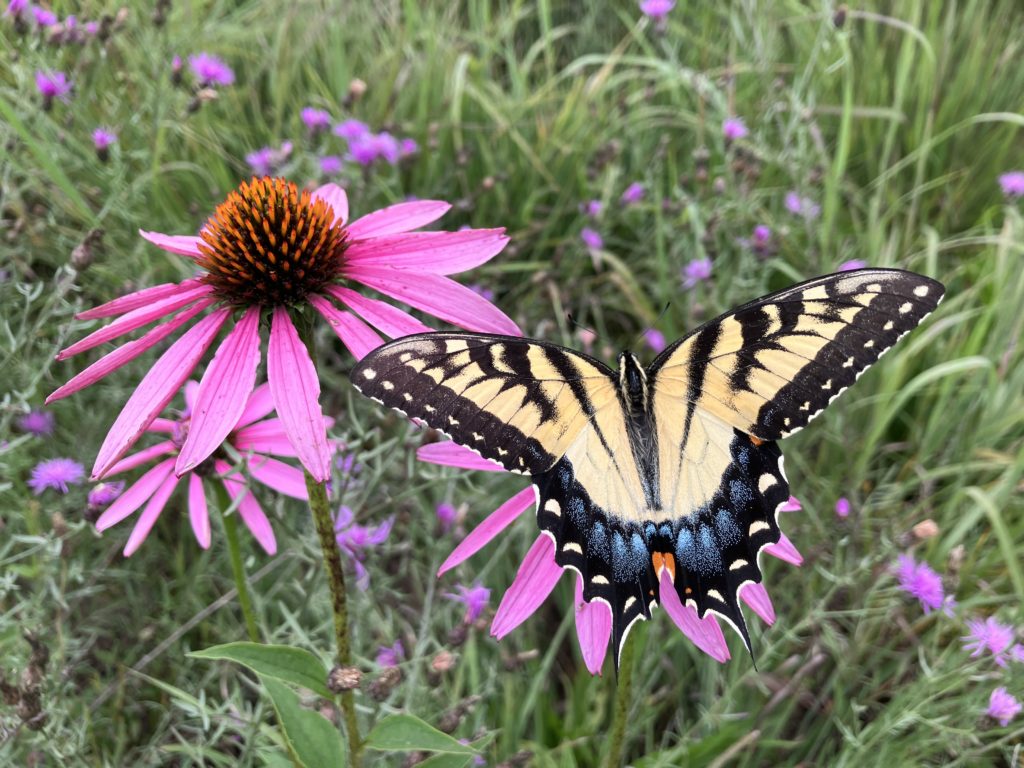
Stalk-eyed fly copulation.

In the wild, animals compete for limited resources. Things like food, water, shelter, and even reproductive mates can be hard to come by. Animals with traits and behaviors that make them more likely to survive and reproduce are said to have higher evolutionary fitness. Some animals have evolved special traits that advertise their fitness to potential mates. Male deer, elk, and moose have large antlers that they use to compete with other males, which demonstrates their fitness to females. Another interesting example is the stalk-eyed flies, in which the males grow long eye stalks to attract a mate. In these cases, females are more likely to choose males with the biggest traits.

Scientists have long predicted that these traits come with both benefits and costs. Large antlers or eyestalks may help a mate notice you, but also come with some costs. Extra weight takes more energy to move around and could make it more difficult to escape from predators. And yet, many studies have failed to find any measurable costs to males having these seemingly impractical traits.

This scientific mystery puzzled Jerry and John, who study stalk-eyed flies. They had failed to identify and document any costs to having longer eyestalks, measured as the distance between the eyes, or eyespan. Common sense told them that having longer eye stalks should make flying more awkward for these flies. However, their data did not support this hypothesis. “When I started collecting data, I focused a lot on the performance costs and got kind of fixated on that,” John says of the team’s initial research. “It was frustrating when we couldn’t identify any actual decline in performance.”

John in the field when he first started his research – many decades ago!

The team began looking for an alternative explanation. They read about research supporting a new idea in a completely different kind of flying animal – barn swallows. Male barn swallows have long, ornate tails. These tails make male barn swallows less aerodynamic during flight. But males have also evolved to have larger wings relative to their body size. This could help them compensate for the extra burden associated with their long tails.

Jerry and John wondered if a similar thing might be at work in stalk-eyed fly wings. Perhaps the male stalk-eyed flies, like male barn swallows, had evolved to have larger wings relative to their body size to help them compensate for long eye stalks when flying. If this were the case, then they expected to see a positive correlation between wing size and eyespan. Could this be why they were unable to measure any disadvantage associated with having longer, more awkward eye stalks? In other words, male stalk-eyed flies with larger wings would be able to support longer eye stalks.

Eyespan (horizontal arrow) and body size (vertical arrow) of a stalk-eyed fly.

Jerry, John, and their team decided to test their new hypothesis by raising stalk-eyed flies in the lab to maturity, then collecting data about their body length, eyespan, and wing area.

To account for natural variation in body size among stalk-eyed flies, the team needed to use “relative” measurements based on body size. With these kinds of measurements, a value of zero (0) means that wing size or eyespan is exactly what you would predict for a fly of that body size. Negative values mean that wing size or eyespan are smaller than you would predict for that body size, while positive values mean that wing size or eyespan is greater than you would predict for that body size. For example, if a fly has a relative eyespan of -0.010, then the distance between the eyestalks was 0.010 millimeters shorter than expected based on its body size.

Featured scientists: Jerry Husak from the University of St. Thomas and John Swallow from the University of Colorado-Denver. Written by: Sam Holloway

Flesch–Kincaid Reading Grade Level = 8.8

Additional teacher resources related to this Data Nugget include:

You can find lessons to accompany many of John’s studies with insects on the Data Nuggets website! Check out the following Data Nugget activities!

A peer-reviewed journal article: Husak, J. F., Ribak, G., Wilkinson, G. S., & Swallow, J. G. 2011. Compensation for exaggerated eye stalks in stalk‐eyed flies (Diopsidae). Functional Ecology, 25(3), 608-616.

A video of a stalk-eyed fly in flight:

Trees and the city

A neighborhood with many tree species and a lot of tree cover.

The activities are as follows:

We often imagine nature as being a place outside of cities. But within our cities, we are surrounded by nature – in fact, most human interactions with nature happen within urban areas. Picturing a tree, we might imagine it in a remote forest, yet many trees are planted by residents and local governments within cities. Trees provide important benefits, such as beauty and shade. The number and types of tree species that are planted in a neighborhood can increase the benefits received from trees in urban areas.

When Adrienne first moved to the Twin Cities in Minnesota, she started exploring Minneapolis and St. Paul by bike. Biking is done at a slow enough pace that she can travel long distances but still make observations about neighborhoods in these cities. As an ecologist, she naturally found herself looking for patterns in trees. For example, she noticed some older neighborhoods in St. Paul have a lot of large trees that provide plenty of shade and tree cover. In other neighborhoods, Adrienne saw fewer types of trees and noticed that she spent less time shaded by branches and leaves.

Adrienne biking around Minneapolis-St. Paul.

Adrienne started conversations with her colleagues about their observations of differences in urban landscapes. They discussed the ways in which laws, policies, and practices (“the way things are done”) give advantages to certain groups of people over others. These advantages are woven into our cultural systems.

Adrienne and her fellow researchers expected that neighborhoods with wealthier and more white residents would have benefited from a long history of greater investment.

Therefore, these neighborhoods were expected to have greater tree cover from the large old trees that have been growing there for many years. They also expected these neighborhoods would have more types of trees. In contrast, the researchers expected that less wealthy neighborhoods and those with a greater percentage of Black, Indigenous, and other People of Color (BIPOC) would have less tree cover and fewer types of trees because of chronic lower investment in these neighborhoods.

To research these ideas, Adrienne and her colleagues combined three different sources of publicly available data:

  • U.S. Census data, used to estimate % BIPOC and average median household income per ‘Block Group’ (similar to a neighborhood).
  • Satellite images, which are often used to estimate % tree cover, measure the percent of land area covered by the tree canopy. Adrienne looked at tree cover in the Block Group areas used in the Census.
  • City data that include the location and species for each tree planted along public streets to calculate tree species richness in each Block Group. Tree species richness is the number of different tree species in an area and is a measure of tree biodiversity used by many ecologists.

Featured scientists: Adrienne Keller (she/her) from the University of Minnesota

The data in this activity are from the MSP Long-term Ecological Research Site. The focus of the research at this site is centered on ecological interactions in urban environments. You can learn more here.

Flesch–Kincaid Reading Grade Level = 9.4

Additional teacher resources related to this Data Nugget include:

  • You can have students read more about environmental justice research from the MSP LTER in this peer-reviewed article (email us at datanuggetsk16@gmail.com if you need a downloadable version):
    • Rebecca H. Walker, Hannah Ramer, Kate D. Derickson & Bonnie L. Keeler (2023) Making the City of Lakes: Whiteness, Nature, and Urban Development in Minneapolis. Annals of the American Association of Geographers, DOI: 10.1080/24694452.2022.2155606
  • This short video features Adrienne as she describes the motivation and process behind her research study.

Collaborative cropping: Can plants help each other grow?

The activities are as follows:

Alfalfa (middle) planted in a Kernza® field.

Most of the crops grown on farms in the United States are annual plants, like corn, soybeans, and wheat. Annual plants die every year after harvest and must be replanted the following year. Preparing farm fields for replanting every year can erode soils and hurt important bacteria and fungi living in the soil.

One way to change how we produce food is to grow more perennial crops. Perennial plants live for many years and don’t need to be replanted. Perennials stay in the ground all year and start growing right away in the spring before annual crops are even planted. This early growth also gives perennial crops a “head-start” in competing with annual weed species that emerge later in the season.

While there are potential benefits of perennial crops, they are not commonly planted because they tend to make lower profits for farmers than annual crops. Crop scientists are still examining potential options to make perennial crops work at a large scale for farmers. For twenty years, researchers at The Land Institute in Kansas and at the University of Minnesota have been looking at a new perennial grain, called Kernza®, that could be used as an alternative to wheat and rye annual crops. Kernza® comes from the seeds of a plant called intermediate wheatgrass. Because Kernza® is such a new crop, scientists still have a lot to learn about it. Before it can be widely used by farmers, they want to know what field conditions help the plants grow to ensure the crop makes money for farmers.

Dr. Jake Jungers taking a soil core in a Kernza® field.

One strategy to improve field conditions for perennial crops is to plant legumes in the field alongside them. Legumes can make nitrogen, a nutrient that plants need to grow, more available to the plants around them. Additionally, farmers can select legume species that typically don’t compete with the crop but may outcompete weeds.

Jake is an ecologist who uses his knowledge about plants to make agriculture more sustainable. Jake wanted to do some research into alfalfa, a type of perennial legume that might work well with Kernza®. Jake thought that growing alfalfa alongside Kernza® would lead to increased profit and yield for two reasons. One, because it would add nitrogen to the soil to boost crop growth. Two, because alfalfa would compete with agricultural weed species, making valuable resources available for the crop plants.

To test this idea, Jake set up an experiment with his team. Alfalfa was grown with Kernza® at three different locations in Minnesota in 2019. The study was replicated four times at each site, with the same amount of alfalfa and Kernza® planted into each field. At the end of the growing season, the fields were harvested, and the plants were sorted into three categories: Kernza®, alfalfa, and weed species. He further sorted Kernza® by grain, which can be used for food, and straw, which can be used for animal feed. Jake wanted to compare yield, or plant growth per unit area, across the plant categories. To do this, he weighed all the plants in each category to get the biomass and then divided by the area of the field.

Featured scientist: Jake Jungers (he/him) from the University of Minnesota

Written by Claire Wineman (she/her)

Flesch–Kincaid Reading Grade Level = 8.5

Surviving the flood

Andrew writing down field notes in an urban stream.

The activities are as follows:

When imagining a stream, you may think of pristine water flowing through a forest or mountain valley. However, streams are found everywhere, including cities. Many of these urban streams run through a pipe, disappear underground, or are filled with water that doesn’t seem to be moving. These streams are often overlooked because they appear more like deep ditches or canals, but they play an important role in water management.

When rain falls in a forest, it flows through the soil, moving in the small spaces between soil particles. Eventually, it reaches a stream. This journey slows the water and prevents flooding. However, when rain falls in an urban area, it often does not move through soil before getting to a stream. Urban streams are instead surrounded by buildings, roads, and parking lots. Water races over these surfaces, causing rapid flooding. This water, called stormwater runoff, can cause a stream to go from ankle-deep to over your head in just a few hours!

A team of stream ecologists, including graduate student Andrew and his advisor Dave, wanted to see whether stormwater floods disturb urban stream ecosystems. Urban streams provide important habitat for many species – fish, insects, crustaceans, bacteria, and algae. Andrew and Dave have observed how large stormwater floods can sweep algae off rocks or bury algae with sediment that is washed in from parking lots. However, algae and other organisms in urban streams are used to living in a habitat with frequent disturbance and can cling to the rocks during small floods.

Andrew downloading data from the data loggers.

Andrew and Dave focused their research on algae because they are an important part of aquatic ecosystems. Algae use energy from sunlight and building blocks from carbon dioxide gas to create sugar and oxygen. This process is called photosynthesis. By photosynthesizing during the day and not at night, algae cause large changes in the amount of oxygen in stream water. Taking a closer look at these daily oxygen changes, you can see how well algae are doing and how healthy a stream is.

Andrew and Dave monitored daily changes in the stream by using sensors that collect oxygen concentrations every 10 minutes.

Andrew and Dave also needed to measure the intensity of flooding during different kinds of storms. They used a measure called discharge, which accounts for both the amount of water flowing in a stream and how fast it’s moving. During a rain event, the time when the most water at the highest speed is rushing through the stream is called the peak discharge. For this measure, Andrew and Dave had some help from the United States Geological Survey, which has instruments in streams and rivers all over the country measuring discharge all the time. Looking at this dataset, Andrew detected a total of 13 storm events of different sizes during a one-year study period.

When the peak discharge is very high, the fast-moving water and flooding disturb algae by sweeping them off rocks and other surfaces, sending them downstream with the flow of water, and the algae are unable to photosynthesize. To answer their question, they looked at the oxygen concentrations for the day leading up to and following the 13 storms that Andrew identified. The difference in oxygen produced by algae before and after storms is a simple way to look at whether the algae resist the flooding or are disturbed by the flooding. If the oxygen concentration is the same after the storm as it was before the storm, the algae were resistant. If oxygen is lower after the storm than before the storm, that means that the algae were disturbed. Andrew and Dave thought that intense storms with high discharge will disrupt the algae more, resulting in lower oxygen concentrations after a storm than before a storm.

Featured scientists: Andrew Blinn (he/him) and Dave Costello (he/him) from Kent State University

The research and data found in this activity come from the STORMS project, which investigates how stormwater management decisions influence hydrology and stream health in tributaries of the Cuyahoga River Watershed of Ohio.

Flesch–Kincaid Reading Grade Level = 10.3

Additional teacher resources related to this Data Nugget include: