Size matters – and so does how you carry it!

The activities are as follows:

Stalk-eyed fly copulation.

In the wild, animals compete for limited resources. Things like food, water, shelter, and even reproductive mates can be hard to come by. Animals with traits and behaviors that make them more likely to survive and reproduce are said to have higher evolutionary fitness. Some animals have evolved special traits that advertise their fitness to potential mates. Male deer, elk, and moose have large antlers that they use to compete with other males, which demonstrates their fitness to females. Another interesting example is the stalk-eyed flies, in which the males grow long eye stalks to attract a mate. In these cases, females are more likely to choose males with the biggest traits.

Scientists have long predicted that these traits come with both benefits and costs. Large antlers or eyestalks may help a mate notice you, but also come with some costs. Extra weight takes more energy to move around and could make it more difficult to escape from predators. And yet, many studies have failed to find any measurable costs to males having these seemingly impractical traits.

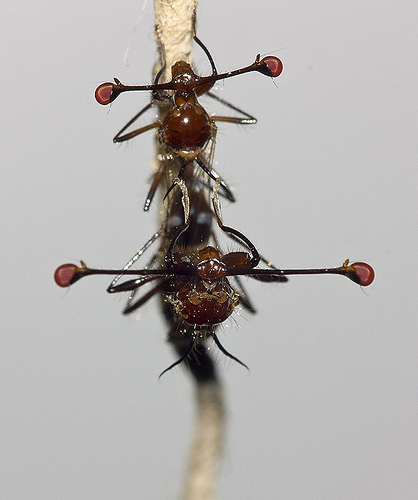
This scientific mystery puzzled Jerry and John, who study stalk-eyed flies. They had failed to identify and document any costs to having longer eyestalks, measured as the distance between the eyes, or eyespan. Common sense told them that having longer eye stalks should make flying more awkward for these flies. However, their data did not support this hypothesis. “When I started collecting data, I focused a lot on the performance costs and got kind of fixated on that,” John says of the team’s initial research. “It was frustrating when we couldn’t identify any actual decline in performance.”

John in the field when he first started his research – many decades ago!

The team began looking for an alternative explanation. They read about research supporting a new idea in a completely different kind of flying animal – barn swallows. Male barn swallows have long, ornate tails. These tails make male barn swallows less aerodynamic during flight. But males have also evolved to have larger wings relative to their body size. This could help them compensate for the extra burden associated with their long tails.

Jerry and John wondered if a similar thing might be at work in stalk-eyed fly wings. Perhaps the male stalk-eyed flies, like male barn swallows, had evolved to have larger wings relative to their body size to help them compensate for long eye stalks when flying. If this were the case, then they expected to see a positive correlation between wing size and eyespan. Could this be why they were unable to measure any disadvantage associated with having longer, more awkward eye stalks? In other words, male stalk-eyed flies with larger wings would be able to support longer eye stalks.

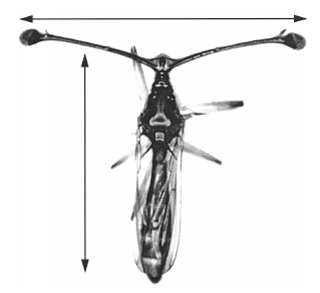
Eyespan (horizontal arrow) and body size (vertical arrow) of a stalk-eyed fly.

Jerry, John, and their team decided to test their new hypothesis by raising stalk-eyed flies in the lab to maturity, then collecting data about their body length, eyespan, and wing area.

To account for natural variation in body size among stalk-eyed flies, the team needed to use “relative” measurements based on body size. With these kinds of measurements, a value of zero (0) means that wing size or eyespan is exactly what you would predict for a fly of that body size. Negative values mean that wing size or eyespan are smaller than you would predict for that body size, while positive values mean that wing size or eyespan is greater than you would predict for that body size. For example, if a fly has a relative eyespan of -0.010, then the distance between the eyestalks was 0.010 millimeters shorter than expected based on its body size.

Featured scientists: Jerry Husak from the University of St. Thomas and John Swallow from the University of Colorado-Denver. Written by: Sam Holloway

Flesch–Kincaid Reading Grade Level = 8.8

Additional teacher resources related to this Data Nugget include:

You can find lessons to accompany many of John’s studies with insects on the Data Nuggets website! Check out the following Data Nugget activities!

A peer-reviewed journal article: Husak, J. F., Ribak, G., Wilkinson, G. S., & Swallow, J. G. 2011. Compensation for exaggerated eye stalks in stalk‐eyed flies (Diopsidae). Functional Ecology, 25(3), 608-616.

A video of a stalk-eyed fly in flight:
Ant wars!

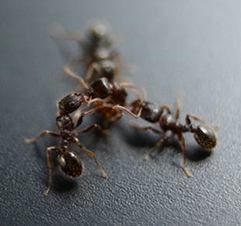
Three pavement ants touch antennae to determine if they are nestmates. Photo courtesy Michael Greene.

The activities are as follows:

The ants crawling into and out of cracks along sidewalks are called pavement ants. They live in groups called colonies, which are made up of a few queens and many worker ants. A colony lives together inside a nest, a physical structure. Worker ants use their antennae to touch the bodies of other ants. Certain chemicals tell them if the ant is from their colony or a different colony. Nestmates are ants from the same colony, and non-nestmates are ants from other colonies. 

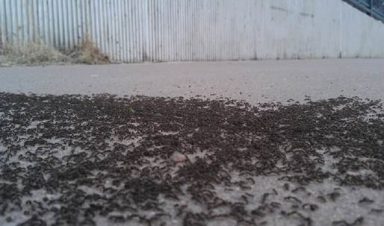
Neighboring colonies often compete for food, leading to tension. If an ant finds a non-nestmate, it organizes a large war against the nearby colony. This results in huge sidewalk battles that can include thousands of ants fighting for up to 12 hours! These ant wars often involve worker ants grabbing body parts of non-nestmate ants. 

Andrew, Jazmine, John, Mike, and Ken all work together to study the social and chemical cues that drive behaviors in animals. They were curious to learn more about the triggers that lead to colony wars. Worker ants don’t have a leader, so the scientists wanted to know how large wars are organized. The team started by reading lots of research articles and learned that there are several factors that may affect an ant’s decision to fight. These include the odor of other ants they meet, the size of the ant’s colony, and the season. The team also knew from their own experiments that if an ant meets a fellow nestmate before meeting a non-nestmate, it was more likely to fight.

A colony war involving thousands of pavement ants. Photo credit: Michael Greene.

All of this information helped the team realize that interactions with nestmates were an important part of the decisions that start ant wars with non-nestmakes. To build on this, they wanted to know whether the decision to fight was affected by ant density, which is the number of ants within an area. They thought that at higher densities the ants would be more likely to interact, leading to more fights with non-nestmates. If more wars are observed at higher ant densities, increased interactions with nestmates might be part of the story.

To answer their question, the team collected ants from different colonies in Denver, Colorado for two separate experiments. They brought them back to the lab to set up trials in a plastic tank arena.

Experiment 1: For the first set of behavioral trials, the researchers varied the number of ants in the tank, ranging from 2 to 20 ants. The size of the tank remained constant, and there were always equal numbers of nestmates and non-nestmates. This means the ratio of nestmates to non-nestmates was always 1:1, but the density varied by how many ants were included in the experiment. They performed 18 trials for each density treatment in their experiment.

At the start of every trial, ants from each colony were in separate areas so that they could interact with nestmates first. Earlier work had shown that when ants in each area interact, they touch antennae to another ant’s body. These interactions create a brain state that makes an ant more likely to fight an ant from another colony. Then the scientists removed a barrier revealing the ants from the other colony. They watched the ants for 3 minutes. During that time they recorded the number of ants that were fighting. This way they could compare how likely the ants were to fight at different densities. They predicted there would would be more fighting at higher ant densities.

Experiment 2: The scientists also wanted to measure the effect of density on the interaction rates between just nestmates. This experiment allowed the scientists to understand how the rate of interactions affected levels of neurochemicals in brains, creating the brain state that increased the likelihood that an ant would be aggressive. For these trials, they placed different densities of nestmate ants in a tank. They randomly picked an ant during each trial and counted the number of times it contacted a nestmate ant. Different groups of ants were used in each trial and each experiment. They observed the number of interactions at different densities and expected nestmate ants to have more interactions at higher densities.

Featured scientists: Andrew Bubak, Jazmine Yaeger, John Swallow, and Michael J. Greene from the University of Colorado-Denver; Kenneth Renner from the University of South Dakota. Written by: Gabrielle Welsh

Flesch–Kincaid Reading Grade Level = 9.0

Additional teacher resources related to this Data Nugget:

A news article about the research:

David vs. Goliath

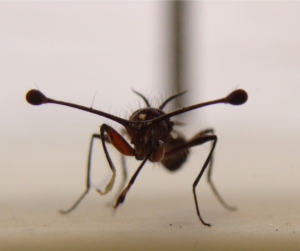
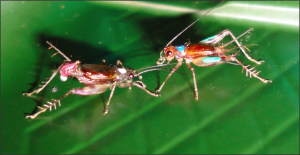
Stalk-eyed flies have their eyes at the end of long stalks on the sides of their head. These stalks are used by males when fighting for resources.

The activities are as follows:

Animals in nature often compete for limited resources, like food, territory, and mates. To compete for these resources, they use aggressive behaviors to battle with others of the same species. Aggressive behaviors are meant to overpower and defeat an opponent. The outcome of a battle depends on many different factors. In insects, one important factor is body size. Larger individuals are usually more aggressive and often win more battles. Chemicals in the brain can also influence who wins a fight. One chemical, called serotonin, can cause insects to have more aggressive behaviors. It is found in the brains of all animals, including humans.

Andrew had always been curious about what makes an animal decide to use aggressive behaviors in battle, or when to end one. He worked with researchers Nathan, Michael, Ken, and John to study the role that chemicals in the brain have on behaviors. The team was interested in how brain chemicals, like serotonin, affect aggression. They have been studying an insect species called stalk-eyed flies. These flies have eyes on the ends of long eyestalks that protrude from their heads. Male stalk-eyed flies use these eyestalks when battling each other. In a previous experiment, they found that serotonin can cause these flies to have more aggressive behaviors. They also knew that flies with shorter eyestalks usually lose fights to larger flies. 

This made them curious about whether extra serotonin could make flies with shorter eyestalks act more aggressive and help them win fights against flies with longer eyestalks. The team of researchers discussed what they knew from past research and predicted that if they gave serotonin to short eyestalk flies, it might help them win fights against long eyestalk flies. They thought this made sense because they already knew that serotonin make flies more aggressive, and more aggressive behaviors could help the shorter flies win more fights. 

The fighting arena where stalk-eyed flies battle. The camera is set up to help the scientists observe both the high intensity behaviors and retreats.

The team designed a lab study to look into this question about the importance of eyestalk length and serotonin for battles in stalk-eyed flies. First, the researchers raised male stalk-eyed flies in the lab. They made sure the flies were around the same age and were raised in a similar lab environment from the time they were born. Then, they measured the eyestalk length for each fly and divided them into two groups. One group had flies with longer eyestalks (Goliaths) and one group had flies with shorter eyestalks (Davids). They took the group of Davids with shorter eyestalks and fed half of them food with a dose of serotonin. This became the treatment group. They fed the other half of the Davids group food, but without serotonin. This was the control group. The treatment group and control group each had 20 flies.

To prepare the flies for battle, all flies were all starved for 12 hours before the competition to increase their motivation to fight over food. The researchers paired each David with a Goliath in a fighting arena. They observed the flies and recorded aggressive behaviors shown by each opponent. The researchers labeled any behavior where the fighting flies touch each other as a “high intensity behavior”. They labeled any behavior where the flies backed away as a “retreat”. Flies that retreated less than their opponent were declared the winners.

Featured scientists: Andrew Bubak, Nathan Rieger, and John Swallow from the University of Colorado, Denver; Michael Watt and Kenneth Renner from the University of South Dakota. Written by: Gabrielle Welsh.

Flesch–Kincaid Reading Grade Level = 9.3

Blinking out?

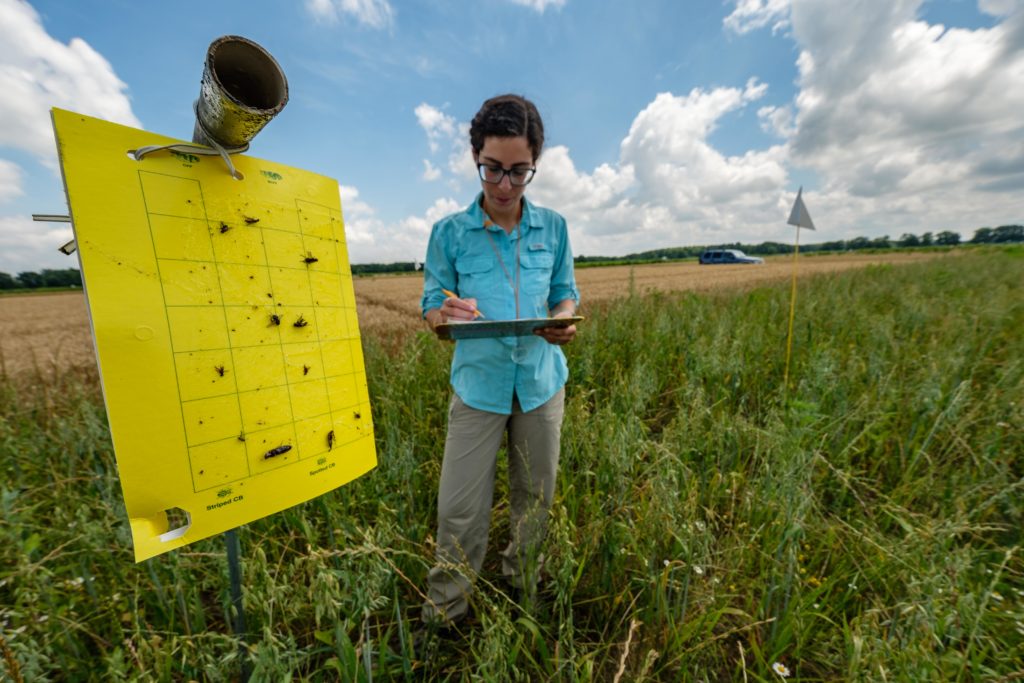
A researcher collects data from a yellow sticky card at the MSU KBS LTER site. Photo Credit: K. Stepnitz, Michigan State University.

The activities are as follows:

The longest surveys of fireflies known to science was actually started by accident!

At the Kellogg Biological Station Long-Term Ecological Research Site, scientists work together to answer questions that can only be studied with long-term data. Their focus is to collect data in the same way over many consecutive years to look for patterns through time. One of these long-term studies, looking at lady beetle populations, was developed to keep watch on these important species. To count lady beetles, scientists placed yellow sticky card traps out in the same plots year after year. These data are used to figure out if lady beetle numbers are changing over time.

Because sticky traps catch everything small that flies by, other insect species get stuck as well. One day, a research technician noticed this and decided to add a few new columns to the data sheet. That way they could start recording data on the other insect species found on the sticky traps. Each year the technician kept adding to the record and over time, more and more data were collected. One of those new columns happened to record the number of fireflies caught. Though the exact reason for this data collection is lost to history, scientists quickly realized the value of this dataset! 

Several years later, Julia became the lab technician. She took over the responsibility of the sticky trap count, adding to the dataset. Christie joined this same lab as a scientist and stumbled upon the data on fireflies that Julia and the previous technician had collected. She wanted to take advantage of the long-term data and analyze whether firefly populations had been increasing or decreasing. 

Many people have fond memories of watching fireflies blink across open fields and collecting them in jars as children. This is one of the reasons why fireflies are a beloved insect species. Julia grew up in southwest Michigan and fondly recalls spending summers watching them blink over yards and open fields, catching them in jars to watch them for a little while. Christie did the same in her parent’s yard in rural Ontario! That fondness never really went away and both enjoy watching the fireflies around Northeast Ohio where they currently live. Fireflies are also an important part of the ecosystems where they live. Larvae spend most of their time in the soil and are predators of insects and other small animals, such as snails. 

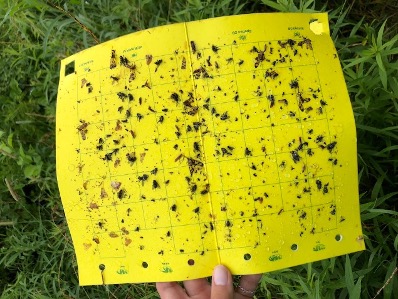
All the insects collected on a yellow sticky card trap over the course of one week. Photo credit: Elizabeth D’Auria, Michigan State University.

Many scientists and citizens alike have noticed that they aren’t seeing as many fireflies as they used to. Habitat loss and light pollution could be causing problems for fireflies. This is where the importance of long-term data really comes into play. Long-term data are critical to identifying and understanding natural population cycles over long periods of time that we wouldn’t be able to see with just a few years of data. It also gives scientists opportunities to answer unanticipated research questions. In this situation, even though the data were collected without a specific purpose in mind, having the dataset available offered new opportunities! Christie and Julia were able to look at the long-term changes in southwest Michigan firefly populations, something they would not have been able to do before the research technician added those extra columns. In order to start answering this question, they compiled all of the years of firefly data and began to compare the average counts from year to year. Although data were collected in multiple different habitat types, they focused on data from open fields because fireflies use these areas to find mates.

Featured scientists: Christie Bahlai and Julia Perrone from Kent State University. Data from the Kellogg Biological Station LTER.

Flesch–Kincaid Reading Grade Level = 10.7

Additional teacher resources related to this Data Nugget include:

Spiders under the influence

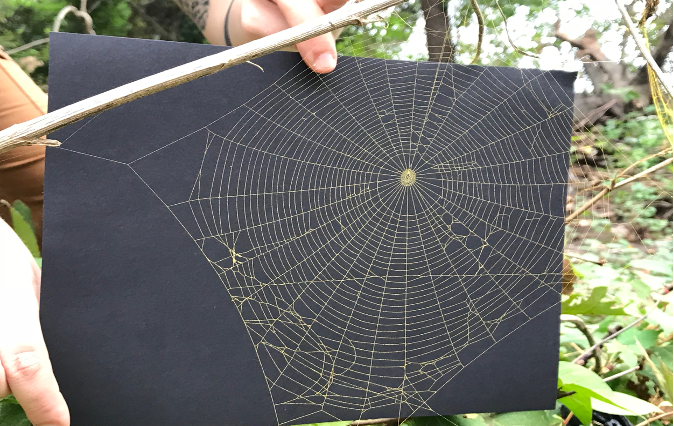
Field picture of an urban web. Dark paper is used to make the web more visible for data collection

The activities are as follows:

People use pharmaceutical drugs, personal care products, and other chemicals on a daily basis. For example, we take medicine when we are sick to feel better, and use perfumes and cologne to make ourselves smell good. After we use these chemicals, where do they go? Often, they get washed down our drains and end up in local waterways. Even our trash can contain these harmful chemicals. For example, when coffee grounds are thrown into the trash, caffeine gets washed into our waterways.

Animals in waterways, like insects, live with these chemicals every day. Many insects are born and grow in the water, absorbing the drugs over their lifetime. As predators eat the insects, the chemicals are passed on, working their way through the food web. For example, spiders living along riverbanks feed off aquatic insects and absorb the drugs from their prey.

Just as chemicals change human behavior, they change spider behavior as well! Effects of drugs on spiders have been studied since the 1940s. Dr. Peter Witt first discovered that chemicals change spider web construction. Peter gave caffeine, and a few other drugs, to spiders to see if they would build their webs during the day instead of at night, which is when they usually work. After giving his test spiders some of the drugs, the spiders still created their webs at night. However, he noticed something unexpected – the web structure of spiders on drugs was completely different from normal webs. The webs were different sizes and had more spacing between each thread. Normal webs help spiders to easily catch prey. Irregularly shaped webs were not good at catching prey because insects could fly right through the large spaces. After his study, Peter knew that drugs were bad for spiders.

Chris (they/them), a current resident of Baltimore and a spider enthusiast, lives in a watershed that is affected by chemical pollution. They wanted to build on Peter’s research by looking at spider webs in the wild instead of in the lab. Chris knew that many types of spiders live near streams and are exposed to toxins through the prey they eat. Chris wanted to compare the effects of the chemicals on spiders in rural and urban environments. By comparing spider webs in these two habitats, they could see how changed the webs are and infer how many chemicals are in the waterways.

Chris worked with Aaron, a local high school teacher, to do this research. They collected images of spiderwebs in areas around Baltimore. They chose two sites: Baisman Run, a rural site far from the city, and Gwynns Run, an urban site close to the city. Chris traveled to the sites and took pictures of eight spiderwebs at each location. Chris and Aaron expected that urban streams would have higher concentrations of chemicals than rural areas because more people live in cities.

When they got back to the lab, Aaron took the pictures and used a computer program to count the number of cells and calculate the total area of each web. These data offer a glimpse into whether spiders near Baltimore are exposed to harmful pharmaceutical chemicals and personal care products. If spiders are exposed to these chemicals, the webs will have fewer, but larger cells than a normal web. The cells will also have irregular shapes.

Featured scientists: Chris Hawn from University of Maryland Baltimore County and Aaron Curry from Baltimore Ecosystem Study LTER

Flesch–Kincaid Reading Grade Level = 7.8

Additional teacher resources related to this Data Nugget include:

  • You can watch Aaron describe his Research Experience for Teachers project here.


Beetle, it’s cold outside!

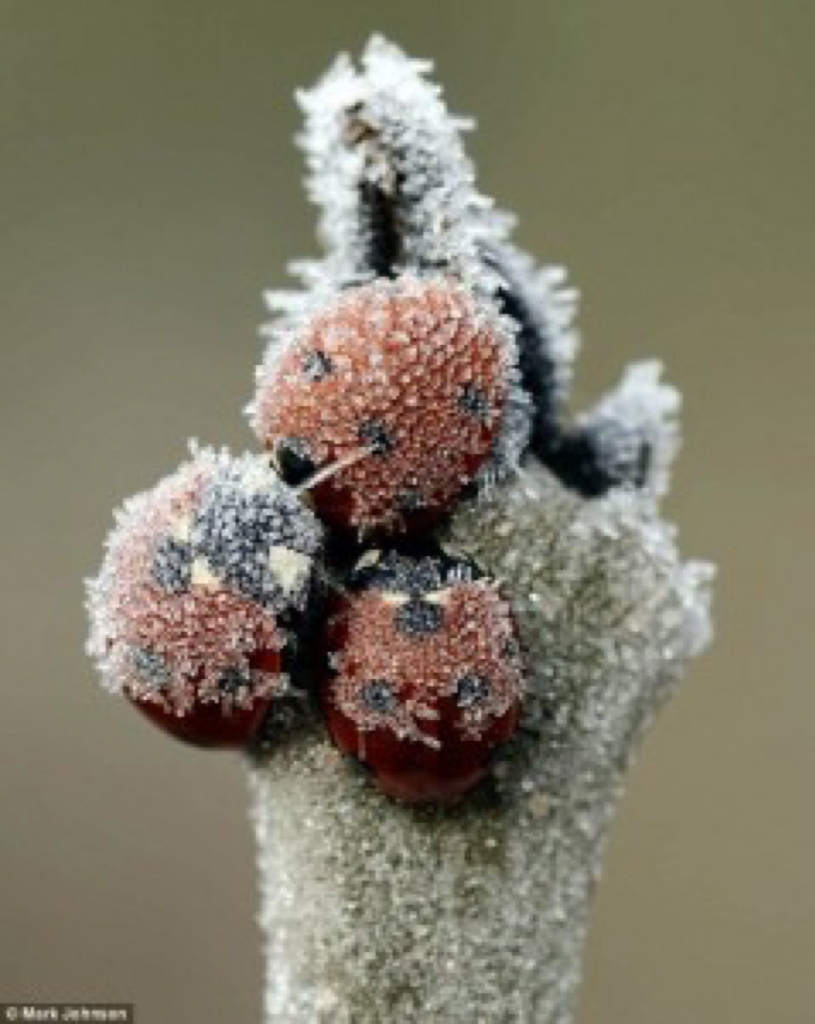
Frozen lady beetles.

The activities are as follows:

Éste Data Nugget también está disponible en Español:

Walking across a snowy field or mountain, you might not notice many living things. But if you dig into the snow, you’ll find a lot of life!

Until recently, climate change scientists thought warming in winter would be good for most species. Warmer winters would mean that species could avoid the cold and would not need to deal with freezing temperatures as often or for as long. Caroline is a scientist who is thinking about winter climate change in a whole new way. Snow covers the soil, acting like an insulating blanket. Many species rely on the snow for protection from the winter’s cold. When temperatures climb in the winter, snow melts and leaves the soil uncovered for longer periods of time. This leads to the shocking pattern that warmer temperatures actually means the soil gets colder!

Caroline is interested in how species that rely on the snow will respond to climate change. She studies a species of insect called lady beetles. Lady beetles are ectotherms, meaning their body temperature matches that of their environment. Because climate change is reducing the amount of snow in the lady beetle habitat, Caroline wanted to know how they would respond to these changes.

Caroline and her team, Andre and Nikki, decided to investigate what happens to lady beetles when they are exposed to longer periods of time in cold temperatures. When soil temperatures drop below freezing (0℃), lady beetles go into a chill coma, or a temporary, reversible paralysis. When temperatures are below freezing, it is so cold that they are unable to move. When temperatures rise back above freezing, they wake from their chill comas. When lady beetles are in chill comas, they are easier for predators to catch because they can’t escape. They are also unable to find food or mates. Scientists can measure how fast it takes lady beetles to recover from chill coma, called chill coma recovery time, and use this as a measure of their performance.

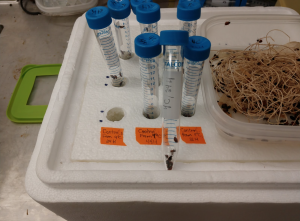
Beetles in their pre-testing habitat are on the right; tubes with beetles about to be immersed in a cooler filled with crushed ice are on the left.

They designed an experiment to test whether the amount of time lady beetles spend in freezing temperatures affects how long it takes them to wake up from a chill coma. Caroline thought that lady beetles exposed to lengthy freezing temperatures would be harmed because freezing causes tissue damage and the insect must use more energy to survive. She predicted that the longer the lady beetles had been exposed to the cold, the longer it would take them to wake up from their chill comas.

To begin the experiment, Andre and Nikki placed groups of lady beetles in tubes. They then placed the tubes in an ice bath, bringing the temperature down to 0℃, the point when lady beetles enter chill coma. They varied the amount of time each tube was in the ice baths and tested chill coma recovery times after 3, 24, 48, 72, or 96 hours. After removing the tubes from the ice baths, they put the lady beetles on their backs with their legs in the air and left them at room temperature, 20℃. Andre and Nikki timed how long it took each beetle to wake up and turn itself over.

In the experiment, they used two different populations of lady beetles. Population 1 had been living in the lab for several weeks before the experiment began. They were not in great health and some had started to die. In order to make sure they had enough beetles for the experiment, Caroline purchased more lady beetles, which she called Population 2. Population 2 only spent a few days living in the lab before testing and were in much better health. Caroline noted the differences in these populations and thought their age, health, and background might affect how they respond to the experiment. She decided to track which population the lady beetles were from so she could analyze the data separately and see if the health differences between Population 1 and 2 changed the results.

Featured scientists: Caroline Williams & Andre Szejner Sigal, University of California, Berkeley, & Nikki Chambers, Biology Teacher, West High School, Torrance, CA

Flesch–Kincaid Reading Grade Level = 9.8

Tree-killing beetles

A Colorado forest impacted by a mountain pine beetle outbreak. Notice the dead trees mixed with live trees. Forests like this with dead trees from mountain pine beetle outbreaks cover millions of acres across western North America.

The activities are as follows:

A beetle the size of a grain of rice seems insignificant compared to a vast forest. However, during outbreaks the number of mountain pine beetles can skyrocket, leading to the death of many trees. The beetles bore their way through tree bark and introduce blue stain fungi. The blue stain fungi kills the tree by blocking water movement. Recent outbreaks of mountain pine beetles killed millions of acres of lodgepole pine trees across western North America. Widespread tree death caused by mountain pine beetles can impact human safety, wildfires, nearby streamflow, and habitat for wildlife.

Mountain pine beetles are native to western North America and outbreak cycles are a natural process in these forests. However, the climate and forest conditions have been more favorable for mountain pine beetles during recent outbreaks than in the past. These conditions caused more severe outbreaks than those seen before.

Logs from mountain pine beetle killed lodgepole pine trees. The blue stain fungi is visible around the edge of each log. Mountain pine beetles introduce this fungus to the tree.

When Tony moved to Colorado, he drove through the mountains eager to see beautiful forests. The forest he saw was not the green forest he expected. Many of the trees were dead! Upon closer examination he realized that some forests had fewer dead trees than others. This caused him to wonder why certain areas were greatly impacted by the mountain pine beetles while others had fewer dead trees. Tony later got a job as a field technician for Colorado State University. During this job he measured trees in mountain forests. He carefully observed the forest and looked for patterns of where trees seemed to be dead and where they were alive.

Tony thought that the size of the trees in the forest might be related to whether they were attacked and killed by beetles. A larger tree might be easier for a beetle to find and might be a better source of food.To test this idea, Tony and a team of scientists visited many forests in northern Colorado. At each site they recorded the diameter of each tree’s trunk, which is a measure of the size of the tree. They also recorded the tree species and whether it was alive or dead. They then used these values to calculate the average tree size and the percent of trees killed for each site.

Featured scientist: Tony Vorster from Colorado State University

Flesch–Kincaid Reading Grade Level = 8.3

There is one scientific paper associated with the data in this Data Nugget. The citation and PDF of the paper is below:

Students can complete this Data Nugget along with Tony! In this video, Tony provides more background on how he became interested in doing research, how he collects his data, and details on how to construct graphs.

Why are butterfly wings colorful?

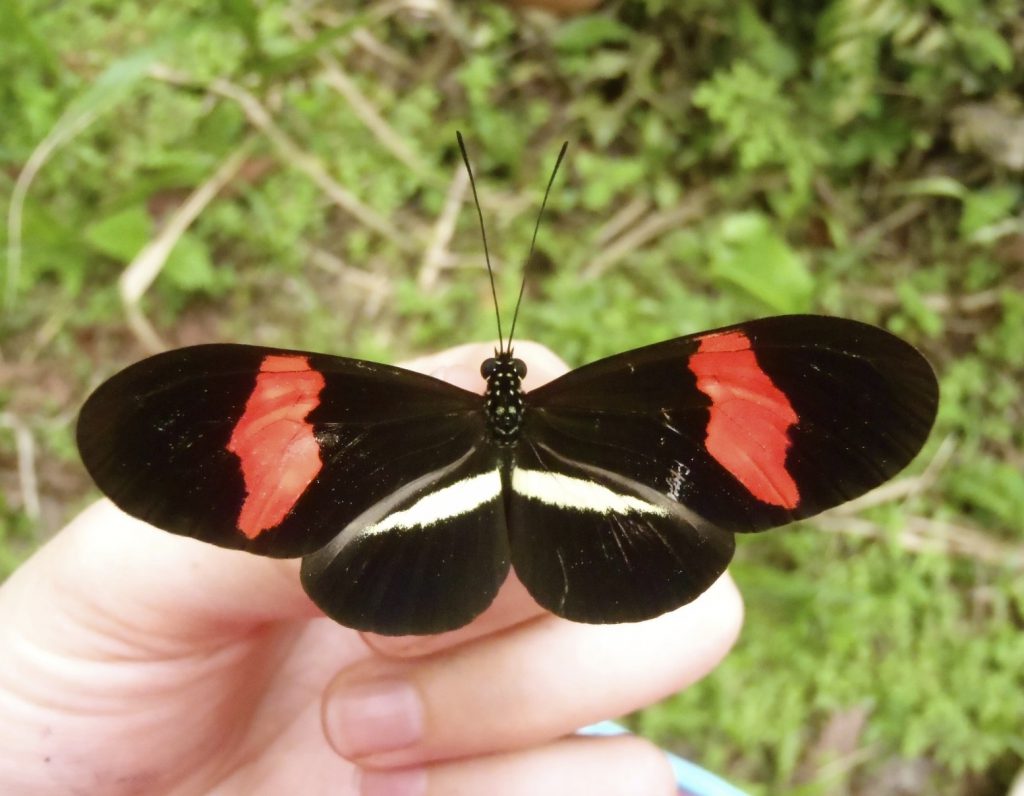
The red postman butterfly, Heliconius erato.

The activities are as follows:

Éste Data Nugget también está disponible en Español:

You’ve probably noticed a bright orange butterfly in your garden. It’s hovering over a plant, and then pausing to lay an egg. It’s landing on a flower, and then sipping the tasty syrup. Big wings allow butterflies to fly everywhere with ease. But you may wonder, why are their wings so brightly colored? One reason why butterflies might have brightly colored wings is that these colors warn birds and other predators that they would not make a tasty meal. Another potential reason for butterflies to have bright colors and dramatic patterns is to attract mates. However, there is little research that shows whether color alone or color pattern together deter predators or attract mates.

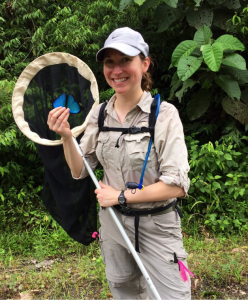
Susan holding a different species of butterfly in the field.

The red postman butterfly lives in rainforests in Mexico, Central America, and South America. The color pattern on its wing is usually a mix of red, yellow, and black. These patterns vary a lot depending on their location; for instance one variant has a red bar on the forewings and a yellow bar on its hind wings while another variant has red rays on the hindwings and a yellow bar on the forewings. Scientists Susan, Adriana, and Robert have been studying this species for many years. While hiking in the rainforest, they noticed that not all butterfly species are brightly colored. They started to wonder why the red postman butterfly has bright colors, but other species do not. They thought maybe the red and yellow colors and patterns signaled toxicity to predators, like birds; or these wing features may be used to help find and attract mates. Susan, Adriana and Robert predicted that brightly colored butterflies would be avoided by birds and approached more often by other butterflies of the same species. They also predicted that the local color pattern would get the strongest response from predators and mates, because it would be most recognized in that area.

To test their ideas, the team of butterfly scientists created three kinds of artificial red postman butterfly models using paper and a printer. Each model had a plastic body and paper wings. Model A had the same pattern as the local butterflies at the study site in the La Selva Tropical Biological Station in Sarapiquí, Costa Rica, with brightly colored red and yellow wings. Model B also had the same pattern as the local butterflies, but only had black and white tones. Model C had a different pattern than the locals with bright red and yellow colors.

One of the 400 black and white models in the rainforest during the experiment.

To test for differences in predation attempts based on wing color and patterns, they placed 4 of each model at 100 different sites in the rainforest. This made a total of 1,200 model butterflies with 400 of each type! Models were placed far enough apart that they were not within human visible range from one another (on average separated by 5-10 m), and were positioned approximately 1.5 m above the ground, which is consistent with natural roosting heights. The models were left out in the forest for a total of 96 hours. Each day they were inspected and counted for bird beak marks on their wings and plastic bodies. Only new marks were scored each day, so attacks on individual models were only counted once. To test whether red postman butterflies were more attracted to bright colors, or the local wing pattern, Susan and her student field assistants also caught 51 wild red postman butterflies from the rainforest and brought them to a greenhouse. They then presented the live butterflies with the three models and counted how many times they approached each model type.

Featured scientists: Susan Finkbeiner, Adriana Briscoe, and Robert Reed from University of California, Irvine

Flesch–Kincaid Reading Grade Level = 9.9

Watch two videos of experimental trials from the greenhouse experiment:

The first shows a male butterfly approaching a butterfly paper model with color. The second shows a butterfly as it chooses between a butterfly paper model that is black-and-white and one that has color.

poster
Video Trial 1
00:00
--
/
--
poster
Video Trial 2
00:00
--
/
--

There are two publications related to this Data Nugget:

You can follow all three scientists on Twitter where they tweet about the latest scientific discoveries involving butterflies, animals, vision and behavior! Adriana @AdrianaBriscoe, Susan @Fink_about_it, and Robert @FascinatingPupa.

SaveSave

SaveSave

SaveSaveSaveSave

SaveSave

SaveSave

SaveSave

SaveSave

SaveSave

SaveSave

SaveSave

SaveSave

SaveSave

SaveSave

SaveSave

SaveSave

To bee or not to bee aggressive

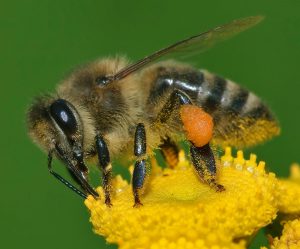
A honey bee (Apis mellifera) collecting nectar to bring back to the hive. Photo by Andreas Trepte.

The activities are as follows:

Honey bees are highly social creatures that live in large colonies of about 40,000 individuals and one queen. Every member of the hive works together to benefit the colony. Some of the tasks adult bees perform include making honey, nursing young, foraging for food, building honey comb structures, and defending the colony.

From spring through fall, the main task is turning nectar from plants to honey. The honey is stored and eaten over the winter, so it is vital for the colony’s survival. Because honey is an energy-rich food source, hives are targets for break-ins from animals, like bears, skunks, and humans that want to steal the honey. Bees even have to fight off bees from other colonies that try to steal honey. Research shows that colonies adjust their defenses to match threats found in their environment. Hives in high risk areas respond by becoming more aggressive, and hives that do not face a lot of threats are able to lower their aggression. This flexibility makes sure they do not waste energy on unnecessary behaviors.

Clare is a scientist studying the behavior of social animals. There is an interesting pattern seen in other social animals, including humans, that Clare wanted to test in honey bees. In these species, the social environment experienced when an individual is young can have lasting effects on their behavior later in life. This may be because this is the time that the brain is developing. She thought this would likely be the case with honey bees for two reasons. First, bees can use social information to help coordinate group defense. Second, young bees rely completely on adult bees to bring them food and incubate them, so there are a lot of social interactions when they are young. After reading the literature and speaking with other honey bee experts, Clare found out that no one had ever tested this before!

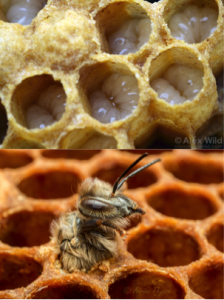
Honey bee larva (top) and an emerging adult (bottom).

Clare chose to look at aggression level as a behavioral trait of individual bees within a colony. She predicted that young honey bees raised in an aggressive colony would be more aggressive as adults, compared to honey bees raised in a less aggressive colony. To test her predictions, Clare used 500 honey bee eggs from 18 different queens. To get these 500 eggs she collected three times in the summer, for two years. Each time she collected, she went to two different locations. Collecting from so many different queens helped Clare make sure her study included eggs with a large genetic diversity.

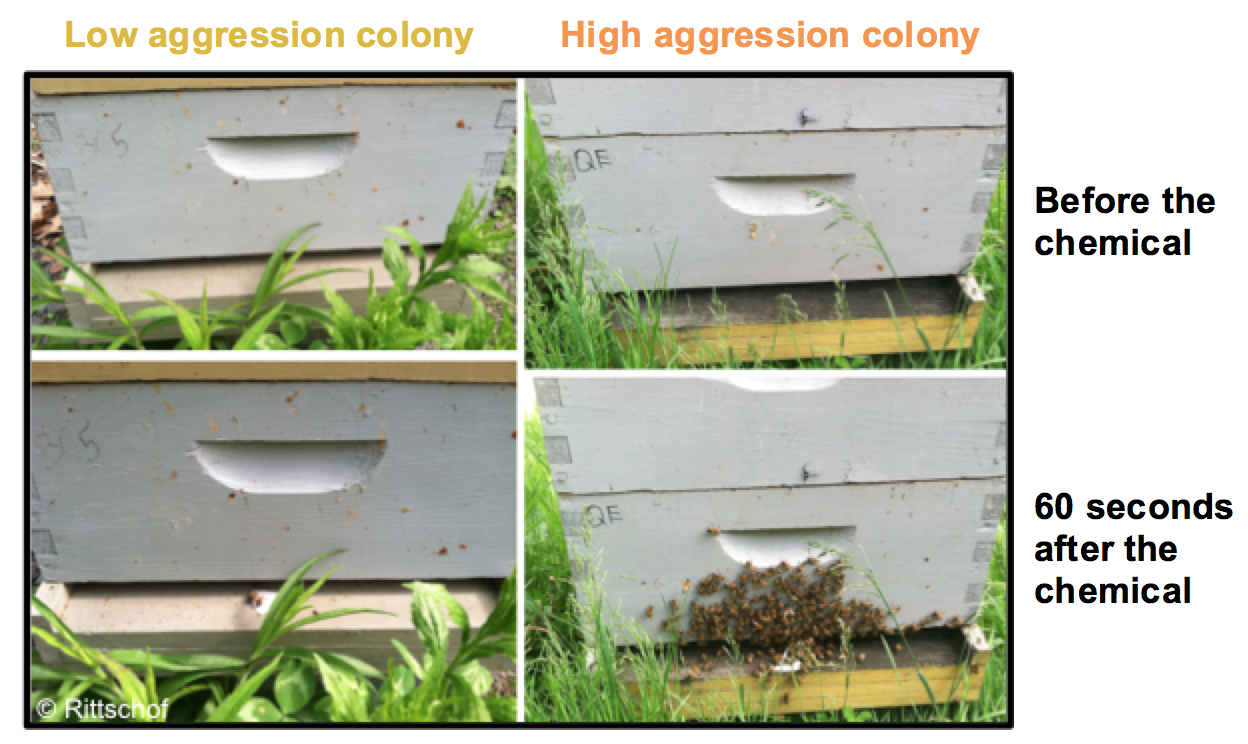
To test her questions, she used these eggs to set up an experiment. Eggs from each of the 18 queens were split into two groups. Each group was put into one of two types of foster colonies – high aggression and low aggression. Clare determined whether each foster colony was considered high or low aggression using a test. Because half of each queen’s eggs went into a low aggression foster colony, and the other half in a high aggression foster colony, this represents the experimental treatment.

Clare left the foster colonies alone and waited for the bees to develop in the hives. Eggs hatch and turn into larvae. These larvae mature into pupae and then into adults. Just before the young bees emerged from their pupal stage to adulthood, Clare removed them from the foster colonies and brought them into the lab. This way the bees would spend their whole adult life in the lab together, sharing a common environment.

After a week in the lab, Clare tested the aggressiveness of each individual bee. Her test measured aggressive behaviors used by a bee to defend against a rival bee from another colony. Clare observed and counted a range of behaviors including attempts to sting the rival and bites to the rival’s wings and legs. She used these values to calculate an offspring aggression score for each bee.

To select high and low aggression foster colonies to be used in her experiment, Clare first had to identify which colonies were aggressive and which were not. To do this, she put a small amount of a chemical that makes bees aggressive on a piece of paper at the front of the colony entrance. The top two photos show two colony entrances before the chemical. The bottom two photos show the same two colonies 60 seconds after the chemical. The more bees that come out, the more aggressive the colony. You can see from these images that the colony on the right is much more aggressive than the colony on the left. Clare counted the number of bees and used this value to calculate the colony’s aggression score.

Featured scientist: Clare C. Rittschof from the University of Kentucky

Flesch–Kincaid Reading Grade Level = 9.2

SaveSave

SaveSave

SaveSave

Bon Appétit! Why do male crickets feed females during courtship?

Mating pair of Hawaiian swordtail cricket with macrospermatophore on the male (left). The male and female (right) are marked with paint pens for individual identification.

Mating pair of Hawaiian swordtail cricket with macrospermatophore on the male (left). The male and female (right) are marked with paint pens for individual identification.

The activities are as follows:

In many species of insects and spiders, males provide females with gifts of food during courtship and mating. This is called nuptial feeding. These offerings are eaten by the female and can take many forms, including prey items the male captured, substances produced by the male, or parts from the male’s body. In extreme cases the female eats the male’s entire body after mating! Clearly these gifts can cost the male a lot, including time and energy, and sometimes even their lives.

So why do males give these gifts? There are two main hypotheses explaining why nuptial feeding has evolved in so many different species. First, giving a gift may attract a female and improve a male’s chance of getting to mate with her, or of fathering her young. This is known as the mating effort hypothesis. Second, giving a gift may provide the female with the energy and nutrients she needs to produce young. The gift helps the female have more, or healthier, offspring. This is known as the paternal investment hypothesis. These two hypotheses are not mutually exclusive – meaning, for any given species, both mechanisms could be operating, or just one, or neither.

Biz is a scientist who studies nuptial gifts, and they work with the Hawaiian swordtail cricket. They chose this species because it uses a particularly interesting example of nuptial feeding. In most other cricket species, the male provides the female with a single package of sperm, called a spermatophore. After sperm transfer, the female removes the spermatophore from her genitalia and eats it. However, in the Hawaiian swordtail cricket, males produce not just one but a whole bunch of spermatophores over the course of a single mating. Most of these are smaller, and contain no sperm – these are called “micros”. Only the last and largest spermatophore to be transferred, called the “macro” actually contains sperm. The number of micros that a male gives changes from mating to mating.

From some of their previous research, and from reading papers written by other scientists, Biz learned that micros increase the chance that a male’s sperm will fertilize some of the female’s eggs. Also, the more micros the male gives, the more of the female’s offspring he will father. This research supports the mating effort hypothesis for the Hawaiian swordtail cricket. Knowing this, Biz wanted to test the paternal investment hypothesis as well. They wanted to know whether the “micro” nuptial gifts help females lay more eggs, or help more of those eggs hatch into offspring.

Biz used two experiments to test the paternal investment hypothesis. In the first experiment, 20 females and 20 males were kept in a large cage outside in the Hawaiian rainforest. The crickets were allowed to mate as many times as they wanted for six weeks. In the second experiment, 4 females and 4 males were kept in cages inside in a lab. Females were allowed to mate with up to 3 different males, and were then moved to a new cage to prevent them from mating with the same male more than once. In both experiments Biz observed all matings. They recorded the number of microspermatophores transferred during each mating and the number of eggs laid. If females that received a greater number of total micros over the course of all matings produced more eggs, or if their eggs had a higher rate of hatching, then the paternal investment hypothesis would be supported.

Featured scientist: Biz Turnell from Cornell University and Technische Universität Dresden

Flesch–Kincaid Reading Grade Level = 8.9

Additional teacher resources related to this Data Nugget include: