Do you feel the urban heat?

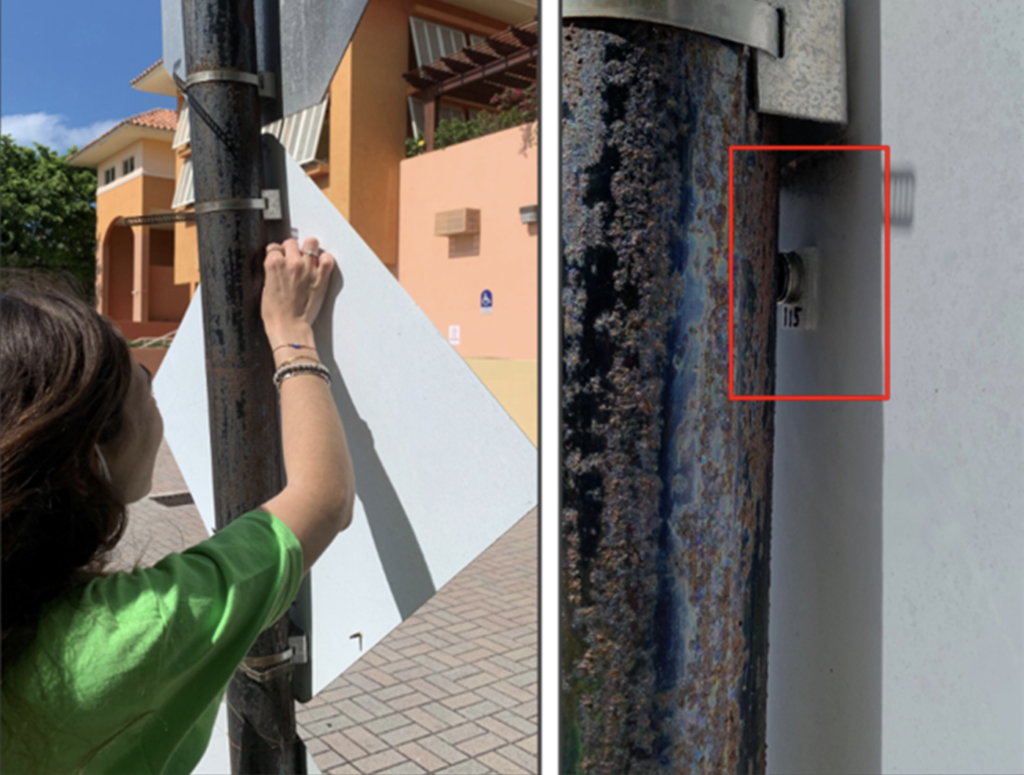
Attaching a heat sensor to a street sign in Miami to monitor urban temperatures.

The activities are as follows:

Record-breaking temperatures climb higher every year, and Florida is no exception. In Florida, the impact of climate change is felt mostly during the hurricane season. Storms are becoming more violent and show up earlier in the season. These extreme temperatures and weather events affect living organisms of all types, including humans. Outdoor workers, the elderly, and all people who lack adequate housing are susceptible to temperature changes in the environment.

Heat sensor ready to be put out into the city.

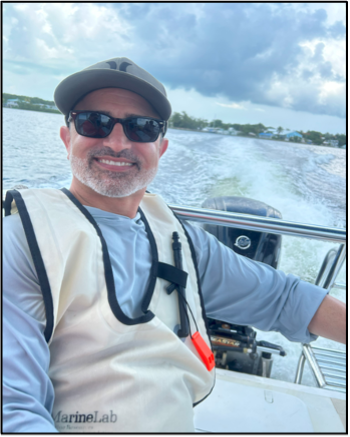
Irvin teaches science at a high school in Miami, Florida. On his way to work, he listens to a local radio station to catch up on the news. One day the radio hosts were talking about an increase in homelessness in Miami and other cities. They also brought up the record heat that the U.S. was experiencing and how this may affect those without homes. This conversation on the radio made Irvin think. He reflected on the impact that such high heat could have on individuals who sleep without air conditioning.

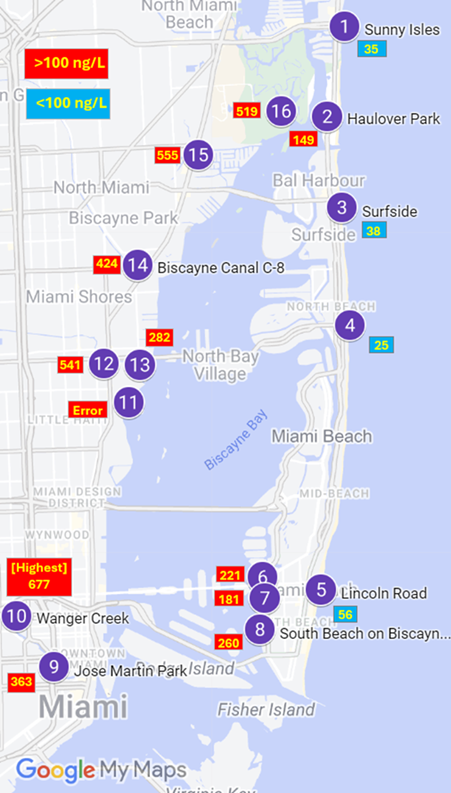
This inspired Irvin to learn more about what could be done to mitigate the impact of climate change in his city. Irvin joined a program that invites teachers to work in scientists’ labs in the summer to gain research experience. Irvin was matched with Tiffany, a scientist interested in how urban heat can change based on structures like concrete buildings, urban dwellings, and unshaded places. Irvin took this opportunity to explore how high temperatures in Miami affect the daily lives of people living there. First, Irvin started looking into how temperatures are reported in Miami. He learned that there was just a single sensor stationed at the nearby airport. The heat and humidity readings from this one sensor are used by local officials to alert the entire city about dangerous heat levels. Alerts are issued when the heat index reaches 108 degrees Fahrenheit or higher. Heat index is a value that represents how the body feels temperature when humidity is factored in. With these alerts, people can take action by spending less time outside.

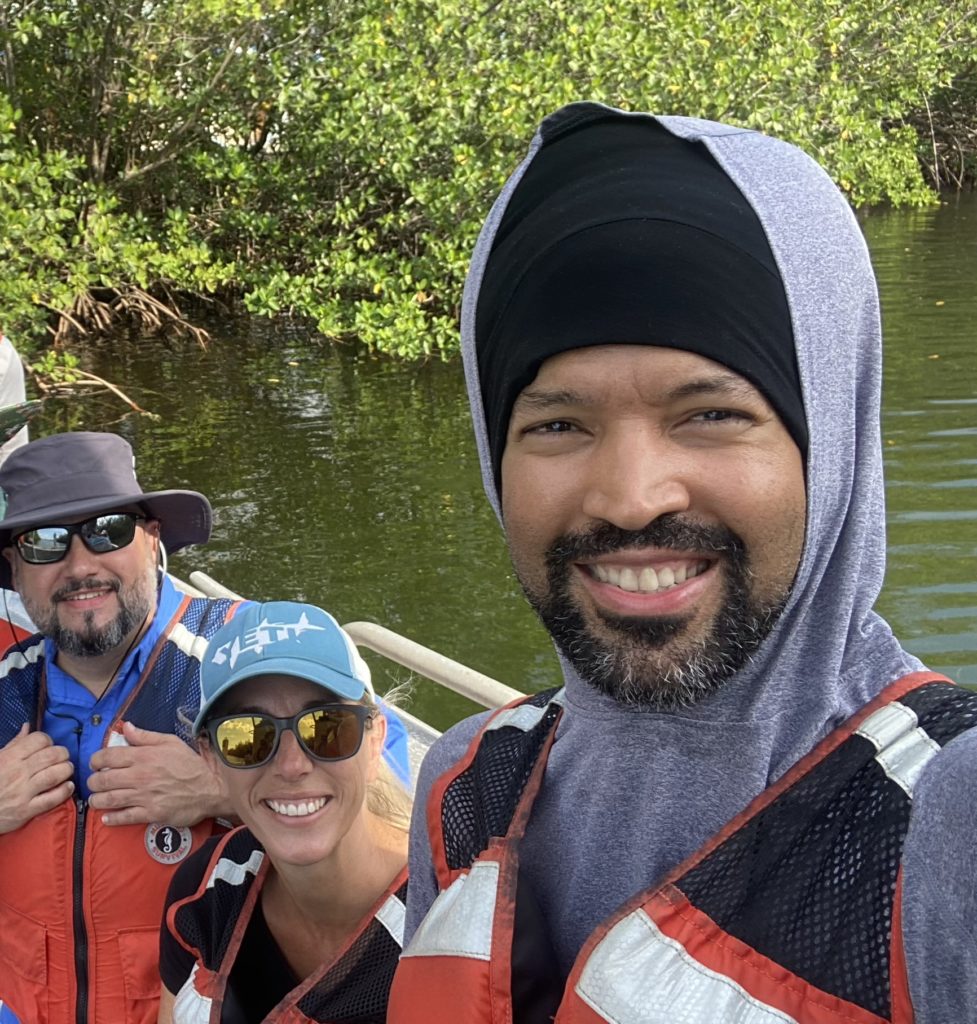
Teachers visiting the mangroves in Miami on a record heat day.

Irvin realized that no matter how reliable the sensor at the airport is, there is likely a larger range of temperatures within the city. He wanted to know whether the temperatures at the airport were similar to the heat felt at places where people spend time outside.

Tiffany’s research team had already started to collect temperature data in urban places where they hadn’t been recorded before. Since 2018, her lab placed hundreds of small heat sensors around the city. The sensors go out for 3 months and then the team collects them, records their data, and places them back out into new areas of the city.

Irvin wanted to compare areas that varied in coverage from the sun. He focused on sites where people gathered and spent long periods of time outside – bus stops. Some of the sites he chose had shade from trees, some had a roof providing partial sun cover, and other sites were totally exposed with no shade. Irvin took photos of each bus stop and used them to classify all sites as either full coverage, partial coverage, or no coverage. He used data from the airport as a control comparison to his bus stop sites.

Featured scientists: Irvin E. Arce (he/him) and Tiffany Troxler (she/her) from Florida International University
Flesch–Kincaid Reading Grade Level = 9.6

Trees and the city

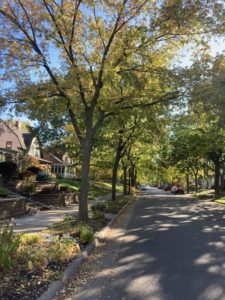
A neighborhood with many tree species and a lot of tree cover.

The activities are as follows:

We often imagine nature as being a place outside of cities. But within our cities, we are surrounded by nature – in fact, most human interactions with nature happen within urban areas. Picturing a tree, we might imagine it in a remote forest, yet many trees are planted by residents and local governments within cities. Trees provide important benefits, such as beauty and shade. The number and types of tree species that are planted in a neighborhood can increase the benefits received from trees in urban areas.

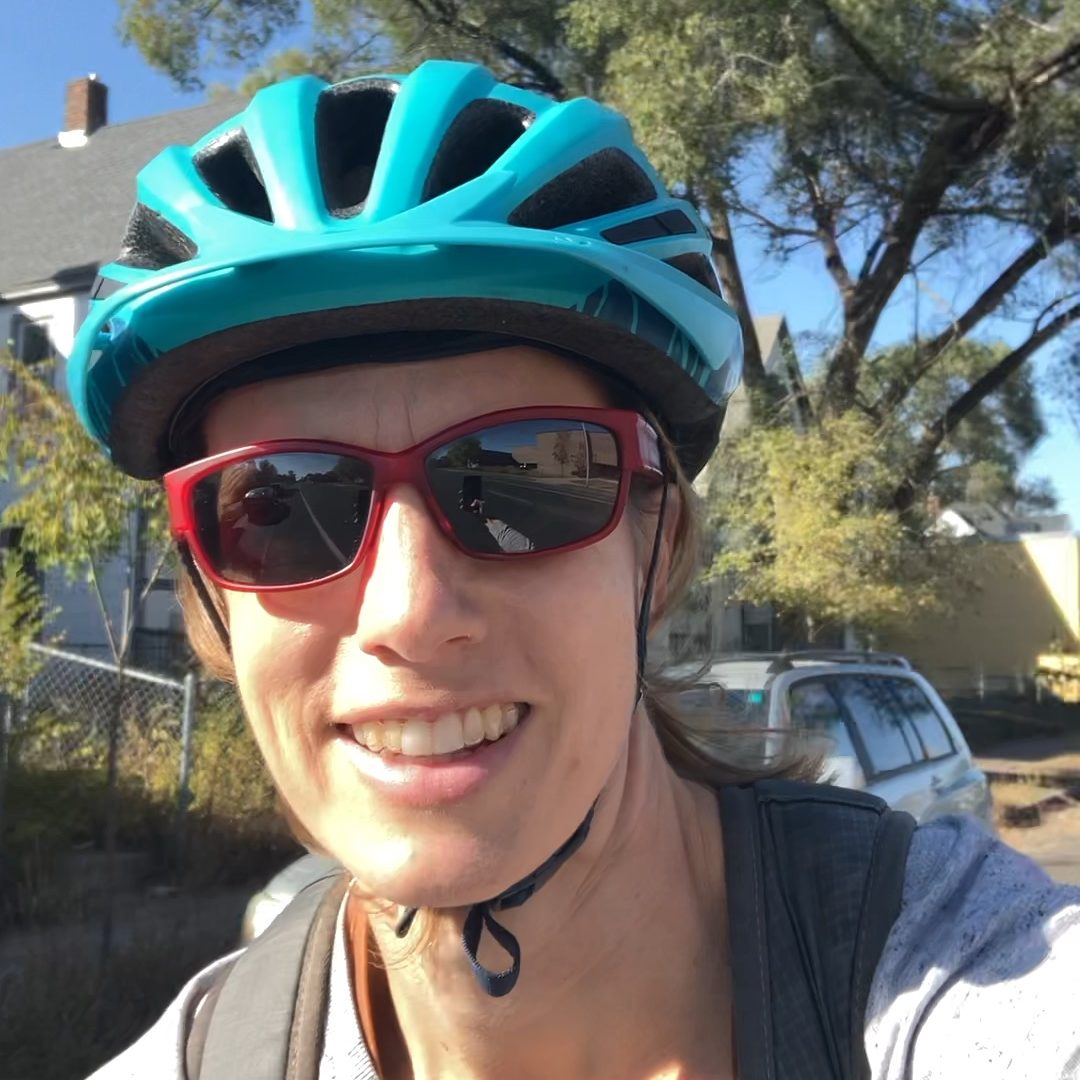
When Adrienne first moved to the Twin Cities in Minnesota, she started exploring Minneapolis and St. Paul by bike. Biking is done at a slow enough pace that she can travel long distances but still make observations about neighborhoods in these cities. As an ecologist, she naturally found herself looking for patterns in trees. For example, she noticed some older neighborhoods in St. Paul have a lot of large trees that provide plenty of shade and tree cover. In other neighborhoods, Adrienne saw fewer types of trees and noticed that she spent less time shaded by branches and leaves.

Adrienne biking around Minneapolis-St. Paul.

Adrienne started conversations with her colleagues about their observations of differences in urban landscapes. They discussed the ways in which laws, policies, and practices (“the way things are done”) give advantages to certain groups of people over others. These advantages are woven into our cultural systems.

Adrienne and her fellow researchers expected that neighborhoods with wealthier and more white residents would have benefited from a long history of greater investment.

Therefore, these neighborhoods were expected to have greater tree cover from the large old trees that have been growing there for many years. They also expected these neighborhoods would have more types of trees. In contrast, the researchers expected that less wealthy neighborhoods and those with a greater percentage of Black, Indigenous, and other People of Color (BIPOC) would have less tree cover and fewer types of trees because of chronic lower investment in these neighborhoods.

To research these ideas, Adrienne and her colleagues combined three different sources of publicly available data:

  • U.S. Census data, used to estimate % BIPOC and average median household income per ‘Block Group’ (similar to a neighborhood).
  • Satellite images, which are often used to estimate % tree cover, measure the percent of land area covered by the tree canopy. Adrienne looked at tree cover in the Block Group areas used in the Census.
  • City data that include the location and species for each tree planted along public streets to calculate tree species richness in each Block Group. Tree species richness is the number of different tree species in an area and is a measure of tree biodiversity used by many ecologists.

Featured scientists: Adrienne Keller (she/her) from the University of Minnesota

The data in this activity are from the MSP Long-term Ecological Research Site. The focus of the research at this site is centered on ecological interactions in urban environments. You can learn more here.

Flesch–Kincaid Reading Grade Level = 9.4

Additional teacher resources related to this Data Nugget include:

  • You can have students read more about environmental justice research from the MSP LTER in this peer-reviewed article (email us at datanuggetsk16@gmail.com if you need a downloadable version):
    • Rebecca H. Walker, Hannah Ramer, Kate D. Derickson & Bonnie L. Keeler (2023) Making the City of Lakes: Whiteness, Nature, and Urban Development in Minneapolis. Annals of the American Association of Geographers, DOI: 10.1080/24694452.2022.2155606
  • This short video features Adrienne as she describes the motivation and process behind her research study.

Salty sediments? What bacteria have to say about chloride pollution

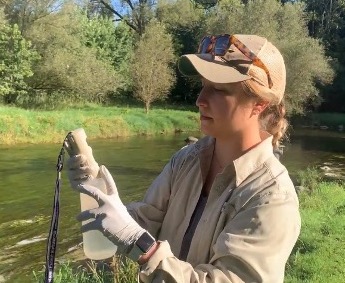
Lexi taking water quality measurements at Cedar Creek in Cedarburg, WI.

The activities are as follows:

In snowy climates, salt is applied to roads to help keep them safe during the winter. Over time, salt – in the form of chloride – accumulates in snowbanks. Once temperatures begin to warm in the spring, the snow melts and carries chloride to freshwater lakes, streams, and rivers. This runoff can quickly increase the salt concentration in a body of water. 

In large amounts, salt in the water is harmful to aquatic organisms like fish, frogs, and invertebrates. However, there are some species that thrive with lots of salt. Salt-loving bacteria, also known as halophiles, grow in extreme salty environments, like the ocean. Unlike other bacteria and organisms that cannot tolerate high salinity, halophiles use the salt in the environment for their day-to-day cellular activities. 

Lexi is a freshwater scientist who is interested in learning more about how ecosystems respond to this seasonal surge of chloride in road salts. She thought that there may be enough chloride from the road salt after snowmelt to change the bacteria community living in the sediment. More salt would support halophiles and likely harm the species that cannot tolerate a lot of salt. 

By taking a water sample and measuring the chloride concentration, we can see a snapshot in time of how toxic the levels are to organisms. However, the types of bacteria in sediments take a while to change. Halophiles may be able to tell us a long-term story of how aquatic organisms respond to chloride pollution. Lexi’s main goal is to use the presence of halophiles as a measure of how much chloride has impacted the health and water quality of river or stream ecosystems. This biological tool could also help cities identify areas that may be getting salted beyond what is necessary to keep roads safe.

Lexi expected that there would be few, or maybe no, halophiles in rural areas where there are not many roads. She also thought halophiles would be widespread in urban environments where there are many roads. Because salt impacts the streams year after year, she expected that halophiles would become permanent members of the microbial community and increase in winter and spring. Therefore, she also wanted to track whether halophiles remain in the sediment throughout the year, increasing in numbers when salt levels become high. 

She began to sample sediments from two different rivers in Southeastern Wisconsin. The urban Kinnickinnic River site is in Milwaukee, WI, and the Menomonee River site is in a rural environment outside of the city. She selected these sites because they offer a good comparison. Because there are more roads, and thus saltier snowmelt, the Kinnickinnic site in the city should have higher chloride concentrations than the Menomonee site. 

When visiting her sites throughout the year, Lexi collected multiple water and sediment samples. Every time she visited, she also recorded important water quality characteristics such as pH, conductivity, and temperature of the water. She then brought the samples to the laboratory and analyzed each for its chloride concentration. To measure the quantity of halophiles in the sediment, Lexi used a process where the sediment is shaken in water to separate the bacteria from the sediment and suspend them in the water. Samples from the water were then plated on a growth medium that contained a very high salt concentration. Because the growth medium was so salty, Lexi knew that if bacteria colonies grew on the plate, they would most likely be halophiles because most bacteria do not thrive in salty environments. Lexi counted the number of bacteria colonies that grew on the plates for each sample she had collected.

Featured scientist: Lexi Passante from the University of Wisconsin-Milwaukee

Flesch–Kincaid Reading Grade Level = 12.0

Some videos about Lexi and her research:

Additional teacher resources related to this Data Nugget:

Love that dirty water

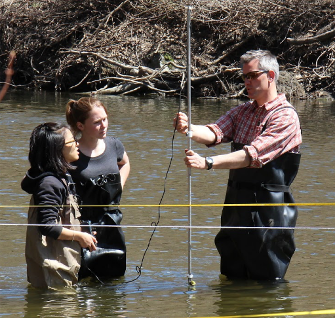
Drew and students measuring river flow rate.

The activities are as follows:

Forests, wetlands, and other green spaces are natural filters for water; water is cleaned as it is used by plants and travels through soils. As green spaces are lost to make room for homes and businesses, ecosystems are less able to provide this service. Without natural filtration from green spaces, humans must build expensive water treatment systems or risk drinking contaminated water.

Impervious surfaces, like roads, buildings, and parking lots, do not allow water to pass through. When it rains or snows on an impervious surface, water cannot soak into soil or be used by plants. Instead, it quickly flows into nearby streams and rivers. If too much water runs off too quickly, it overwhelms local sewer systems, getting into rivers before it can be filtered. This dirty water may carry human waste and toxic materials. 

Impervious surfaces have become a major problem for both the health of river ecosystems, and the health of people who depend on them as a clean source of drinking water. How land is used in a watershed, or the network of land and rivers that flow to a single point as they empty out into the ocean, is an issue of great concern.

Jonathan is a scientist studying land use. He became interested in science after traveling around the country and working as a wilderness ranger and wildland firefighter. At the Harvard Forest, members of his lab study how land use decisions affect the environment. They used computer simulations to create maps of what New England’s landscape could look like under different possible futures. Their web-tool is called the New England Landscapes Futures Explorer. Johnathan’s lab works with Drew, a civil and environmental engineer who loves biking and hiking. Drew and his lab at Smith College are interested in the relationship between land use and water. Together, Jonathan and Drew’s labs teamed up to study how future increases in impervious surfaces from new development could affect water quality in New England. 

A team of scientists decided to use the web-tool to study the Merrimack River. The Merrimack is an important river for New England, and serves as a water source for more than 500,000 people in the region. It begins in New Hampshire, and flows through 117 miles of forests, farmland, and cities before emptying into the Atlantic Ocean.

To study the Merrimack, the scientists used their web-tool and data from two nearby similar watersheds to make predictions for the Merrimack. Combining research like this gives scientists, government organizations, and the public valuable information that can be used to help make decisions about how land should be used in the future.

Jonathan’s lab used their future land use predictions to estimate the percentage of impervious surface area in the Merrimack River watershed for three future scenarios in the year 2060. 

  1. Recent Trends: This scenario takes the historical rates and patterns of land use change from 1990-2010 and projects them through 2060.  This scenario imagines a future where we maintain current land use practices.
  2. Low Development: This scenario explores a future where the people of New England shift toward a lifestyle focused on “living local” and valuing reliance on local resources. This increases the urgency to protect local landscapes, including conservation of green spaces.  Rates of development are slightly lower than the Recent Trends scenario.
  3. High Development: This scenario explores a future with a rapid increase in human population in New England, because climate change has made life in many other places more difficult.  Rates of development are much higher than the Recent Trends scenario.

Drew’s team collected data from two watersheds adjacent to the Merrimack river (see map) and calculated the annual maximum daily flow, or the highest level that the river in each watershed would be expected to reach each day. Higher flows likely mean more human waste and toxic materials are getting into the river. These watersheds are similar to the Merrimack in some ways, but different in others. It is up to you to justify which watershed you think is most similar, and use the annual maximum daily flow data from that watershed to make your prediction for the Merrimack.

Featured scientists: Jonathan Thompson from Harvard University and Drew Guswa from Smith College. Written by Tara Goodhue and Joshua Plisinski. Supporting content by Amanda Suzzi.

Flesch–Kincaid Reading Grade Level = 11.3

Additional teacher resource related to this Data Nugget:

Spiders under the influence

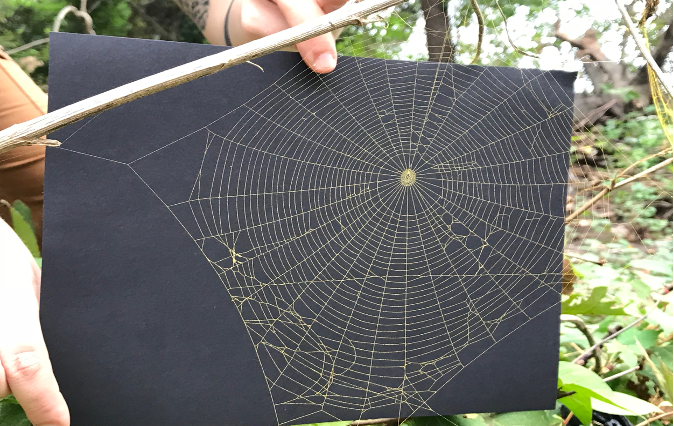
Field picture of an urban web. Dark paper is used to make the web more visible for data collection

The activities are as follows:

People use pharmaceutical drugs, personal care products, and other chemicals on a daily basis. For example, we take medicine when we are sick to feel better, and use perfumes and cologne to make ourselves smell good. After we use these chemicals, where do they go? Often, they get washed down our drains and end up in local waterways. Even our trash can contain these harmful chemicals. For example, when coffee grounds are thrown into the trash, caffeine gets washed into our waterways.

Animals in waterways, like insects, live with these chemicals every day. Many insects are born and grow in the water, absorbing the drugs over their lifetime. As predators eat the insects, the chemicals are passed on, working their way through the food web. For example, spiders living along riverbanks feed off aquatic insects and absorb the drugs from their prey.

Just as chemicals change human behavior, they change spider behavior as well! Effects of drugs on spiders have been studied since the 1940s. Dr. Peter Witt first discovered that chemicals change spider web construction. Peter gave caffeine, and a few other drugs, to spiders to see if they would build their webs during the day instead of at night, which is when they usually work. After giving his test spiders some of the drugs, the spiders still created their webs at night. However, he noticed something unexpected – the web structure of spiders on drugs was completely different from normal webs. The webs were different sizes and had more spacing between each thread. Normal webs help spiders to easily catch prey. Irregularly shaped webs were not good at catching prey because insects could fly right through the large spaces. After his study, Peter knew that drugs were bad for spiders.

Chris (they/them), a current resident of Baltimore and a spider enthusiast, lives in a watershed that is affected by chemical pollution. They wanted to build on Peter’s research by looking at spider webs in the wild instead of in the lab. Chris knew that many types of spiders live near streams and are exposed to toxins through the prey they eat. Chris wanted to compare the effects of the chemicals on spiders in rural and urban environments. By comparing spider webs in these two habitats, they could see how changed the webs are and infer how many chemicals are in the waterways.

Chris worked with Aaron, a local high school teacher, to do this research. They collected images of spiderwebs in areas around Baltimore. They chose two sites: Baisman Run, a rural site far from the city, and Gwynns Run, an urban site close to the city. Chris traveled to the sites and took pictures of eight spiderwebs at each location. Chris and Aaron expected that urban streams would have higher concentrations of chemicals than rural areas because more people live in cities.

When they got back to the lab, Aaron took the pictures and used a computer program to count the number of cells and calculate the total area of each web. These data offer a glimpse into whether spiders near Baltimore are exposed to harmful pharmaceutical chemicals and personal care products. If spiders are exposed to these chemicals, the webs will have fewer, but larger cells than a normal web. The cells will also have irregular shapes.

Featured scientists: Chris Hawn from University of Maryland Baltimore County and Aaron Curry from Baltimore Ecosystem Study LTER

Flesch–Kincaid Reading Grade Level = 7.8

Additional teacher resources related to this Data Nugget include:

  • You can watch Aaron describe his Research Experience for Teachers project here.


City parks: wildlife islands in a sea of cement

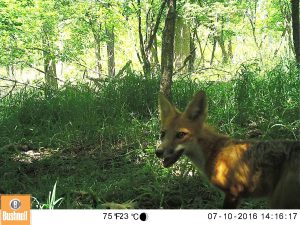
Image of a red fox caught on one of the wildlife cameras.

The activities are as follows:

For most of our existence, humans have lived in rural, natural places. However, more and more people continue to move into cities and urban areas. The year 2008 marked the first time ever in human history that the majority of people on the planet lived in cities. The movement of humans from rural areas to cities has two important effects. First, the demand that people place on the environment is becoming very intense in certain spots. Second, for many people, the city is becoming the main place where they experience nature and interact with wildlife on a regular basis.

Remington and Grant are city-dwellers and have been their entire lives. Remington grew up in Tulsa, Oklahoma and Grant is from Cleveland, Ohio. In Tulsa, Remington fell in love with nature while running on the trails of city parks during cross country and track practices. Grant developed a love for nature while fishing and hiking in the Cleveland Metroparks in Ohio. These experiences led them to study wildlife found in urban environments because they believe that cities can be places where both humans and wildlife thrive. However, to make this belief a reality, scientists must understand how wildlife are using habitats within a city. This knowledge will provide land managers the information they need to create park systems that support all types of species. However, almost all research done on wildlife takes place in natural areas, like national parks, so there is currently very little known about wildlife habits in urban areas. To address this gap in knowledge, Remington, Grant, and their colleagues conduct ecological research on the urban wildlife populations in the Cleveland Metroparks.

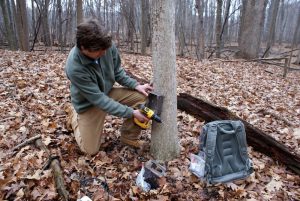
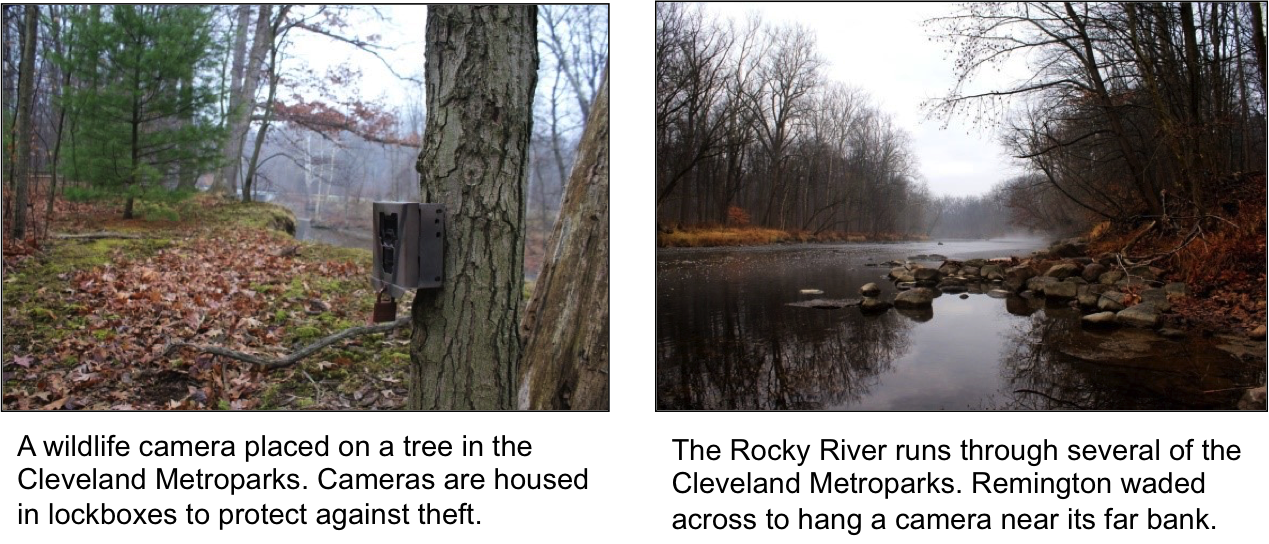
Remington prepares to attach the camera to a buckeye tree. He secures them with a heavy-duty lock to keep the cameras safe from theft by people using the parks.

The Cleveland Metroparks are a collection of wooded areas that range in size, usage, and maintenance. Some are highly used small parks with mowed grass, while others are large, rural parks with thousands of acres of forest and miles of winding trails. As they began studying the Metroparks, they noticed the parks were like little “islands” of wildlife habitat within a large “sea” of buildings, pavement, houses and people. This reminded Remington and Grant of a fundamental theory in ecology: the theory of island biogeography. This theory has two components: size and isolation of islands. The first predicts that larger islands will have higher biodiversity because there are more resources and space to support more wildlife than smaller areas. The second is that islands farther away from the mainland will have lower biodiversity because more isolated islands are harder for wildlife to reach. Remington and Grant wondered if they could address this first component in the wide variety of areas that are part of the Cleveland Metroparks. If the theory holds for the Metroparks, it could help them to figure out where most species live in the park system and help managers better maximize biodiversity. It would also provide an important link between ecological research conducted in natural areas and urban ecology.

To evaluate whether the theory of island biogeography holds true in urban areas, Remington and Grant set up 104 wildlife cameras throughout the parks. These cameras photograph animals when triggered by motion. They used these photographs to identify the locations of wildlife in the parks and to get a count of how many individuals there are, known as their abundance. With these data, they tested whether the size of the park would influence biodiversity as predicted by the theory of island biogeography.

One challenge with measuring “biodiversity” is that it means different things to different people. Remington and Grant looked at two common measurements of biodiversity. First, species richness, which is the number of different species observed in each park. Second, they calculated the Shannon Wiener Index of biodiversity for each park. This index incorporates both species richness and species evenness. Species evenness tells us whether the abundances of each species are similar, or if one type is most common and the others are rare. Evenness is important because it tells you whether a park has lots of animals from many different species or if most animals are from a single species. If a park has greater evenness of species, the Shannon-Wiener index will be higher.

Featured scientists: Remington Moll and Grant Woodard from Michigan State University

Flesch–Kincaid Reading Grade Level = 11.4

Additional teacher resource related to this Data Nugget:

  • Remington and Grant have made their data available for use in classrooms. If you would like to have your students work with raw data, it can be used to calculate the Shannon Wiener Index, or explore other aspects of species richness and evenness in the parks. This data is not yet published, so keep in mind this data is intended only for classroom use. Download the Excel file here!
  • PowerPoint slideshow of images from the wildlife cameras in the Cleveland Metroparks.
  • Citizen science Zooniverse site where students can view data and identify species from Remington and Grant’s cameras.
  • For more background on the importance of biodiversity, students can eat this article in The Guardian – What is biodiversity and why does it matter to us?

Remington, and other members of his lab, have written blog posts about this research. These readings would be appropriate for a middle or high school reading level and would give students more context for the researchSaveSave

SaveSave

SaveSave

SaveSave

SaveSave

SaveSave

SaveSave

SaveSave

SaveSave

SaveSave

SaveSave


About Remington: Remington is a Ph.D. student and NSF Graduate Research Fellow at Michigan State University in Dr. Bob Montgomery’s lab. Prior to Michigan State, Remington received B.S. and M.S. degrees from the University of Missouri, where he worked with Dr. Josh Millspaugh. Following his M.S., he spent time in Amman, Jordan doing work with the Royal Society for the Conservation of Nature and spent three years teaching high school biology, chemistry, and theology at the Beirut Baptist School in Lebanon.

He uses cutting-edge technologies such as GPS collars and camera-traps to study predator-prey interactions between large carnivores and their prey. He is particularly excited about evaluating how ecological theory developed in “natural” areas like national parks applies to urban contexts. Remington grew up in the city and fell in love with nature and ecology in city parks. Although it carries substantial challenges, Remington believes that humans and large predators can peaceably coexist, even in and around cities. It is his goal to use the lessons learned in his research to help make that belief a reality.

SaveSave

SaveSave

Deadly windows

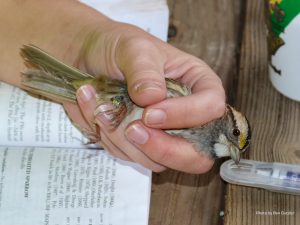
A white-throated sparrow caught during the experiment. You can see the band on it’s leg, used to make sure they did not record the same bird more than once.

The activities are as follows:

Glass makes for a great windowpane because you can see right through it. However, the fact that windows are see-through makes them very dangerous for birds. Have you ever accidentally run into a glass door or been confused by a tall mirror in a restaurant? Just like people, birds can mistake a see-through window or a mirrored pane for an opening to fly through or a place to get food and will accidentally fly into them. These window collisions can hurt the bird or even kill it. Window collisions kill nearly one billion birds every year!

Urban areas, with a lot of houses and stores, have a lot of windows. Resident birds that live in the area may get to know these buildings well and may learn to avoid the windows. However, not all the birds in an area live there year-round. There are also migrant birds that fly through urban areas during their seasonal migrations. In the fall, for example, migrant birds use gardens and parks in urban areas to rest along their journeys to their winter southern homes. During the fall migration, people have noticed that it seems like more birds fly into windows. This may be because migrant birds, especially the ones born that summer, are not familiar with the local buildings. While looking for food and places to sleep, migrant birds might have more trouble identifying windows and fly into them more often. However, it could also be that there are simply more window collisions in the fall because there are more birds in the area when migrant and resident birds co-occur in urban areas.

Researchers identify the species of each bird caught in one of the nets used in the study. They then place a metal bracelet on one leg so they will know if they catch the same bird again.

Natasha was visiting a friend who worked at a zoo when he told her about a problem they were having. For a few weeks in the fall, they would find dead birds under the windows, more than they would during the rest of the year. He wanted to figure out a way to prevent birds from hitting the exhibit windows. Natasha became interested in learning whether migrant birds were more likely to fly into windows than resident birds or if the number of window collisions only increase in the fall because there are a lot of birds around. To do this she would have to count the total number of birds in the area and also the total number of birds that were killed in window collisions, as well as identify the types of birds. To count the total number of birds in the area, Natasha hung nets that were about the same height as windows. When the birds got caught in the nets, Natasha could count and identify them. These data could then be used to calculate the proportion of migrants and residents flying at window-height. She put 10 nets up once a week for four hours, over the course of three months, and checked them every 15 minutes for any birds that got caught.

Researcher identifying a yellow-rumped warbler, one of the birds captured in the net as part of the study.

Then, she also checked under the windows in the same area to see what birds were killed from window collisions. She checked the windows every morning and evening for the three months of the study. Different species of birds are migratory or resident in the area where Natasha did her study. Each bird caught in nets was examined to identify its to species using its feathers, which would tell her whether the bird was a migrant or a resident. The same was done for birds found dead below windows.

If window collisions are really more dangerous for migrants, she predicted that a higher proportion of migrants would fly into windows than were caught in the nets. But, if window collisions were in the same proportion as the birds caught in the nets, she would have evidence that windows were just as dangerous for resident birds as for migrants.

Featured scientist: Natasha Hagemeyer from Old Dominion University

Flesch–Kincaid Reading Grade Level = 8.7

There is one scientific paper associated with the data in this Data Nugget. The citation and PDF of the paper is below:

To engage students with the lesson before they begin, or after the lesson to help them develop their own independent questions for the system, you can share the following videos:

SaveSave

SaveSave

SaveSave

SaveSave

SaveSave

SaveSave

SaveSave

SaveSave

SaveSave

SaveSave

SaveSave

Lizards, iguanas, and snakes! Oh my!

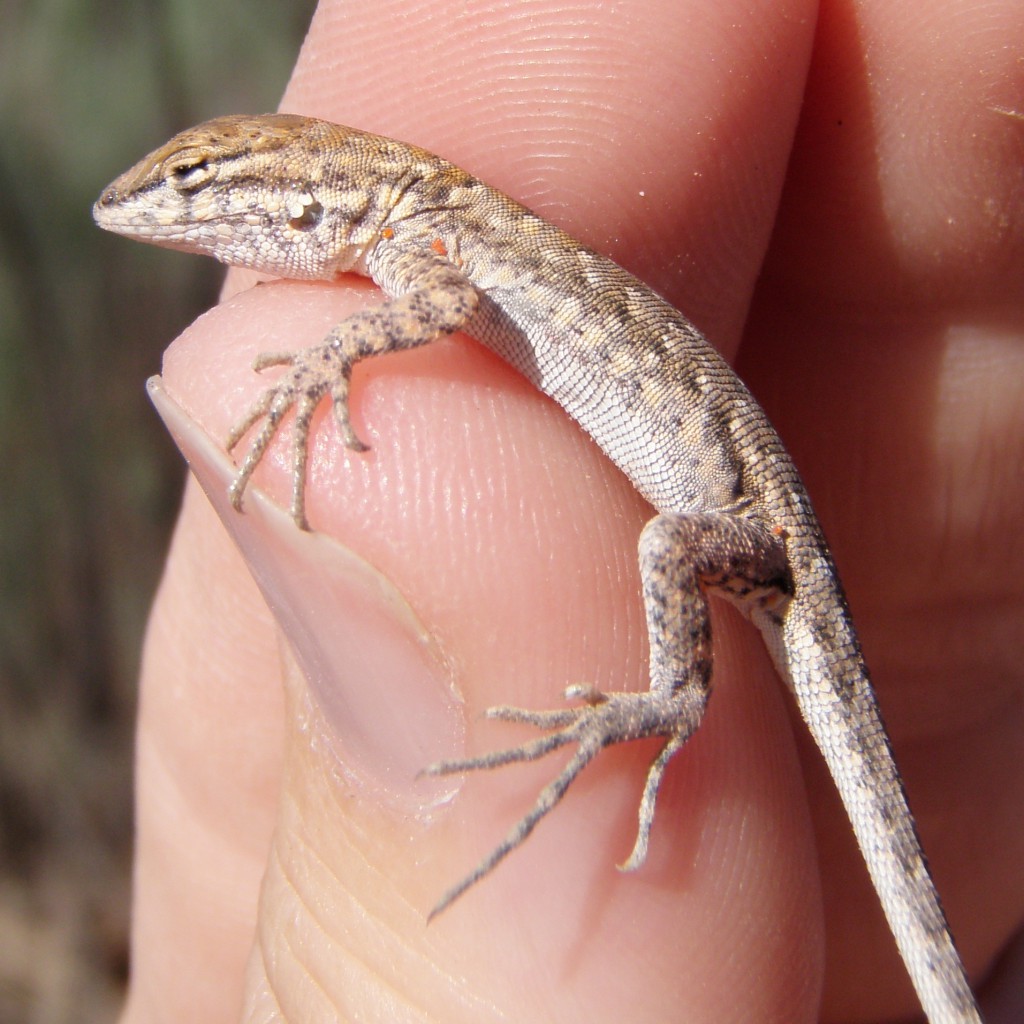
The Common Side-blotched Lizard

The Common Side-blotched Lizard

The activities are as follows:

Throughout history people have settled mainly along rivers and streams. Easy access to water provides resources to support many people living in one area. In the United States today, people have settled along 70% of rivers.

Today, rivers are very different from what they were like before people settled near them. The land surrounding these rivers, called riparian habitats, has been transformed into land for farming, businesses, or housing for people. This urbanization has caused the loss of green spaces that provide valuable services, such as water filtration, species diversity, and a connection to nature for people living in cities. Today, people are trying to restore green spaces along the river to bring back these services. Restoration of disturbed riparian habitats will hopefully bring back native species and all the other benefits these habitats provide.

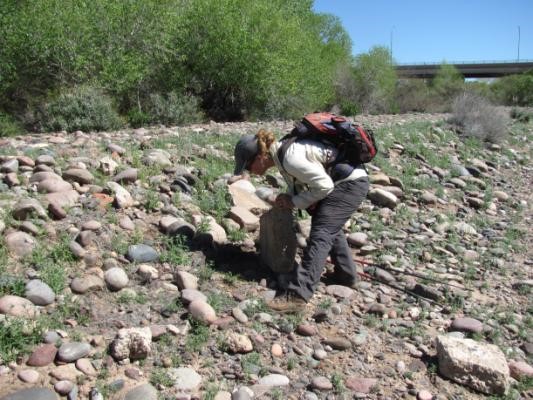
Scientist Mélanie searching for reptiles in the Central Arizona-Phoenix LTER.

Scientist Mélanie searching for reptiles in the Central Arizona-Phoenix LTER.

Scientists Heather and Mélanie are researchers with the Central Arizona-Phoenix Long-Term Ecological Research (CAP LTER) project. They want to know how restoration will affect animals living near rivers. They are particularly interested in reptiles, such as lizards. Reptiles play important roles in riparian habitats. Reptiles help energy flow and nutrient cycling. This means that if reptiles live in restored riparian habitats, they could increase the long-term health of those habitats. Reptiles can also offer clues about the condition of an ecosystem. Areas where reptiles are found are usually in better condition than areas where reptiles do not live.

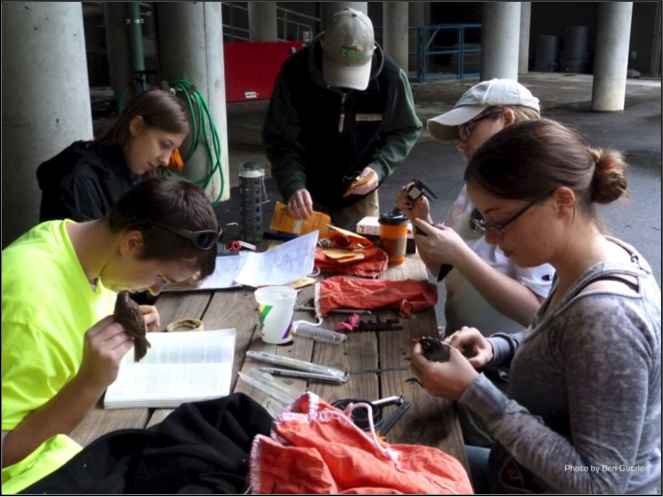
Heather and Mélanie wanted to look at how disturbances in riparian habitats affected reptiles. They wanted to know if reptile abundance (number of individuals) and diversity (number of species) would be different in areas that were more developed. Some reptile species may be sensitive to urbanization, but if these habitats are restored their diversity and abundance might increase or return to pre-urbanization levels. The scientists collected data along the Salt River in Arizona. They had three sites: 1) a non-urban site, 2) an urban disturbed site, and 3) an urban rehabilitated site. They counted reptiles that they saw during a survey. At each site, they searched 21 plots that were 10 meters wide and 20 meters long. The sites were located along 7 transects, or paths measured out to collect data. Transects were laid out along the riparian habitat of the stream and there were 3 plots per transect. Each plot was surveyed 5 times. They searched for animals on the ground, under rocks, and in trees and shrubs.

Featured scientists: Heather Bateman and Mélanie Banville from Arizona State University. Written by Monica Elser from Arizona State University.

Flesch–Kincaid Reading Grade Level = 9.8

Check out this video of Heather and her lab out in the field collecting lizards:

Virtual field trip to the Salt River biodiversity project:

Additional resources related to this Data Nugget:

SaveSave

SaveSave

SaveSave