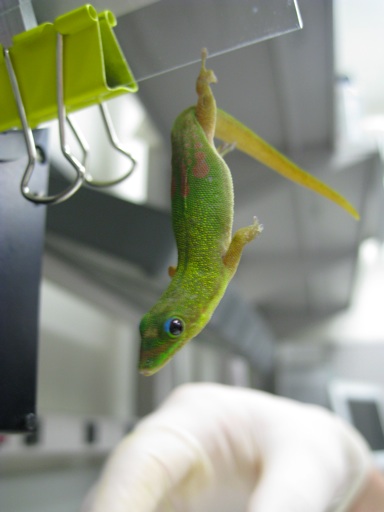
Travis in the lab measuring the stickiness of a gecko’s toe.
The activities are as follows:
Species are able to do so many amazing things, from birds soaring in the air, lizards hanging upside-down from ceilings, and trees growing hundreds of feet tall. The study of biomechanics looks at living things from an engineering point of view to study these amazing abilities and discover why species come in such a huge variety of shapes and sizes. Biomechanics can improve our understanding of how plants and animals have adapted to their environments. We can also take what we learn from biology and apply it to our own inventions in a process called biomimicry. Using this approach, scientists have built robotic jellyfish to survey the oceans, walking robots to help transport goods, and fabrics that repel stains like water rolling off a lotus leaf.
Travis studies biomechanics and is interested in the ability of some species to climb and stick to walls. Sticky, or adhesive, toe pads have evolved in many different kinds of animals, including insects, arachnids, reptiles, amphibians, and mammals. Some animals, like frogs, bats, and bugs use suction cups to hold up their weight. Others, like geckos, beetles, and spiders have toe pads covered in tiny, branched hairs. These hairs actually adhere to the wall! Electrons in the molecules that make up the hairs interact with electrons in the molecules of the surface they’re climbing on, creating a weak and temporary attraction between the hairs and the surface. These weak attractions are called van der Waals forces.
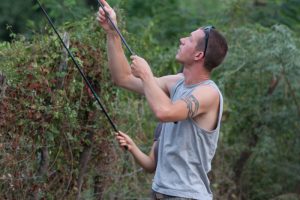
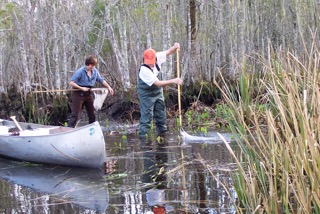
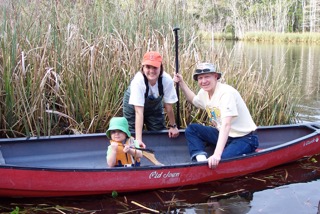
Travis catching lizards in the Dominican Republic.
The heavier the animal, the more adhesion they will need to stick and support their mass. With a larger toe surface area, more hairs can come in contact with the climbing surface, or the bigger the suction cup can be. For tiny species like mites and flies, tiny toes can do the job. Each fly toe only has to be able to support a small amount of weight. But when looking at larger animals like geckos, their increased weight means they need much larger toe pads to support them.
When comparing large and small objects, the mass of large objects grows much faster then their surface area does. As a result, larger species have to support more mass per amount of toe area and likely need to have non-proportionally larger toes than those needed by lighter species. This results in geckos having some crazy looking feet! This relationship between mass and surface area led Travis to hypothesize that larger species have evolved non-proportionally larger toe pads, which would allow them to support their weight and stick to surfaces.
To investigate this idea, Travis looked at the data published in a paper by David Labonte and fellow scientists. In their paper they measured toe pad surface area and mass of individual animals from 17 orders (225 species) including insects, arachnids, reptiles, amphibians, and mammals. From their data, Travis calculated the average toe pad area and mass for each order.
Travis then plotted each order’s mass and toe pad area on logarithmic axes so it is easier to compare very small and very large values. Unlike a standard axis where the amount represented between tick marks is always the same, on logarithmic axes each tick mark increases by 10 times the previous value. For example, if the first tick represents 1.0, the second tick will be 10, and the next 100. As an example, look at the graphs below.
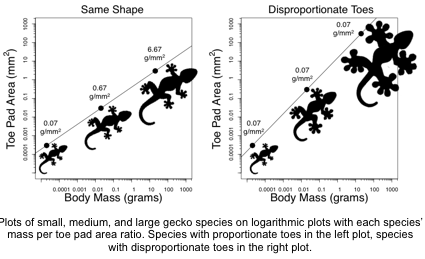
The left plot shows hypothetical gecko species of different sizes, but with proportional toes. Their mass per toe pad area ratio (g/mm2) varies, with larger species having larger g/mm2 ratios. In this case, larger species have to support more mass per toe pad area. In the right plot, larger gecko species have disproportionally larger toes. These differences change each species’ mass per toe pad area ratios, so that all species, regardless of their size, have the same mass per toe pad area ratio.
Featured scientists: David Labonte, Christofer J. Clemente, Alex Dittrich, Chi-Yun Kuo, Alfred J. Crosby, Duncan J. Irschick, and Walter Federle. Written by: Travis Hagey
Data Nugget Flesch–Kincaid Reading Grade Level = 10.3
Scaling Up – Math Activity Flesch–Kincaid Reading Grade Level = 9.5
There is a scientific paper associated with the data in this Data Nugget. The data was used with permission from D. Labonte.
Labonte, D., Clemente, C.J., Dittrich, A., Kuo, C.Y., Crosby, A.J., Irschick, D.J. and Federle, W., 2016. Extreme positive allometry of animal adhesive pads and the size limits of adhesion-based climbing. Proceedings of the National Academy of Sciences, p.201519459.
To learn more about Travis and his research on geckos, read this blog post, “An evolving sticky situation” and check out the video below!
For a video and article on using “gecko power” to scale a building, check out this article – Climbing a Glass Building? Try a Gecko’s Sticky Pads
 About Travis: Ever since Travis was a kid, he was interested in animals and wanted to be a paleontologist. He even had many dinosaur names memorized to back it up! In college he discovered evolutionary biology, which drove him to apply for graduate school and become a scientist. There, he fell in love with comparative biomechanics, which combines evolutionary biology and mechanical engineering. Today Travis studies geckos and their sticky toes that allow them to scale surfaces like glass windows and tree branches.
 About Kristine: Kristine L. Grayson is an Associate Professor in the Biology Department at University of Richmond, where she teaches Intro Ecology/Evolution, Field Ecology, Ecophysiology, and
 About Carrie: I have been interested in animal behavior and behavioral ecology since my second year in college at the University of Tennessee. I am primarily interested in how variation in ecology and environment affect communication and signaling in birds. I have also studied various types of memory and am interested in how animals learn and use information depending on how their environment varies over space and time. I am currently working on my PhD in Ecology, Evolution, and Conservation Biology at the University of Nevada Reno and once I finish I hope to become a professor at a university so that I can continue to conduct research and teach students about animal behavior. In my spare time I love hiking with my friends and dogs, and watching comedies!

