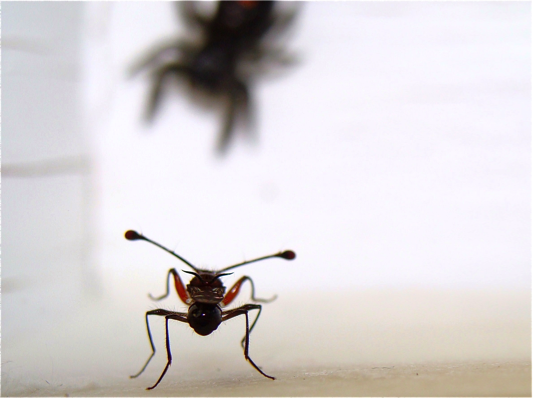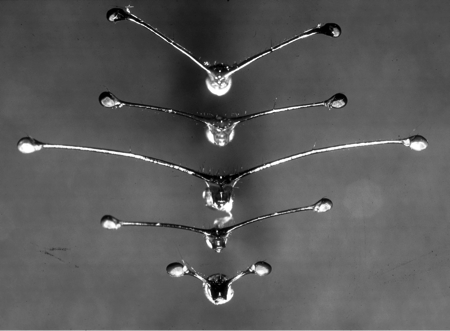
Variation between stalk-eyed fly species in eyestalk length.
The activities are as follows:
Stalk-eyed flies are insects with eyes located on the ends of long projections on the sides of their head, called eyestalks. Male stalk-eyed flies have longer eyestalks than females, and this plays an important role in the flies’ mating patterns. Female stalk-eyed flies prefer to mate with males with longer eyestalks. In this way, the eyestalks are much like the bright and colorful peacock’s tail. This kind of sexual selection can lead to the evolution of longer and longer eyestalks over generations. But do these long eyestalks come at a cost? For example, longer eyestalks could make it more difficult to turn quickly when flying. As with all flies, stalk-eyed flies do not fly in a straight line all the time, and often zigzag in air. If long eyestalks make quick turns more difficult, we might expect there to be a trade-off between attracting mates and flight.
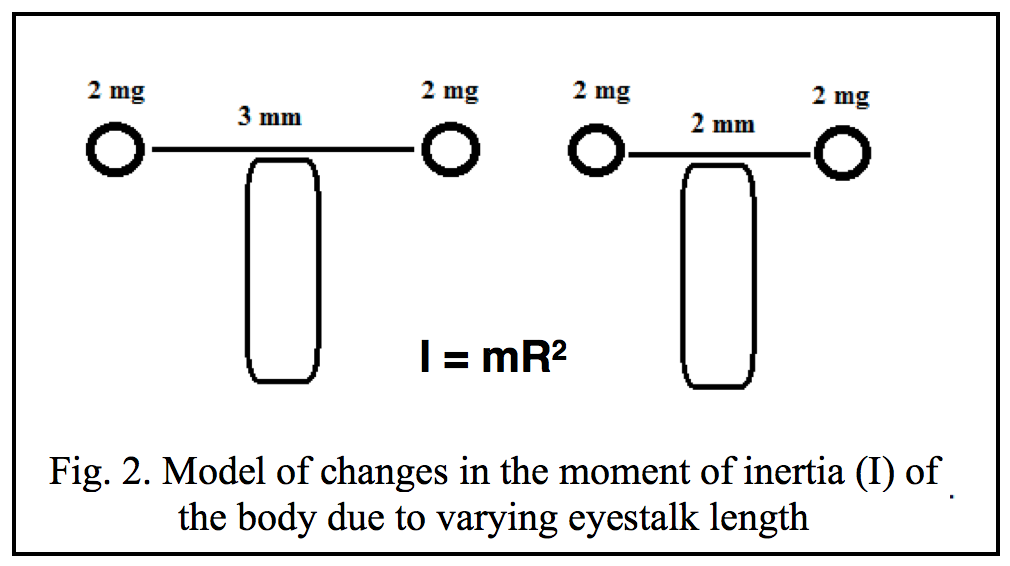 Moment of inertia (I) is defined as an object’s tendency to resist rotation – in other words how difficult it is to make something turn. An object is more difficult to turn (has a higher moment of inertia) when it is more massive, and when it is further from its axis of rotation. Imagine trying to swing around quickly holding a gallon of water – this is difficult because the water has a lot of mass. Now imagine trying to swing around holding a baseball bat with a jug of water attached to the end. This will be even more difficult, because the mass is further away from the axis of rotation (your body). Now lets bring that back to the stalk-eyed fly. The baseball bat now represents the eyestalk of the fly, while the gallon of water represents the eye at the end of the stalk. We can express the relationship between the mass of the object (m = mass of the eye), its distance from the axis of rotation (R = length of eyestalk), and the moment of inertia (I) using the following equation: I = mR2.
Because moment of inertia goes up with the square of the distance from the axis, we might expect that as the length of the flies’ eyestalks goes up, the harder and harder it will be for the fly to maneuver during flight. If this is the case, we would predict that male stalk-eyed flies would make slower turns compared to similar sized female flies with shorter eyestalks.
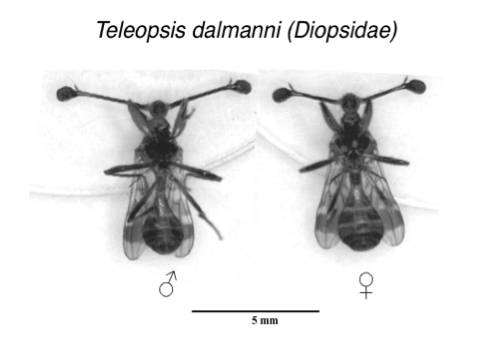
Differences in male and female eyestalk length.
To address this idea, scientists measured the effect of eyestalk length on the moment of inertia of the body needs. In addition, they measured differences in turning performance during flight. Scientists Gal and John tracked free flight trajectories of female and male stalk-eyed flies in a large flight chamber. Because female and male stalk-eyed flies have large differences in eyestalk length, their flight performance can be compared to determine the effects of eyestalk length on flight. However, other traits may differ between males and females, so body size and wing length measurements were also taken. If increased moment of inertia does limit turning performance as expected, the male flies that have significantly longer eyestalks should demonstrate slower and less tight turns, indicating a decrease in free flight performance. If there is no difference in turning performance between males and females with significantly different eyestalk lengths, then males must have a way to compensate for the higher moment of inertia.
Featured scientists: Gal Ribak from Tel-Aviv University, Israel and John Swallow from University of Colorado, Denver. Written by: Brooke Ravanelli from Denver Public School, Zoё Buck Bracey from BSCS, and John Swallow.
Flesch–Kincaid Reading Grade Level = 9.0
Once your students have completed this Data Nugget, there is an extension lab activity where students can conduct their own experiment testing moment of inertia. Students simulate the flying experience of stalk-eyed flies and go through an obstacle course carrying their eyestalks with them as they maneuver through the cones to the finish line. To access this lab, click here!
Video showing how the long eyestalks of males form!