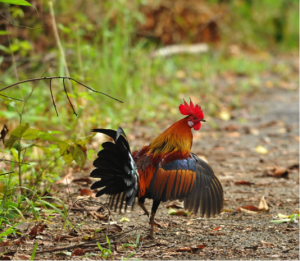
Red Junglefowl are the same species as chickens (Gallus gallus). On Kauai island, they have mated with feral chickens to produce hybrids (photo by Tontantours).
The activities are as follows:
- Teacher Guide
- Student activity, Graph Type A, Level 3
- Student activity, Graph Type B, Level 3
- Student activity, Graph Type C, Level 3
- Grading Rubric
When domesticated animals that humans keep in captivity escape into the wild, we call them feral. You may have seen feral animals, such as pigeons, cats, or dogs, right in your own backyard. But did you know that there are dozens of other feral species all over the world, including goats, parrots, donkeys, wallabies, and chameleons?
Sometimes feral species interbreed with closely related wild relatives to produce hybrid offspring. Feral dogs, for example, occasionally mate with wolves to produce hybrid pups which resemble both their wolf and dog parents. Over many generations, a population made up of these wolf-dog hybrids can evolve to become more wolf-like or more dog-like. Which direction they take will depend on whether dog or wolf traits help the individual survive and reproduce in the wild. In other words, hybrids should evolve traits that are favored by natural selection.
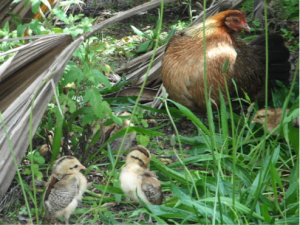
Photograph of a feral hen on Kauai, with her recently hatched chicks (photo by Pamela Willis).
You might be surprised to learn that, like dogs, chickens also have close relatives living in the wild. These birds, called Red Junglefowl, inhabit the jungles of Asia and also many Pacific islands. Eben is a biologist who studies how the island populations of these birds are evolving over time. He has discovered that Red Junglefowl on Kauai Island, which is part of Hawaii, have recently started interbreeding with feral chickens. This interbreeding has produced a hybrid population of birds that are somewhere in between red junglefowl and domestic chickens.
One of the biggest differences between chickens and Red Junglefowl is their breeding behaviors. Red Junglefowl females lay only a handful of eggs each year and only in the spring. Domestic chickens can lay eggs during any season and sometimes up to 300 or more eggs in one year! Eben wanted to know more about the breeding behaviors of Kauai’s feral populations. In many cases, natural selection favors individuals who produce more offspring during their lifetimes. Because domesticated chickens can lay eggs year-round, Eben thought that the feral population would be evolving to be more like domesticated chickens. He predicted that feral hens would breed in all seasons.
To test his hypothesis, Eben’s research group collected hundreds of photographs and videos of Kauai’s hybrid chickens. Tourists delight in photographing Kauai’s wild chickens and uploading their media to the internet. Fortunately for Eben, their cameras and cell phones often record the dates that images are taken. Eben looked at media posted on websites like Flickr and YouTube to find documentation of feral chickens throughout the year. This allowed him to see whether chicks are present during each of the four seasons. He knew that any hen observed with chicks had recently mated and hatched eggs because the chicks only stay with their mothers for only a few weeks.
Featured scientist: Eben Gering from Michigan State University
Flesch–Kincaid Reading Grade Level = 10.6
To learn more about feral chickens and Eben’s research, check out the popular science articles below:
- New York Times Article, “In Hawaii, Chickens Gone Wild”
- Nature Article, “When Chickens Go Wild”
- MSU Today, “How Did the Chicken Cross the Sea?“
- BEACON, “Feral chickens are a-changing: updates on the rapid evolution of Kauai’s hybrid Gallus gallus”
Mini documentary you can watch in class. The video gives a brief history of chickens on the island of Kauai, and shows mother hens with their chicks:
Cock a Doodle Doo from John Goheen on Vimeo.
Students can watch the same videos that Eben used to collect his experimental data. They can find these videos by searching YouTube for “feral chickens Kauai” and many examples will come up, like this video:

About Eben: One of the most exciting things I learned as a college student was that natural populations sometimes evolve very quickly. Biologists used to think evolution was too slow to be studied “in action”, so their research focused on evolutionary changes that occurred over thousands (or even millions) of years. I study feral animal populations to learn how rapid evolutionary changes help them survive and reproduce, without direct help from us.


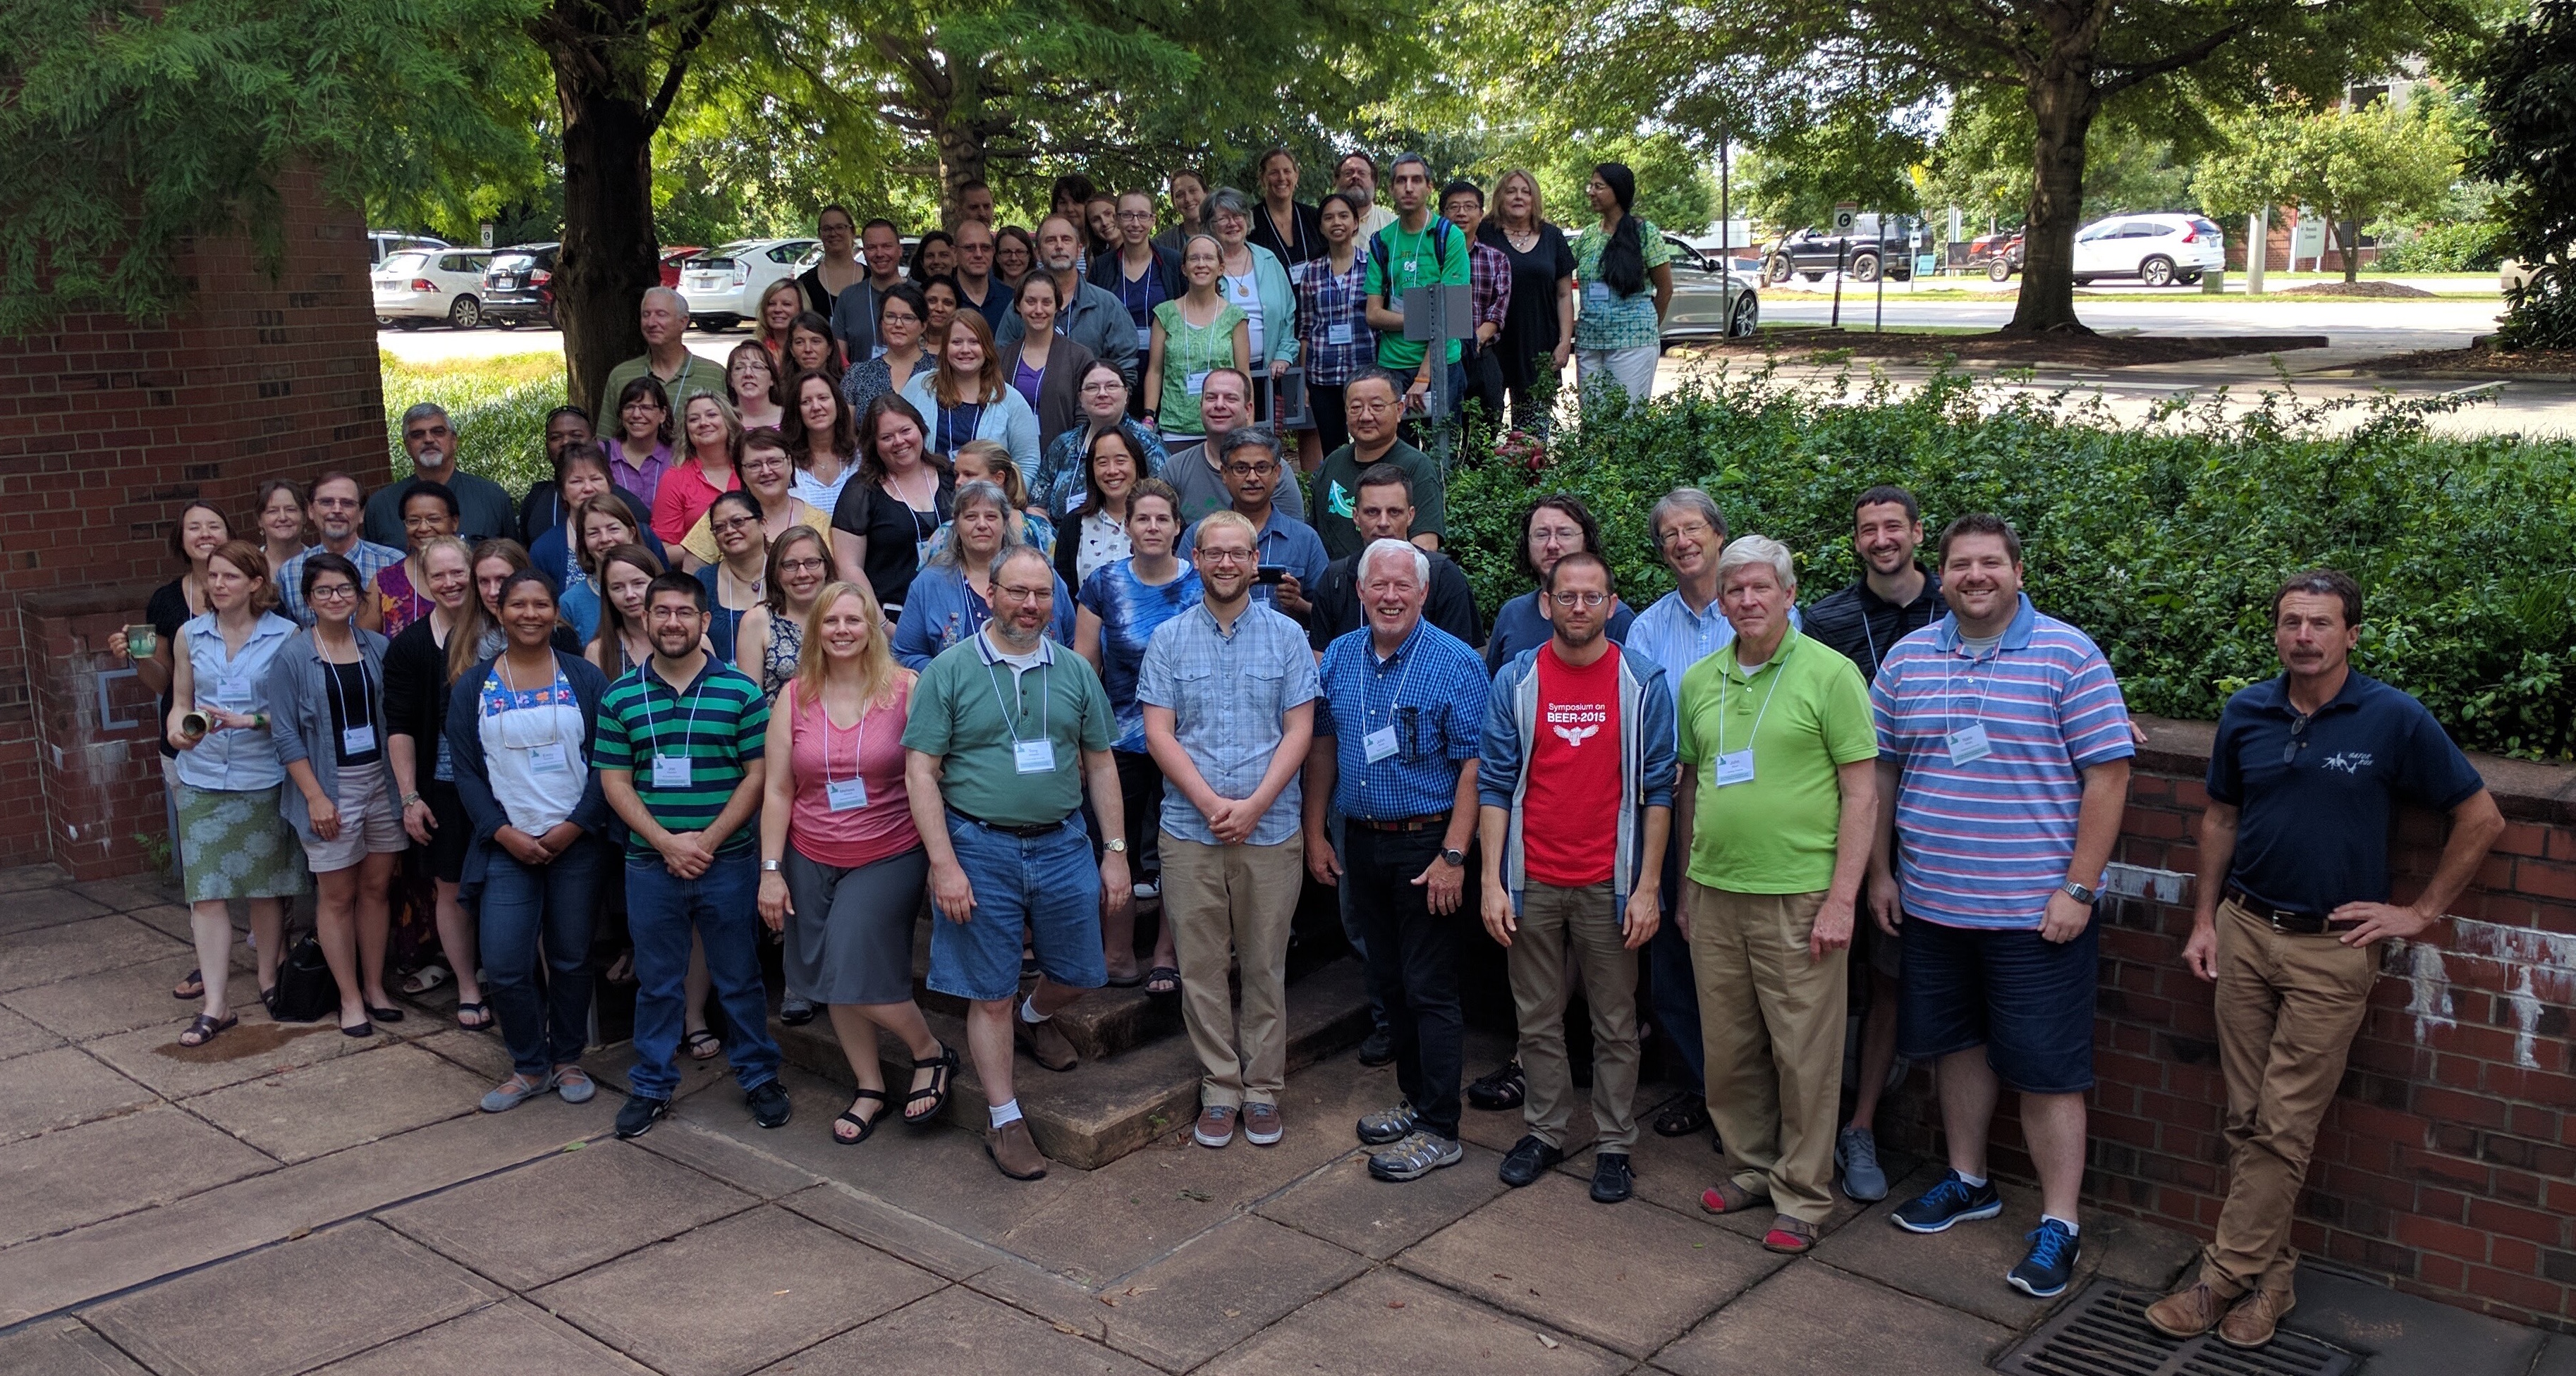
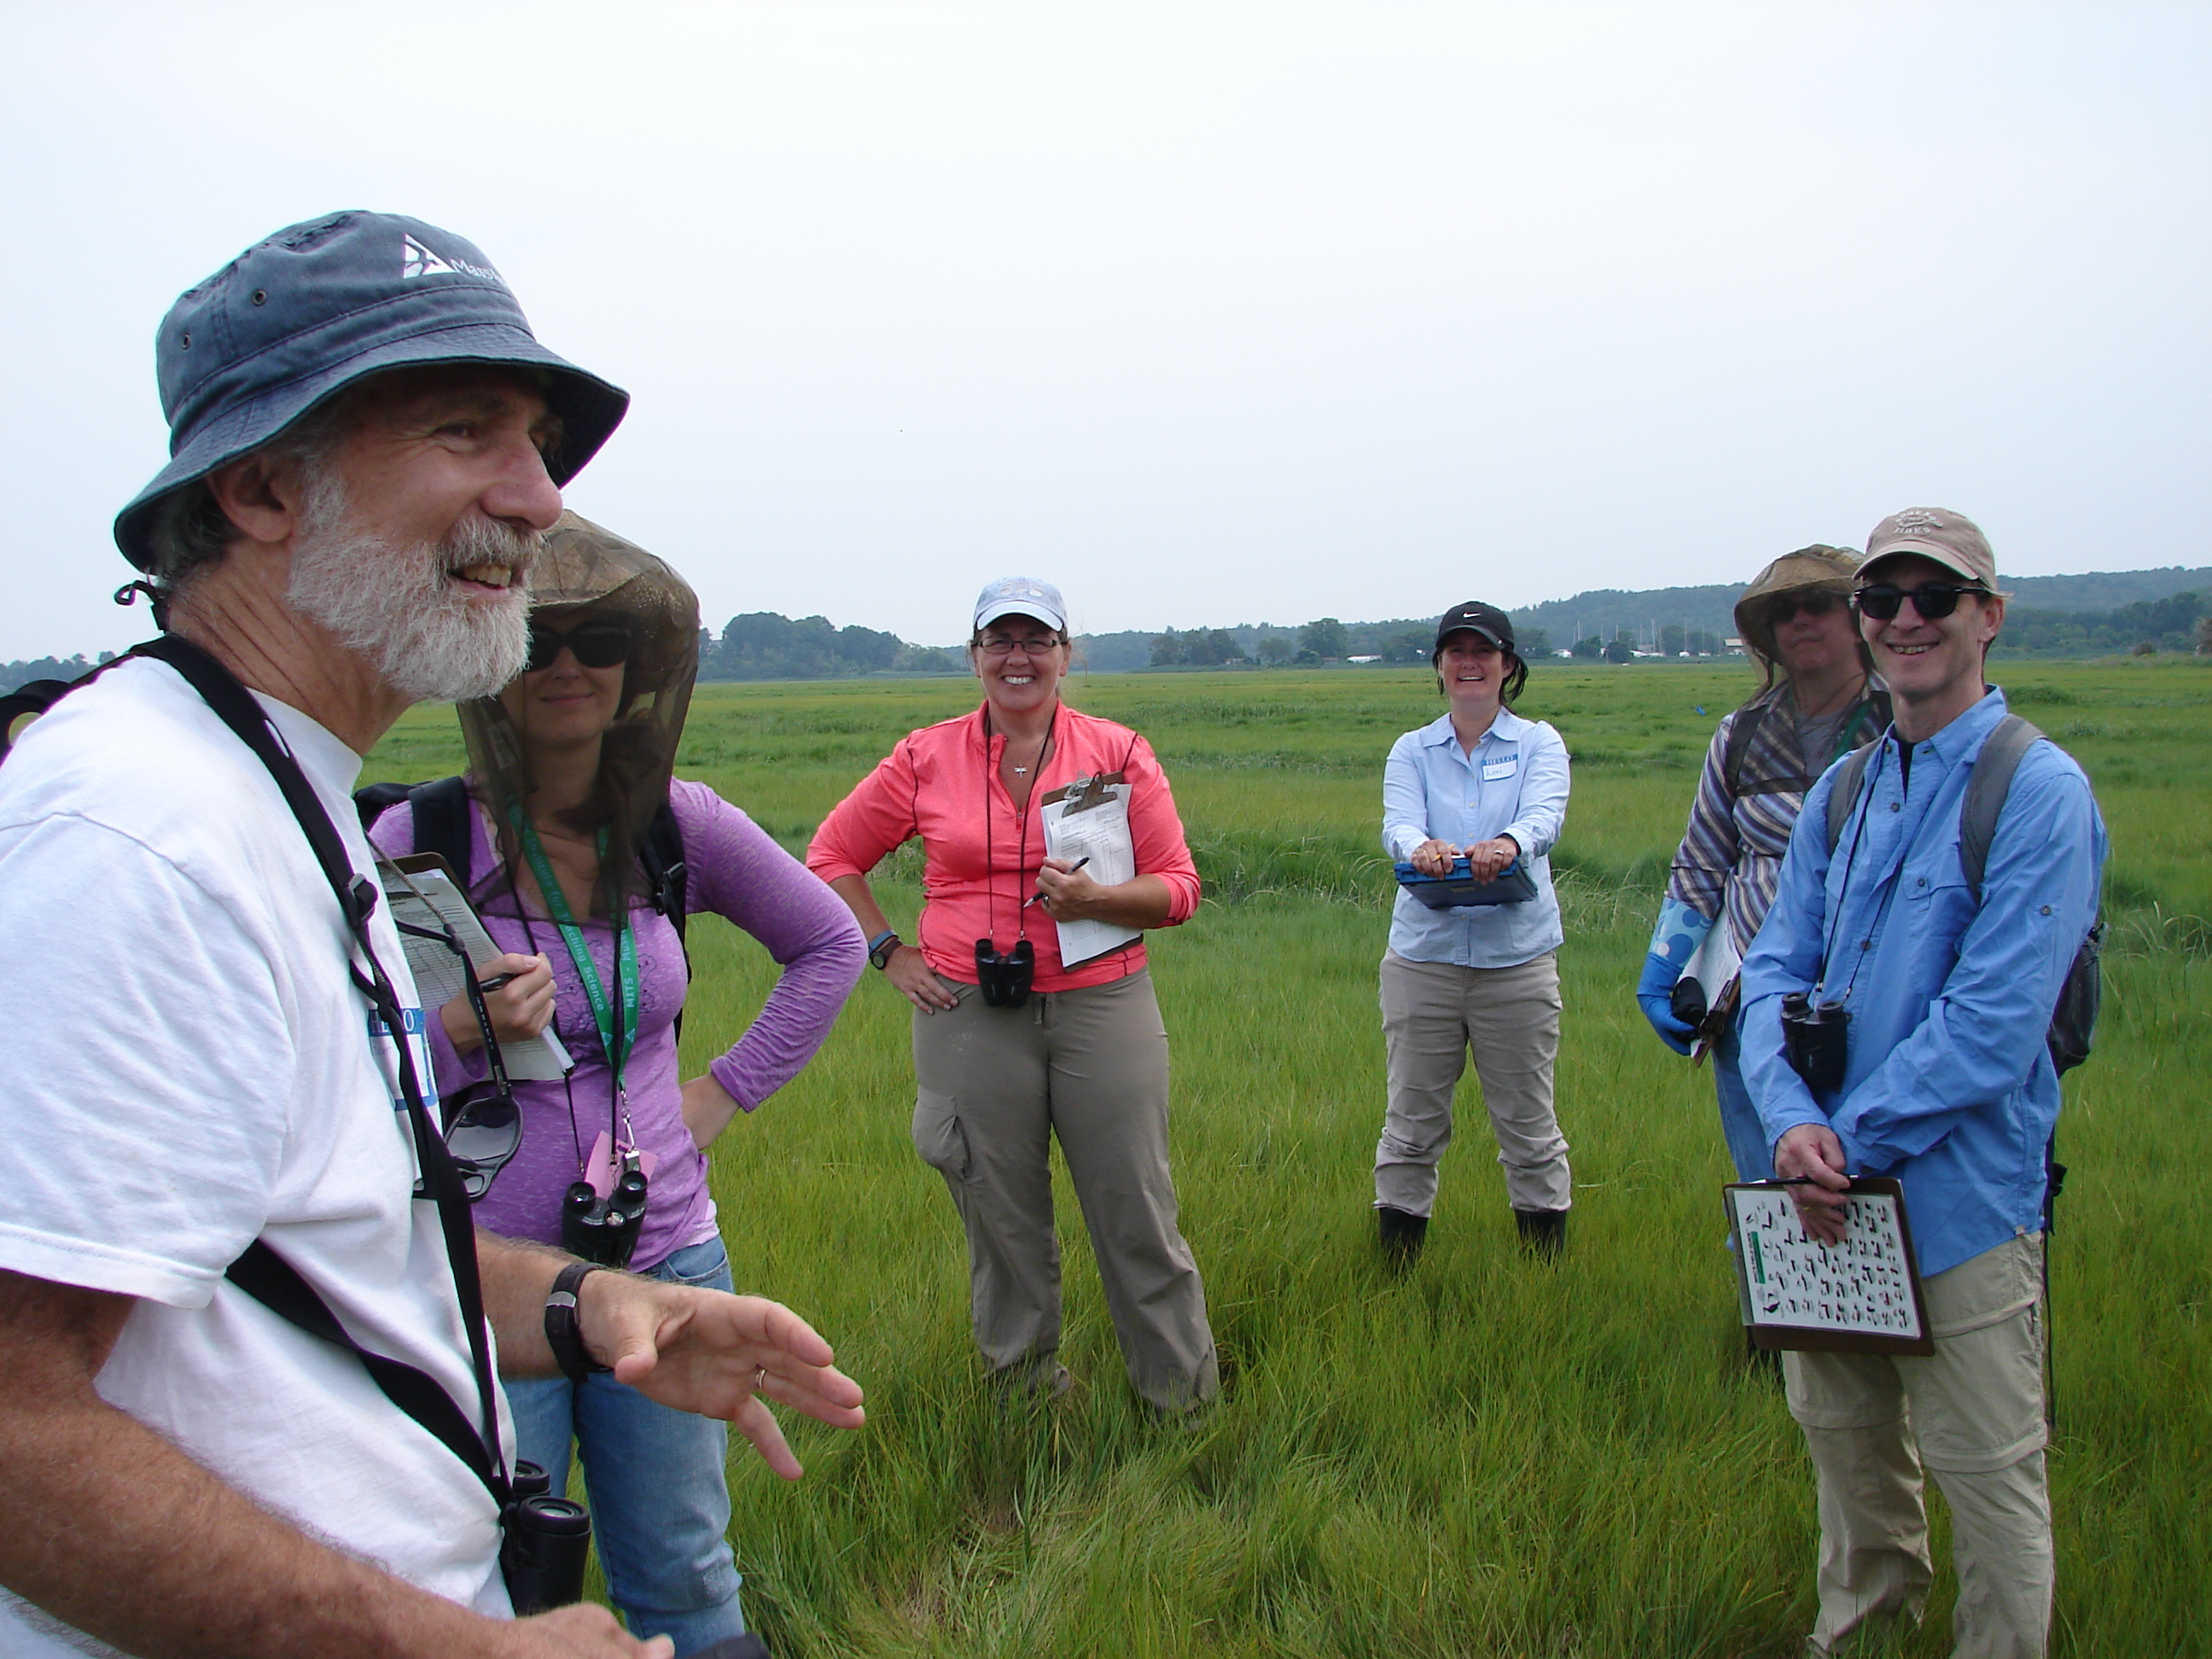
 All the participants at the