More than a token photo

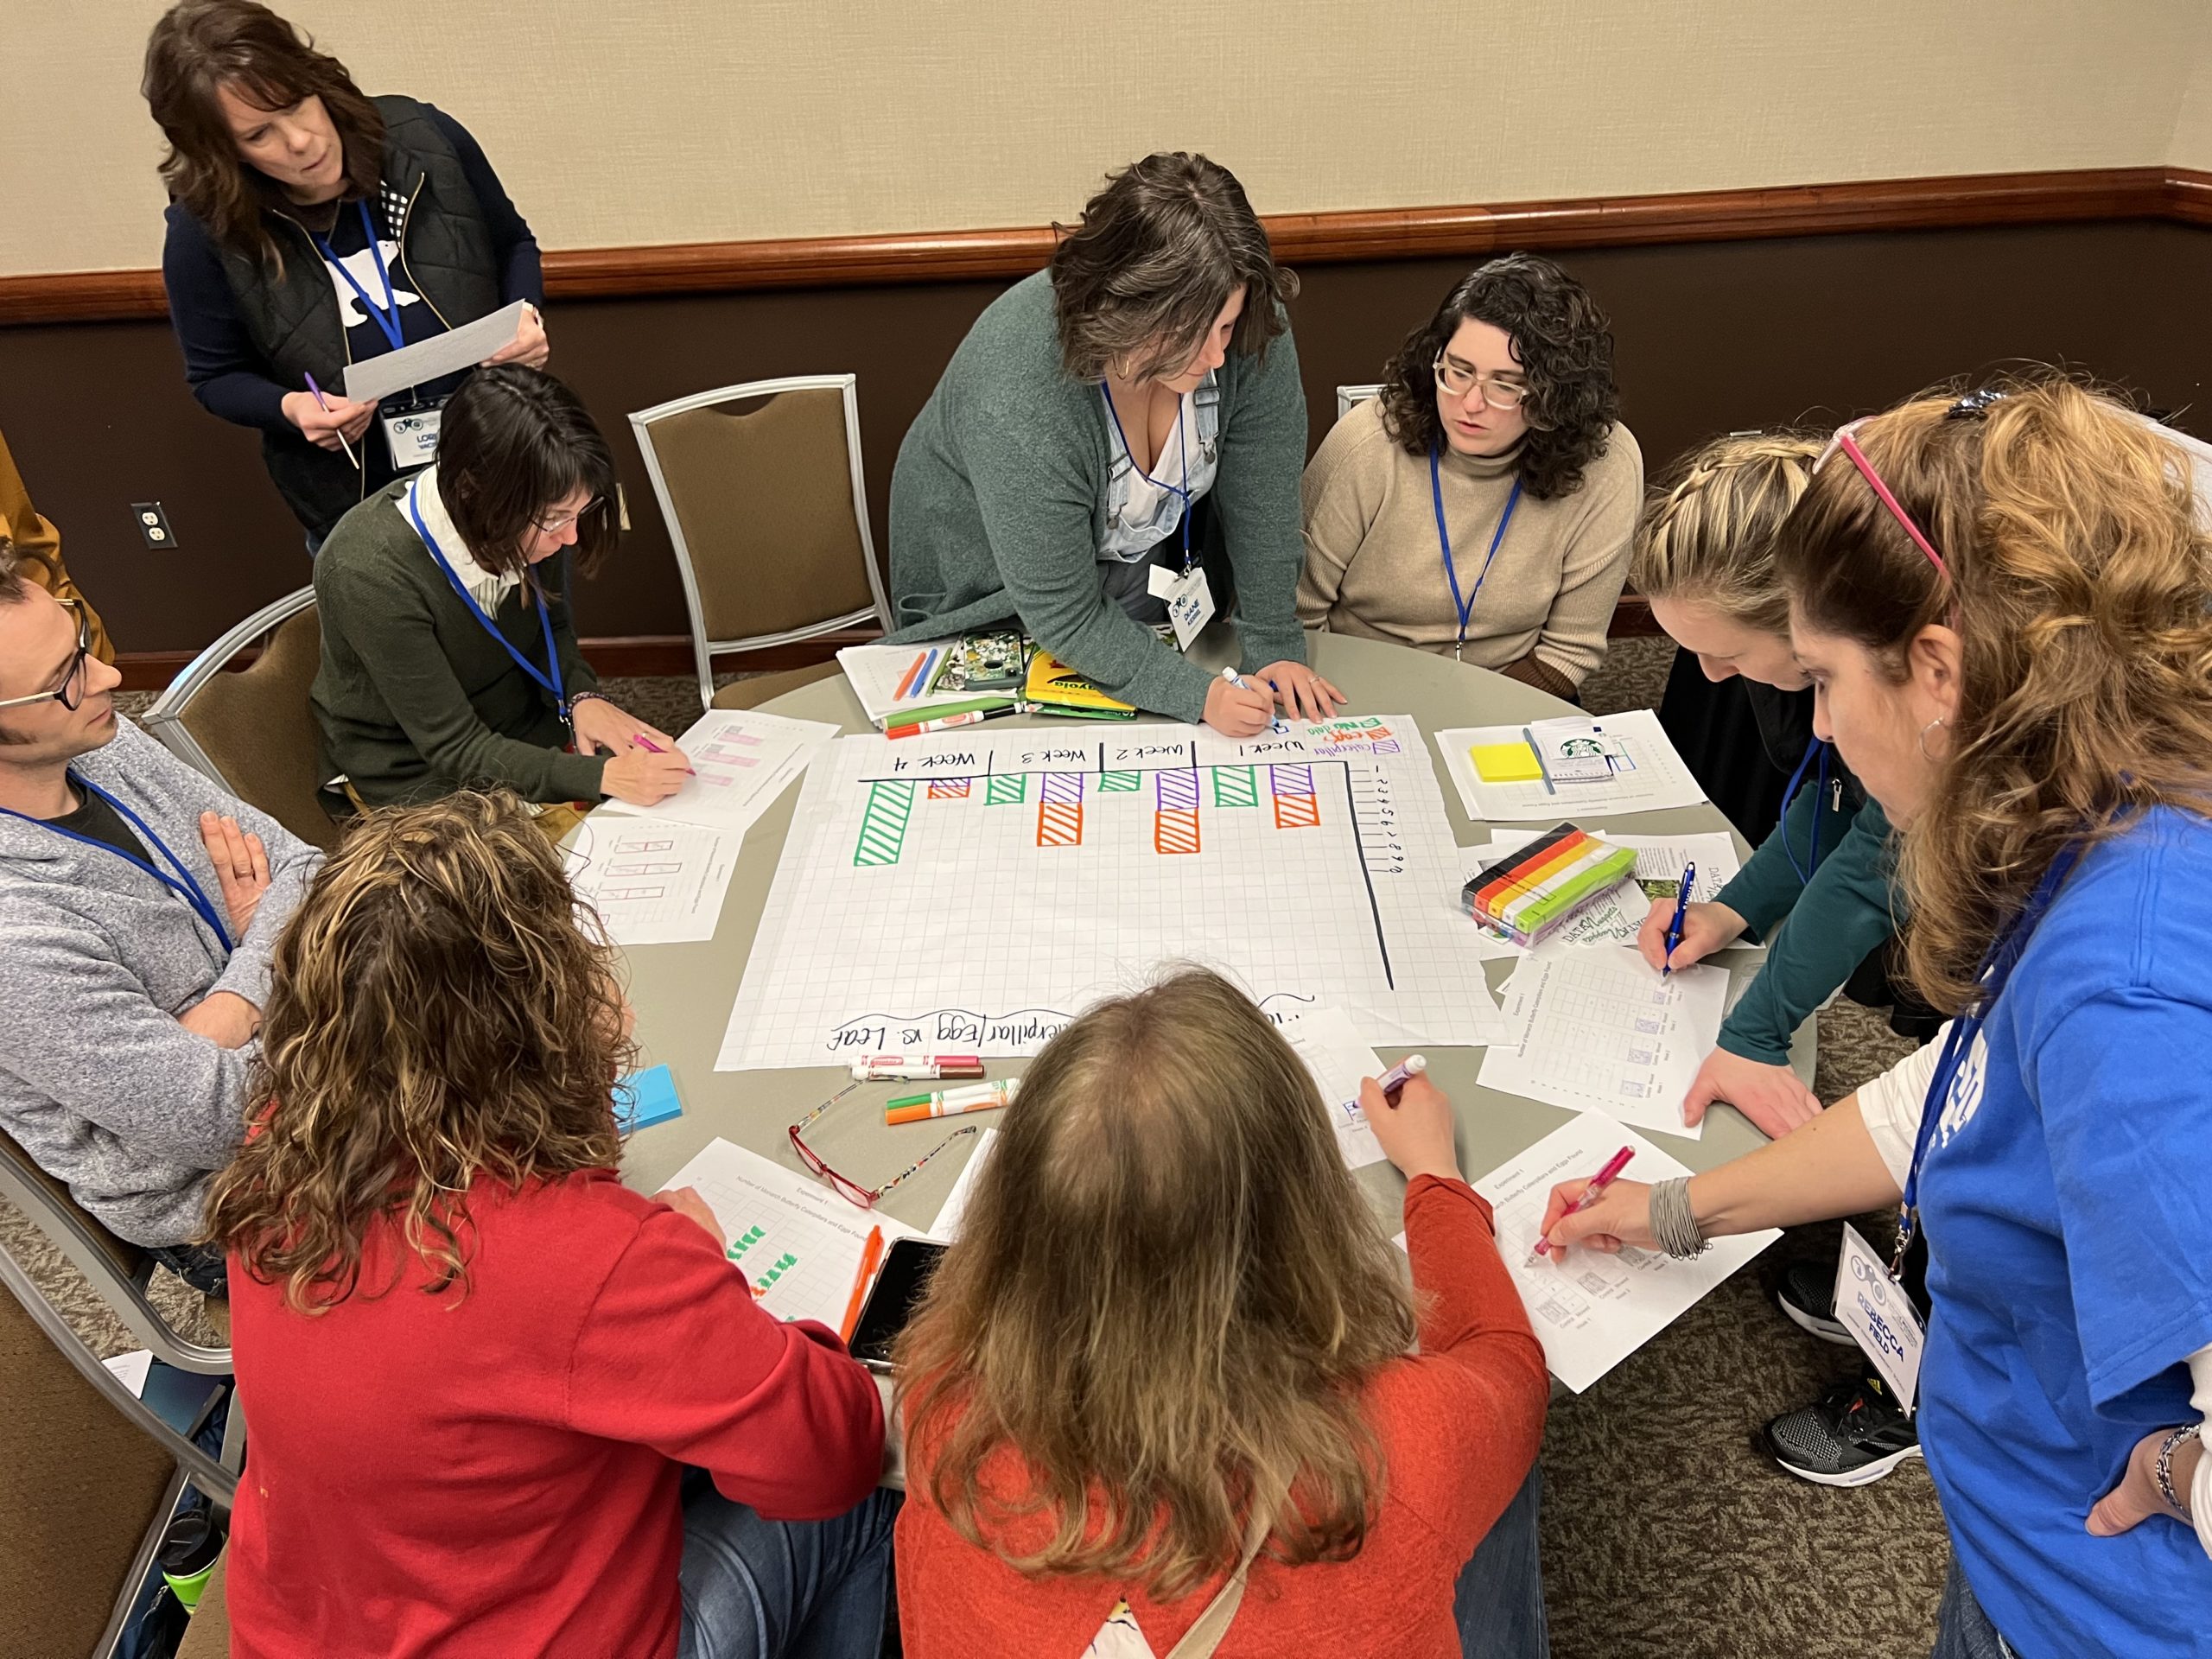
When asked to name scientists, students mention the likes of Charles Darwin, Albert Einstein, and Isaac Newton. And when asked to draw a scientist, students almost always draw a white man holding a test tube and wearing a lab coat. Professor Robin Costello from the University at Buffalo tells us more about a new study that parsed the effects of including visual depictions and humanizing information about scientists featured in undergraduate biology course materials.

This post was originally released by The Royal Society, here.


How students think of scientists reflects the false narrative that only certain types of people can be scientists – specifically white men with brilliant minds.

One powerful tool to combat this false narrative is to feature relatable, contemporary scientists whose identities do not match the dominant stereotype of a scientist featured in course materials. To highlight counter-stereotypical scientists, instructors can implement course materials that include photographs of scientists in their lecture slide decks. Or instructors can highlight humanizing information about scientists in their course materials. Sharing information such as the barriers scientists have faced or how they overcame obstacles in STEM may help students relate to scientists and envision their own STEM careers.

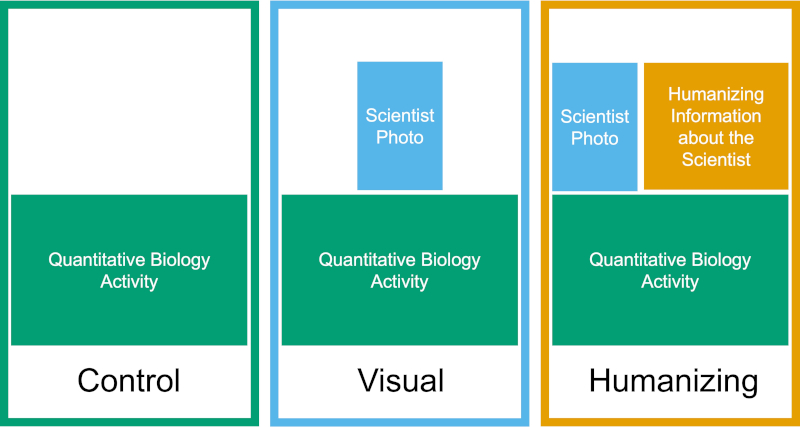
In our latest study, we parsed the effects of including visual depictions and humanizing information about scientists featured in undergraduate biology course materials with a large-scale research study. Over several academic terms and 36 undergraduate institutions in the United States, we distributed three versions of short quantitative activities (Data Nuggets) that varied in their level of information about the featured scientists (from including only their names and pronouns to full Project Biodiversify scientist profiles).

Data from over 3,700 students revealed that including humanizing information about scientists improves student engagement with quantitative biology activities. Photos of the scientists alone were not enough to improve student engagement. Instead, when provided information about the scientists’ life experiences, students found the activities more interesting, more relevant to their future careers, and put more effort into the activities. Our data suggests this pattern was driven by increased relatability of the featured scientists. 

Diagram of the three different treatments

While these results applied to all students, the strongest impacts were evident among students who shared excluded identities with the featured scientists.Our findings underscore the importance of providing students with examples of relatable scientists in STEM courses, rather than simply adding photos to increase representation. By highlighting humanizing information about scientists, instructors can both increase student engagement in their courses and improve equity in STEM.

We recommend several evidence-based resources to use in biology courses, including the Data Nuggets and Project Biodiversify materials studied here (together, DataVersify), as well as Scientist SpotlightsBioGrapI, and the Story Collider Podcast.

Little butterflies on the prairie

Butterfly on prairie flower.
A Tiger Swallowtail butterfly visiting a prairie flower to drink nectar.

The activities are as follows:

Butterflies are insects with colorful wings. You will often see them in a field, flying from flower to flower. Butterflies eat a sugary food made by flowers, called nectar. In return, the butterflies help the plants make seeds by moving pollen. As they travel from flower to flower, pollen is dropped off. This helps plants reproduce and make seeds. This is called pollination, and butterflies are pollinators. We need pollinators to grow many of the fruits and vegetables that we eat!

Prairies are habitats filled with many types of flowers. The Midwestern United States used to be covered in prairies. Today, most have been replaced by farm fields. Crops like corn and soybeans are commonly planted in the Midwest. Farm fields are important because we need land to grow our food. But this also means there is less food and habitat for butterflies.

Many farmers are concerned with growing our food while still protecting habitat for butterflies and other species. They want to know – how can we grow food for ourselves while still growing flowers for butterflies? A group of scientists in Michigan is working with farmers to think of solutions. The team is made of people from many different backgrounds and work experiences. The members of the team change over time, but typically 8 scientists are working together at a time. They all come together to brainstorm and do their research at the Kellogg Biological Station in Michigan.

Group of researchers ready to go out into field to butterfly survey.
Members of the Haddad Lab, ready to go out for a day of butterfly sampling in the prairie strips!

Prairie strips are a new idea that might help both farmers and the environment. These strips are small areas of prairie that can be added to farm fields. They look like rows of flowers and grasses within a field. They create habitat for many species, like butterflies, birds, ants, and even microscopic fungi and bacteria! Prairie strips may also help our food grow better by providing habitat for pollinators.

To figure out if prairie strips are able to draw in butterflies, the research team needed to collect data. They visited a large experiment that had many different kinds of farm fields. Some of the fields had prairie strips, while others did not. They thought prairie strips would help butterflies by adding habitat for them in farm fields that usually don’t have many flowers. They predicted they would see more butterflies in fields that have prairie strips and fewer in fields without these strips.

To count the butterflies in each type of field, the team went out on sunny spring and summer mornings when butterflies were flying around and eating nectar. They walked along the same paths in the same fields at the same time every week. Each time, they counted all the butterflies they saw within 5 meters. Each walk was 12 minutes long and followed a 150-meter path. They did these counts in 6 farm fields without prairie strips and 6 farm fields with prairie strips. The team counted butterflies like this 20 times over the summer. At the end of the summer, they added up all of the butterflies observed in each field. This number is called butterfly abundance.

Featured scientists: The Haddad Lab from Kellogg Biological Station Long Term Ecological Research Program – KBS LTER

Flesch–Kincaid Reading Grade Level = 7.3

Poop, poop, goose!

Cackling Goose next to a pile of goose poop, or feces
Cackling Goose next to a pile of goose poop, or feces. Photo by Andrea Pokrzywinski.

The activities are as follows:

Each spring, millions of birds return to the Yukon-Kuskokwim Delta. This delta is where two of the largest rivers in Alaska empty into the Bering Sea. It is also one of the world’s most significant habitats for geese to breed and raise their young. 

With all these geese coming together in one area, they create quite a mess – they drop tons of poop onto the soil. So much poop in fact, that scientists wonder whether poop from this area in Alaska could have a global impact! Climate change is a worldwide environmental issue that is caused by too many greenhouse gasses being released into our atmosphere. Typically, we think of humans as the cause of this greenhouse gas release, but other animals can contribute as well. 

When poop falls onto the soil it is decomposed by bacteria. Bacteria release methane (CH4), a potent greenhouse gas. The more geese there are, the more poop they will produce and the more food there will be for soil bacteria. By increasing the amount of greenhouse gasses that are released by soil bacteria, geese might actually indirectly contribute to global climate change.

Trisha is an ecosystem ecologist who scoops goose poop for research projects. Her research is looking into whether animals, other than humans, can change the carbon cycle. Trisha teamed up with Bonnie, a fellow ecosystem ecologist. Bonnie studies how matter moves between the living parts of the environment, such as plants and animals, and the nonliving parts. She is especially interested in how bacteria in the soil play a role in the carbon cycle.

Together, the team designed a three-year project to figure out the effects of goose poop on the carbon cycle. Each summer, a large team of researchers spend 90 days camping on remote sites near the Yukon-Kuskokwim Delta. The team scooped up poop from nearby goose habitats to use in their experiments. They set up six control plots where they added no poop and six treatment plots where they added poop. From these twelve plots, the team measured methane emissions from the soil. Methane was measured as methane flux in micromoles, or µM. These data helped them determine how ecosystems respond to geese by measuring whether goose poop affects methane production by soil bacteria.  

Featured scientists: Trisha Atwood of Utah State University and Bonnie Waring of Imperial College. Written by Andrea Pokrzywinski.

Flesch–Kincaid Reading Grade Level = 8.7

Additional teacher resources related to this Data Nugget include:

Helping students hear the stories that data tell

Article Highlights

High school students work with a Data Nuggets module.
High school students work with a Data Nuggets module. Credit: Paul Strode
  • Michigan State University’s Data Nuggets program is starting its third round of funding from the National Science Foundation to improve data literacy in K-16 students.
  • The program, operated by the Kellogg Biological Station, also introduces real STEM professionals through storytelling, helping students better relate to their projects and engage more deeply with the program’s content.
  • In collaboration with Auburn University, the newest NSF grant will help Data Nuggets further that engagement and introduce students to a greater diversity of scientists.

A data literacy program that’s also changing students’ relationships with science and scientists is entering its third round of funding with a new $1.5 million grant from the National Science Foundation.

In collaboration with Auburn University, the Data Nuggets program at the W.K. Kellogg Biological Station, or KBS, will work to identify factors that improve equity and success in undergraduate STEM education.

Launched by Michigan State University in 2011, Data Nuggets is a curriculum development project designed to help students better understand and use data. The program shows how professionals in science, technology, engineering and math really work with data by sharing their stories, which also enables students to relate on a much more personal level.  

Data Nuggets challenges students from kindergarten through undergraduate levels to answer scientific questions using data to support their claims. The questions and data originate from real research provided by scientists whose studies range from physics to ecology to animal behavior. 

To add the personal element, Data Nuggets is collaborating with Project Biodiversify — another education program started at MSU — to add the scientists’ bios, which include information like hobbies and their lives outside of science. This helps students relate to the researchers and see them less as strangers in lab coats and more as scientific role models. 

“We’ve found that it’s the scientists that are engaging students in the activities,” said Elizabeth Schultheis, co-leader of the Data Nuggets program. “If they connect to the role model, then you can get students to do the data literacy activities because they know, ‘Oh, this is a real person. I relate to this person. And I’m working with authentic, real data. I’m not just doing busy work.’” 

Schultheis, who earned her doctorate in plant biology from MSU, is also the education and outreach coordinator for the Long-Term Ecological Research, or LTER, program at KBS, which supports Data Nuggets. Schultheis and co-leader, Melissa Kjelvik, developed and run the program, forming partnerships to research and fund the program.

“With our current research, we’re trying to figure out what is the special thing that’s really resonating with students in terms of the role models,” Kjelvik said.

“Our research will investigate how and why role models are critically important for students,” said Cissy Ballen. Ballen is an associate professor in the Department of Biological Sciences at Auburn, the lead institution on the NSF grant, which builds on the past success of Data Nuggets and will help ensure its future impact.

“The theory behind this is that students must be able to see a scientist’s success as attainable to relate to that scientist,” Ballen said. “My prediction is that students will find success most relatable when they see some scientists, like them, have struggled with science, but then were able to overcome that struggle.” 

Elizabeth Schultheis (right) and Melissa Kjelvik (left) lead the Data Nuggets program at Michigan State University’s W.K. Kellogg Biological Station.

Making data talk

Many students’ eyes gloss over when they hear terms like “data” or “science.” 

Even Schultheis admits she didn’t appreciate the significance of data until she was a grad student collecting her own. The problem, she said, is that kids are often taught how to make a graph, for example, but not why.

“I never really learned to care until I understood the reason I make a graph is because I want to answer a question,” Schultheis explained. “I need to see the data, what it looks like. And that’s why I make a graph.” 

Data Nuggets doesn’t change the skills that are taught in conventional curricula. Students still learn how to make and label axes, for example, and then how to plot data to create graphs. But they also get a more immersive introduction into why real people use these skills.

“Our purpose with these Data Nuggets modules is that everything is always given real context and always in service of a scientific question,” Schultheis said. “It’s always: Here’s a scientist. Here’s the question that they really care about and the reason they collected this data is because they want to answer this question. And you make the graph to visualize it so that you can see what the data is telling you.”

Data Nugget activities come in four levels, so instructors can use the ones best suited for their specific classes. Level 4 activities are designed for high schoolers and undergraduates, while level 1 activities are appropriate for elementary schools and higher grades looking for a refresher after a summer break, for example.

Teachers also have flexibility with how to present an activity based on their goals. For example, instructors can choose activities with completed graphs so students can focus on interpreting what they see to answer questions.

Or students can be given blank grids to give them experience in creating useful representations of data from scratch.

Connie High, a science teacher at Delton Kellogg High School about five miles from KBS, calls Data Nuggets “a game changer.”  

She said that her students, when they’re new to Data Nuggets, can usually make claims and find supporting evidence. The challenge is learning how to articulate the connection between the two.

“They really struggle with how to link claim, evidence and reasoning. They tend to just restate the evidence again,” High said. 

“With Data Nuggets, we definitely see an improvement from the beginning of the year to the end.” 

Humanizing data 

The Data Nuggets program started 13 years ago as a grassroots collaboration between KBS researchers — including Schultheis and Kjelvik, who were then grad students at KBS — and K-12 teachers, including High. 

More than 120 scientists have contributed more than 120 data literacy activities since then. Tens of thousands of people regularly use the Data Nuggets website. Links to various Data Nuggets stories can even be found in science textbooks. 

“Long-term relationship building is why we got such good insights from teachers about what their students needed, because they already had trust with us, and we went into their classrooms and learned from them,” Schultheis said. “And building relationships with scientists who trust us to tell their stories correctly, who are giving their own stories for students to read and learn about, continues to be critical to our success.”

But exactly how to best package and present the data stories falls to Schultheis and her colleagues. Previous research has supported the idea that focusing on the scientist and why they collected the data is essential. After all, data is just numbers. It’s human interaction that puts numbers in perspective, gives the scientific question context and engages students in the activity.

“Humanizing the data is at the crux of this work,” Ballen said. “Data Nuggets is such a successful resource because of the way they humanize the data component and contextualize it within the science itself and show that it’s being done by relatable scientists. They do that really well.”

With its third round of NSF funding, Data Nuggets is attempting to fine-tune how to best present the scientist role models and the stories to improve student engagement with science even more.

The goal is not only to increase the portrayal of under-represented groups among scientist contributors, but also for students to see that they share some things in common with the scientists they see. 

“We used to ask students to draw what a scientist looks like, and they all would draw someone who looks like Albert Einstein,” High said. “It’s incredibly important that they see there are scientists who look like them.”

“You can imagine if you were a student sitting in a classroom you might get an activity that features a scientist from a prestigious university with awards and that sort of thing, and that might not be very relatable,” Ballen said. “Success might not be perceived as attainable.”

Data Nuggets is working to combat that perception.

For example, there’s a Data Nugget called “Trees and the City”, featuring a photo of a smiling University of Minnesota ecologist named Adrienne Keller wearing a bike helmet and sunglasses. A video shows Keller riding her bike through neighborhoods in the Twin Cities as she describes her interest in tree patterns. She poses her dataset’s main question: “Are there differences in the total canopy cover or the number of tree species planted in a neighborhood based on residents’ income level or percentage of BIPOC — Black, Indigenous, and People of Color — residents?”

Another Data Nugget was written by a community scientist from Bayfield, Wisconsin, located on the south shore of Lake Superior. He’s pictured wearing shorts and gym shoes as he stands on ice. 

For his Nugget, he used historical data to answer his question if the winters were getting shorter and changing the dynamics of how people could travel in the area. 

He also happened to be a high school student.

“That’s the dream outcome,” Schultheis said, “that students realize how powerful data are, and they can be advocates for themselves and their communities because they can actually go to the source of information and ask and answer questions.” 


This story was written by Lynn Waldsmith, and was originally posted on the Michigan State University, College of Natural Science website here.

Auburn and MSU collaborate on NSF IUSE grant to determine what makes an effective scientific role model

Members of the Auburn and MSU research team sharing a meal.

Scientific role models increase student success in their science courses as well as inspire students to pursue science careers. The Ballen Lab at Auburn University has completed significant research demonstrating that role models with diverse identities are lacking in undergraduate biology classrooms. Students with identities that are not represented in their undergraduate science courses do not have many opportunities to see themselves in science careers and as scientific leaders.

“I am excited to collaborate with researchers at Michigan State University to identify factors that improve equity and success in undergraduate STEM education. Our research will investigate how and why role models are critically important for students,” said Cissy Ballen, associate professor in the Department of Biological Sciences.

The collaborative team, led by Ballen at Auburn and Elizabeth Schultheis at MSU, was awarded $1.5 million from the National Science Foundation’s Division of Undergraduate Education.

Robin Costello, a postdoctoral scientist in the Ballen Lab working to understand the relationship between role models and successful student outcomes, explained, “Featuring relatable scientist role models in classroom materials is a low-cost and accessible way to increase the recruitment and persistence of students with identities historically and currently excluded from STEM.”

The research team’s recent research showed a direct correlation between relating to scientific role models and student engagement. “These results led to more questions about the critical features of scientist role models that make them effective and served as the foundation for the recently awarded project,” Ballen explained. “Theory makes several predictions about why and how role models are critical to student success. With this support from NSF, we will conduct critical research that tests theory on what makes an effective role model.”

Costello added, “Our research will specifically explore how to tell scientists role model stories in ways that improve student outcomes.” The project is entitled “Collaborative Research: Sharing Scientist Role Model Stories to Improve Equity and Success in Undergraduate STEM Education.”

“Several popular resources have been created to combat the pervasiveness of the stereotypical scientist in biology and STEM curricular materials,” Ballen added. An important long-term result of the project are free, open-source materials for educators to use in their classrooms to nurture more inclusive environments where students can learn from a wide array of STEM leaders to whom they can relate.

These resources will develop biology data literacy curricular materials that teach quantitative skills while simultaneously highlighting the diversity of scientists in STEM. These resources will be based on two well-known educational resources: Data Nuggets, resources that are developed in a partnership between scientists and teachers, and Project Biodiversify, a site that offers education tools for diversity and inclusion in biology classrooms.


Our team will be recruiting instructors to implement the activities in classrooms. If you are interested in participating in this project, please contact mjb0100@auburn.edu. For the original story, written by Maria Gebhardt, visit the Auburn page here.

Which tundra plants will win the climate change race?

Some arctic Tundra plant species monitored in this experiment.
Arctic tundra plant species monitored in this experiment.

The activities are as follows:

The Arctic, the northernmost region of our planet, is home to a unique biome known as tundra. While you might think of the arctic tundra as a blanket of snow and polar bears, this vast landscape supports a diversity of unique plant and animal species. The tundra is an area without trees that supports many species of plants, mammals, birds, insects, and microbes. 

Arctic environments present many challenges to plants. Temperatures only creep above freezing for about three months each year. This short arctic summer means that the species that live there only have a brief period to grow and reproduce. From mid-May to the end of July the sun doesn’t set, so there’s plenty of light available. Plants need this light for photosynthesis to make sugars for food. 

Even when there is light, plants need to wait until the snow has melted and the soil has thawed enough for them to grow. Tundra plants have short roots since they can’t grow through frozen ground. These roots try to get nutrients the plant needs from the soil. But with the soil so cold, decomposition is very slow. This means that microbes cannot easily convert dead plant material into nutrients that plants need such as nitrogen and phosphorus. For this reason, the growth of tundra plants is usually limited by nutrients.

Climate change is altering the arctic environment. With warmer seasons and fewer days with snow covering the ground, soils are thawing more deeply and becoming more nutrient-rich. With more nutrients available, some plant species may be able to outcompete other species by growing taller and making more leaves than other plant species. This means that climate change may alter the whole ecosystem game in the tundra. Instead of nutrients limiting plant growth, it may shift to a game of competition between plants reaching for light.

Gus (left) and Jim (right) set up a weather station to monitor air temperature and humidity on the tundra.

To simulate the environmental conditions, we can look at long-term data from two scientists, Gus and Terry, who started working at the Toolik Field Station in northern Alaska in the 1970s. They conducted a series of experiments and learned that two nutrients, nitrogen and phosphorus, limited plant growth in the tundra. Then, in 1981, they set up a new experiment where they added both nutrients to experimental plots every year. Gus and Terry compared plant growth between these fertilized plots and control plots that were not fertilized. They wanted to figure out how each plant species would respond to more nutrients over the long term and what would happen to the plant community to see if some species would outcompete others in the fertilized conditions. This experiment is one way to mimic future conditions and test hypotheses about what we might expect to see.

The fertilizer was added every year in early June after the snow melted off the plots. Beginning in 1983, other scientists, such as Laura and Ruby, began to sample these plots. They dug out small 20-centimeter by 20-centimeter samples of tundra and brought them back to the nearby Toolik Field Station. In the lab, the tundra sample was separated into individual plant species and “plucked” to sort by different plant tissue types: leaves, stems, and roots. Then these plants were dried and weighed to determine the biomass (mass of living tissue) of each species in the sample. The fertilized and non-fertilized plots were sampled and plucked six times between 1983 and 2015. This means that many of the scientists who sampled the plots in 2015 had not yet been born when the experiment started in 1981!

Featured scientists: Gus Shaver (he/him), Jim Laundre (he/him), Laura Gough (she/her), and Ruby An (she/her) from Toolik Field Station, Arctic Long-term Ecological Research Site

Flesch–Kincaid Reading Grade Level = 8.6

Additional teacher resources related to this Data Nugget:

Mowing for Monarchs – Extension Activities

Gabe Knowles has developed and piloted several data activities to accompany these Data Nuggets activities. For the first activity, Gabe developed an extension to bring his data into elementary classrooms. Using beautiful art created by Corinn Rutkoski, the following are materials to print and use the activity in your classroom:

This activity was first piloted at Michigan Science Teachers Association Annual Meeting in 2023.

Does more rain make healthy bison babies?

A bison mom and her calf.

The activities are as follows:

The North American Bison is an important species for the prairie ecosystem. They are a keystone species, which means their presence in the ecosystem affects many other species around them. For example, they roll on the ground, creating wallows. Those wallows can fill up with water and create a mini marsh ecosystem, complete with aquatic plants and animals. They also eat certain kinds of food – especially prairie grasses. What bison don’t eat are wildflowers, so where bison graze there will be more flowers present than in the areas avoided by bison. This affects many insects, especially the pollinators that are attracted to the prairie wildflowers that are abundant in in the bison area. 

Not only do bison affect their environment, but they are also affected by it. Because bison eat grass, they often move around because the tastiest meals might be scattered in different areas of the prairie. Also, as bison graze down the grass in one area they will leave it in search of a new place to find food. The amount of food available is largely dependent upon the amount of rain the area has received. The prairie ecosystem is a large complex puzzle with rain and bison being the main factors affecting life there. 

The Konza Prairie Biological Station in central Kansas has a herd of 300 bison. Scientists study how the bison affect the prairie, and how the prairie affects the bison. Jeff started at Konza as a student, and today he is the bison herd manager. As herd manager, if is Jeff’s duty to track the health of the herd, as well as the prairie. 

One of the main environmental factors that affect the prairie’s health is rainfall. The more rain that falls, the more plants that grow on the prairie. This also means that in wetter years there is more food for bison to eat. Heavier bison survive winters better, and then may have more energy saved up to have babies in the following spring. Jeff wanted to know if a wet summer would actually lead to healthier bison babies, called calves, the following year.

Jeff and other scientists collect data on the bison herd every year, including the bison calves. Every October, all the bison in the Konza Prairie herd are rounded up and weighed. Since most of the bison calves are born in April or May, they are about 6 months old by the time are weighed. The older and the healthier the calf is, the more it weighs. Very young calves, including those born late in the year, may be small and light, and because of this they may have a difficult time surviving the winter. 

Jeff also collects data on how much rain and snow, called precipitation, the prairie receives every year. Precipitation is measured daily at the biological station and then averaged for each year. Precipitation is important because it plays a direct role in how well the plants grow. 

Jeff and a herd of bison on the Konza prairie.
Konza LTER logo

Featured scientist: Jeff Taylor from the Konza Prairie Biological Station

Written by: Jill Haukos, Seton Bachle, and Jen Spearie

Flesch–Kincaid Reading Grade Level = 8.7

Additional teacher resources related to this Data Nugget include:

  • The full dataset for bison herd data is available online! The purpose of this study is to monitor long-term changes in individual animal weight. The datasets include an annual summary of the bison herd structure, end-of-season weights of individual animals, and maternal parentage of individual bison. The data in this activity came from the bison weight dataset (CBH012).
  • For more information on calf weight, check out the LTER Book Series book, The Autumn Calf, by Jill Haukos.

Changing climates in the Rocky Mountains

Lower elevation site in the Rocky Mountains: Temperate conifer forest. Photo Credit: Alice Stears.

The activities are as follows:

Each type of plant needs specific conditions to grow and thrive. If conditions change, such as temperature or the amount of precipitation, plant communities may change as well. For example, as the climate warms, plant species might start to shift to higher latitudes to follow the conditions where they grow best. But what if a species does well in cold climates found at the tops of mountains? Because they have nowhere to go, warming puts that plant species at risk.  

To figure out if species are moving, we need to know where they’ve lived in the past, and if climates are changing. One way that we can study both things is to use the Global Vegetation Project. The goal of this project is to curate a global database of plant photos that can be used by educators and students around the world. Any individual can upload photos and identify plant species. The project then connects each photo to information on the location’s biome, ecoregion, and climate, including data tracking precipitation and temperature over time. The platform can also be used to explore how the climates of different regions are changing and use that information to predict how plant communities may change. 

Daniel is a scientist who is interested in sharing the Global Vegetation Project data with students. Daniel became interested in plants and vegetation when he learned in college that you can simply walk through the woods and prairie, collect wild seeds, germinate the plants, and grow them to restore degraded landscapes. Plants set the backdrop for virtually every landscape that we see. He thinks plants deserve our undivided attention.

Daniel and his team wanted to create a resource where students can look deeper into plant communities and their climates. Much of the inspiration for the Global Vegetation Project came from the limitations to undergraduate field research during the COVID-19 pandemic. Students in ecology and botany classes, who would normally observe and study plants in the field, were prevented from having these opportunities. By building an online database with photos of plants, students can explore local plants without having to go into the field and can even see plants from faraway places. 

Daniel’s lab is based in the Rocky Mountains in Wyoming, where the plants are a showcase in both biodiversity and beauty. These communities deal with harsh conditions: cold, windy and snowy winters, hot and dry summers, and unpredictable weather during spring and fall. The plants rely on winter snow slowly melting over spring and into summer, providing moisture that can help them survive the dry summers. 

The Rocky Mountains are currently facing many changes due to climate change, including drought, increased summer temperatures, wildfires, and more. This creates additional challenges for the plants of the Rockies. Drought reduces the amount of precipitation, decreasing the amount of water available to plants. In addition, warmer temperatures in winter and spring shift more precipitation to rain instead of snow and melts snow more quickly. Rain and melted snow rapidly move through the landscape, becoming less available to plants in need. On top of all this, hotter, drier summers further decrease the amount of water available, stressing plants in an already harsh environment. If these trends continue, there could be significant impact on the types of plants that are able to grow in the Rocky Mountains. These changes will have an impact on the landscape, organisms that rely on plants, and humans as well.

Daniel and his colleagues pulled climate data from a Historic period (1961-2009) and Current period (2010-2018). They selected two locations in Wyoming to focus on: a lower elevation montane forest and a higher elevation site. To study climate, they focused on temperature and precipitation because they are important for plants. They wanted to study how temperature and precipitation patterns changed overall and how they changed in different seasons. They predicated temperatures would be higher in the Current period compared to the Historic period in both locations. For precipitation, they predicted there would be drier summers and wetter springs.

Featured scientist: Daniel Laughlin from The University of Wyoming. Written by: Matt Bisk.

Flesch–Kincaid Reading Grade Level = 10.5

Additional teacher resource related to this Data Nugget:

Nitrate: Good for plants, bad for drinking water

Evelyn is a scientist at the University of Minnesota. She studies nitrate pollution and how growing perennial crops may prevent it from entering our drinking water.

The activities are as follows:

Nitrogen is the most abundant element in our atmosphere. All living things need nitrogen to live and grow, but plants and animals can’t use the atmospheric form. Instead, many plants extract nitrogen from the soil and in the case of crops, we supply nitrogen through fertilizer, in a form called nitrate.

Nitrate dissolves well in water. This helps make it easy for plants to use, but it can also end up in rivers and groundwater. Groundwater with just 10 milligrams of nitrate per liter is not safe to drink because it can lead to a higher risk of cancer and birth defects. It is really expensive to remove nitrate from drinking water. Towns whose groundwater is contaminated must either pay to remove it or find a new drinking water source. Virtually all nitrate pollution comes from fertilizers used on crops, so one way to address this problem is to change the way we farm.

Annual plants live for just one season and typically have smaller shallower root systems than perennial plants, which live for multiple seasons. Most farmland grows annuals like corn and soybeans, but we get some of our food from perennials like apples, hazelnuts, and raspberries. Perennials stay in the ground all year and start growing right away in the spring before annual crops are even planted. Perennial grasses are particularly good at growing deep roots and taking up lots of nitrate from the soil. If we could produce more food from perennial plants instead of annual plants, crops may absorb enough nitrate to prevent it from getting into our drinking water.

For twenty years, researchers at The Land Institute in Kansas and at the University of Minnesota have been working on a new perennial grain crop called Kernza®, the seeds from a plant called intermediate wheatgrass. Kernza® can be used like wheat or rye, but it has a larger, deeper root system than regular annual wheat. Perennial plants’ deep roots are really good at absorbing dissolved nitrate in soil, so scientists wanted to study Kernza® in the field to see if it would prevent nitrate getting into groundwater.

Evelyn is one of these researchers. She grew up in Minneapolis, Minnesota and as a high school student, she was surprised to learn that agriculture has a huge impact on soil and water quality, wildlife habitat, and biodiversity. She wanted to help protect the environment, so she studied Food Systems at the University of Minnesota. A few years later, she joined a project that involved planting Kernza® in rural areas to prevent and reduce nitrate contamination of drinking water. Farmers, city officials, water managers, and scientists worked together to find solutions. This project inspired Evelyn to study Kernza® and nitrate for her master’s degree.

In her experiment, Evelyn planted plots of Kernza® (foreground) and plots with a corn-soybean rotation (background). This photo was taken in a corn year. Lysimeters are used to collect groundwater samples. The white posts are holding up the lysimeter sampling tubes.

To see if Kernza® helped absorb more nitrate from soil than annual crops, Evelyn and her colleagues ran an experiment. They planted plots of Kernza® and other plots that rotated between corn and soybean every year. Plots with Kernza® and corn were fertilized with nitrogen. Soybean plots were not fertilized.

In the plots, they installed lysimeters: long tubes that go down several feet to collect soil water from below where most plant roots can reach it. Soil water is the water that sits between soil particles. It can be taken up by plant roots or trickle down into the groundwater that is used for drinking wells. Once it moves deeper than a plant’s roots, it can’t be taken up and is very likely to reach the groundwater. Evelyn took water samples from the lysimeters every ten days and analyzed them for nitrate concentration.  If more nitrate is found in soil water under corn and soybean plots than Kernza®, this would be good evidence that Kernza® takes up more nitrate and helps protect groundwater.

Featured scientist: Evelyn Reilly (she/her) from University of Minnesota

Flesch–Kincaid Reading Grade Level = 10.9