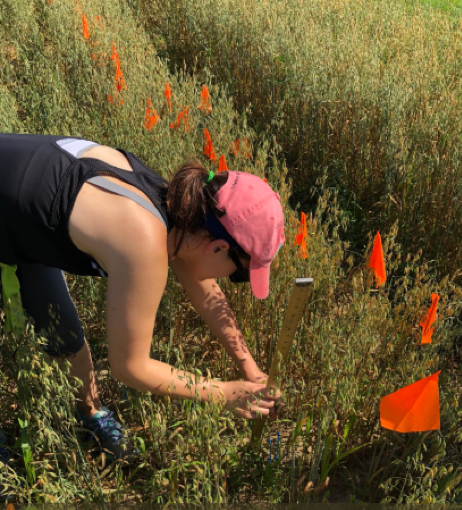
A plant breeder’s quest to improve perennial grain

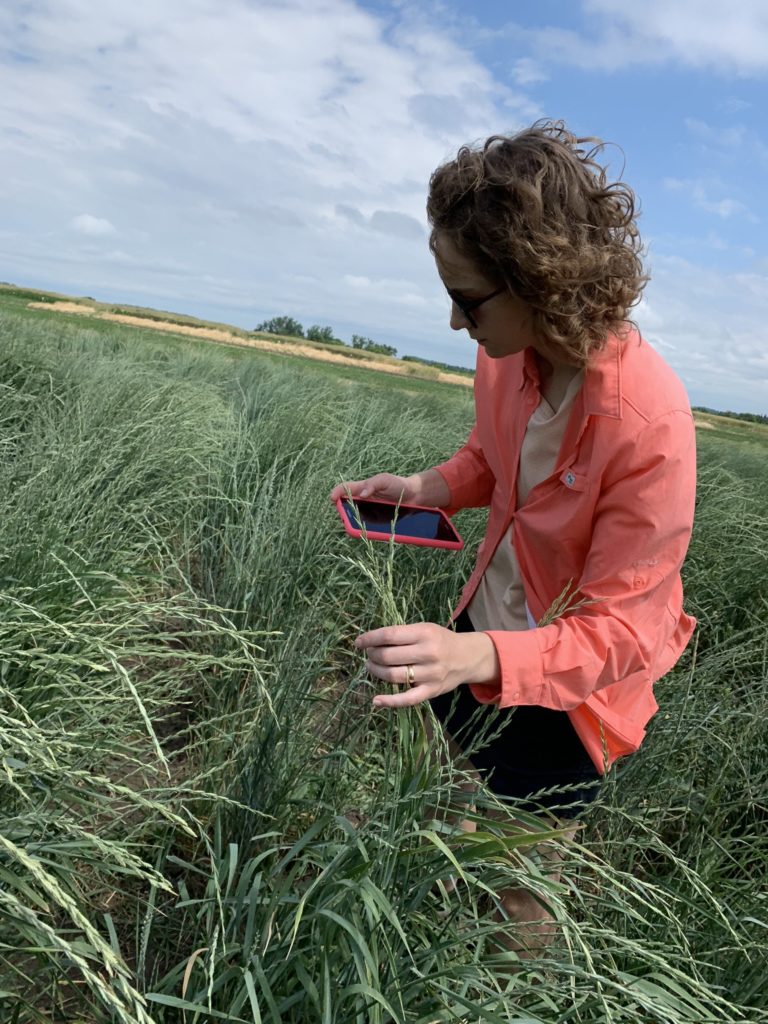
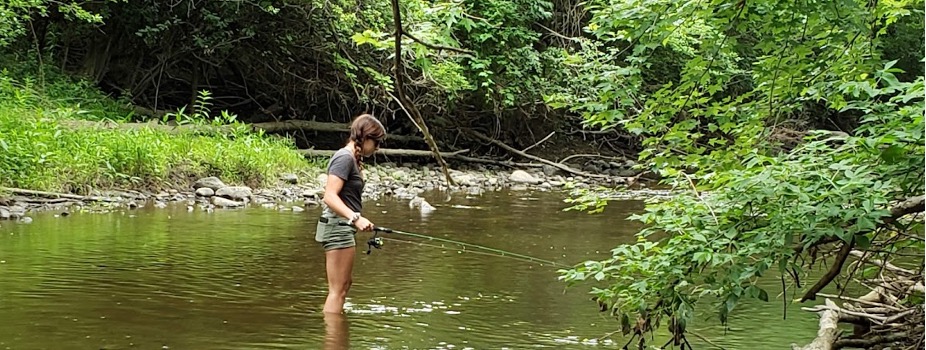
Hannah takes notes on the date of flowering in a Kernza® field in Southwest Minnesota.

The activities are as follows:

Kernza® is a new grain crop that is similar to wheat. It can be ground into flour and used in bread, cookies, crackers and more! Unlike wheat, the rest of the plant can be eaten by livestock such as cattle. Another difference is that Kernza® is a perennial, meaning it grows in the ground for multiple years, whereas annual wheat only grows for one year. However, the challenge is that annual wheat makes more grain and is easier to harvest and sell. This means farmers currently prefer growing annual wheat over Kernza®.

One way to address this mismatch between annual and perennial crops is through selective breeding. This is when humans select individual plants with traits that are desirable for a specific reason. This group of individuals are strategically bred together. The breeder’s goal is to shift the traits over generations. Scientists have only been working on breeding Kernza® for the past few decades; in comparison, humans started selecting annual wheat traits over 10,000 years ago! That is a lot of time to get the traits we are looking for.

Kernza® breeders are working on improving the same traits that have already been improved in annual wheat, including larger seed size. Kernza® scientists follow two main steps to breed plants 1) they select the best individuals from the population and 2) they intercross those individuals to create the next generation, or breeding cycle. With each breeding cycle, plant breeders see a slight improvement in the traits they selected.

Breeders can select plants based on phenotypes, genotypes, or both. Historically, plant breeders have selected based on desired phenotypes, or visible traits, only. Modern plant breeding can take advantage of the fact that we can now look at genotypes, or the genetic makeup, of individual plants quickly and at low costs. Scientists can use this information to make quicker breeding improvements, so we don’t have to wait another 10,000 years for high-yielding Kernza®!

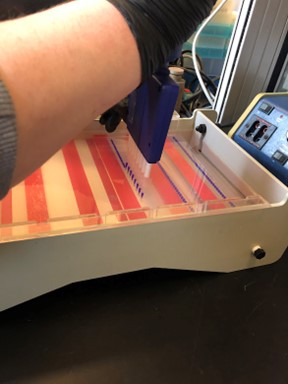
A scientist pipettes DNA samples into an agarose gel to separate samples based on genotype using gel electrophoresis.

Hannah is a scientist currently working on Kernza®. Hannah’s passion for plant breeding was ignited during her high school years. She discovered the captivating world of genetics in her AP Biology class. It was then that she first realized the potential for breeding crop plants to make them more productive and viable for human consumption.

Hannah decided to join other scientists who work on Kernza® at the University of Minnesota. Here, scientists have completed four breeding cycles and are about to start the fifth. Hannah wanted to see whether different genetic makeups (genotypes) lead to differences in seed size (phenotypes). Her goal was to look at each plants’ phenotype and genotype for seed size.

To genotype a plant, scientists collect a small piece of leaf tissue, extract the DNA, and send the DNA to a lab for sequencing. This process tells scientists the genetic makeup that ultimately leads to the traits that we see. Specifically, sequencing data identifies nucleotides, or genetic building blocks of each plant’s DNA. Plants have thousands of genes, which are made up of the DNA nucleotides A, T, C, and G.

Sequencing data can be recorded in several ways. One common way is as SNP data, or Single Nucleotide Polymorphism data. You can think of SNP data as the recipe for proteins. In a SNP dataset, each SNP represents a difference in a nucleotide. Similar to using a different ingredient in a recipe, different nucleotides can result in a different phenotype.

By looking at SNP data, plant breeders can identify differences in genotypes that lead to certain phenotypes. Hannah started by evaluating 1,000 Kernza® plants from the first four breeding cycles. Data on phenotypes had already been recorded for these plants. Hannah then collected SNP data to determine their genotypes as well. She was looking for a pattern between genotypes and phenotypes. If she sees that different genotypes have different phenotypes, scientists can then rely on genotypes to select individuals to breed in future breeding cycles.

Featured scientist: Hannah Stoll (she/her) from the University of Minnesota

Flesch–Kincaid Reading Grade Level = 8.9

Additional teacher resources related to this Data Nugget include:

Size matters – and so does how you carry it!

The activities are as follows:

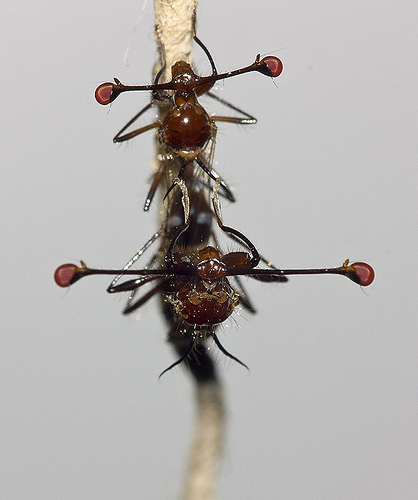
Stalk-eyed fly copulation.

In the wild, animals compete for limited resources. Things like food, water, shelter, and even reproductive mates can be hard to come by. Animals with traits and behaviors that make them more likely to survive and reproduce are said to have higher evolutionary fitness. Some animals have evolved special traits that advertise their fitness to potential mates. Male deer, elk, and moose have large antlers that they use to compete with other males, which demonstrates their fitness to females. Another interesting example is the stalk-eyed flies, in which the males grow long eye stalks to attract a mate. In these cases, females are more likely to choose males with the biggest traits.

Scientists have long predicted that these traits come with both benefits and costs. Large antlers or eyestalks may help a mate notice you, but also come with some costs. Extra weight takes more energy to move around and could make it more difficult to escape from predators. And yet, many studies have failed to find any measurable costs to males having these seemingly impractical traits.

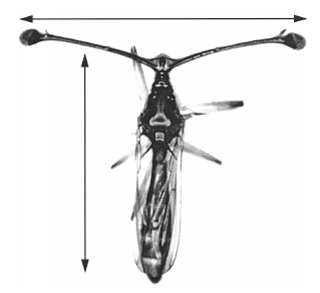
This scientific mystery puzzled Jerry and John, who study stalk-eyed flies. They had failed to identify and document any costs to having longer eyestalks, measured as the distance between the eyes, or eyespan. Common sense told them that having longer eye stalks should make flying more awkward for these flies. However, their data did not support this hypothesis. “When I started collecting data, I focused a lot on the performance costs and got kind of fixated on that,” John says of the team’s initial research. “It was frustrating when we couldn’t identify any actual decline in performance.”

John in the field when he first started his research – many decades ago!

The team began looking for an alternative explanation. They read about research supporting a new idea in a completely different kind of flying animal – barn swallows. Male barn swallows have long, ornate tails. These tails make male barn swallows less aerodynamic during flight. But males have also evolved to have larger wings relative to their body size. This could help them compensate for the extra burden associated with their long tails.

Jerry and John wondered if a similar thing might be at work in stalk-eyed fly wings. Perhaps the male stalk-eyed flies, like male barn swallows, had evolved to have larger wings relative to their body size to help them compensate for long eye stalks when flying. If this were the case, then they expected to see a positive correlation between wing size and eyespan. Could this be why they were unable to measure any disadvantage associated with having longer, more awkward eye stalks? In other words, male stalk-eyed flies with larger wings would be able to support longer eye stalks.

Eyespan (horizontal arrow) and body size (vertical arrow) of a stalk-eyed fly.

Jerry, John, and their team decided to test their new hypothesis by raising stalk-eyed flies in the lab to maturity, then collecting data about their body length, eyespan, and wing area.

To account for natural variation in body size among stalk-eyed flies, the team needed to use “relative” measurements based on body size. With these kinds of measurements, a value of zero (0) means that wing size or eyespan is exactly what you would predict for a fly of that body size. Negative values mean that wing size or eyespan are smaller than you would predict for that body size, while positive values mean that wing size or eyespan is greater than you would predict for that body size. For example, if a fly has a relative eyespan of -0.010, then the distance between the eyestalks was 0.010 millimeters shorter than expected based on its body size.

Featured scientists: Jerry Husak from the University of St. Thomas and John Swallow from the University of Colorado-Denver. Written by: Sam Holloway

Flesch–Kincaid Reading Grade Level = 8.8

Additional teacher resources related to this Data Nugget include:

You can find lessons to accompany many of John’s studies with insects on the Data Nuggets website! Check out the following Data Nugget activities!

A peer-reviewed journal article: Husak, J. F., Ribak, G., Wilkinson, G. S., & Swallow, J. G. 2011. Compensation for exaggerated eye stalks in stalk‐eyed flies (Diopsidae). Functional Ecology, 25(3), 608-616.

A video of a stalk-eyed fly in flight:

Round goby, skinny goby

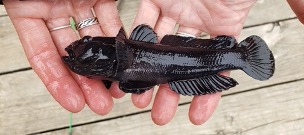
An invasive round goby from the Kalamazoo River, Michigan.

The activities are as follows:

Animals often have adaptations, or traits that help them live in certain environments. For fish, that can mean having a body shape that allows them to feed on available prey, better hide from predators, or swim more effortlessly. When these traits vary within the same species from one location to another, they are called local adaptations. Such adaptations were once thought to only evolve slowly over hundreds or thousands of generations. However, new evidence shows that evolution can result in meaningful adaptations much more quickly than originally thought, sometimes in just a few generations!

Invasive species are those that have been moved by humans to areas where they do not usually exist and cause disruptions to native ecosystems. Because they have been moved to new places where they did not evolve, invasive species often have traits that aren’t matched to their new habitats. When mismatches occur, species may be able to adapt in just a few generations in their new locations.

Several invasive species have been problematic in the Great Lakes of North America. The round goby is a small invasive fish species that arrived in the Great Lakes around 1990. It is a bottom-dwelling species that is able to quickly reproduce and crowd out native fish species. Both avid anglers, Jared and Bailey observed the increasing numbers of round gobies during their time spent outdoors. They noticed that sometimes round gobies would even outnumber all other native fish in an area.

Originally appearing just in the Great Lakes themselves, the species is increasingly being found in rivers throughout the region. Jared and Bailey were surprised this species did so well in both river and large lake habitats since they are very different environments for fish to live. For example, water is constantly flowing downstream in rivers, whereas lakes can be still or have waves near the shore. Also, these two habitats have different predator and prey species living in them and differ in water chemistry characteristics. With the spread of more and more round gobies into rivers, Jared and Bailey set out to learn how this species is successful in both habitats. They thought that round gobies found in rivers would have adaptations to help navigate fast flowing waters. Fish with narrower body shapes can move more easily in flowing waters, giving narrow-bodied individuals an advantage over those with bulkier bodies. Over time, those individuals with such an advantage would be more likely to survive and reproduce in the rivers, eventually shifting the entire river-dwelling population to a narrow body shape. They predicted that round gobies from rivers would have shorter body depths and narrower caudal peduncles, which is the area between the fish’s body and tail. To test their idea, Jared and Bailey captured and measured hundreds of round gobies from both Great Lakes and inland river habitats.

Michigan State University researcher Bailey Lorencen fishing for gobies in a Michigan river.

Featured scientists: Jared Homola (he/him) and Bailey Lorencen (she/her) from Michigan State University

Flesch–Kincaid Reading Grade Level = 11.2

How milkweed plants defend against monarch butterflies

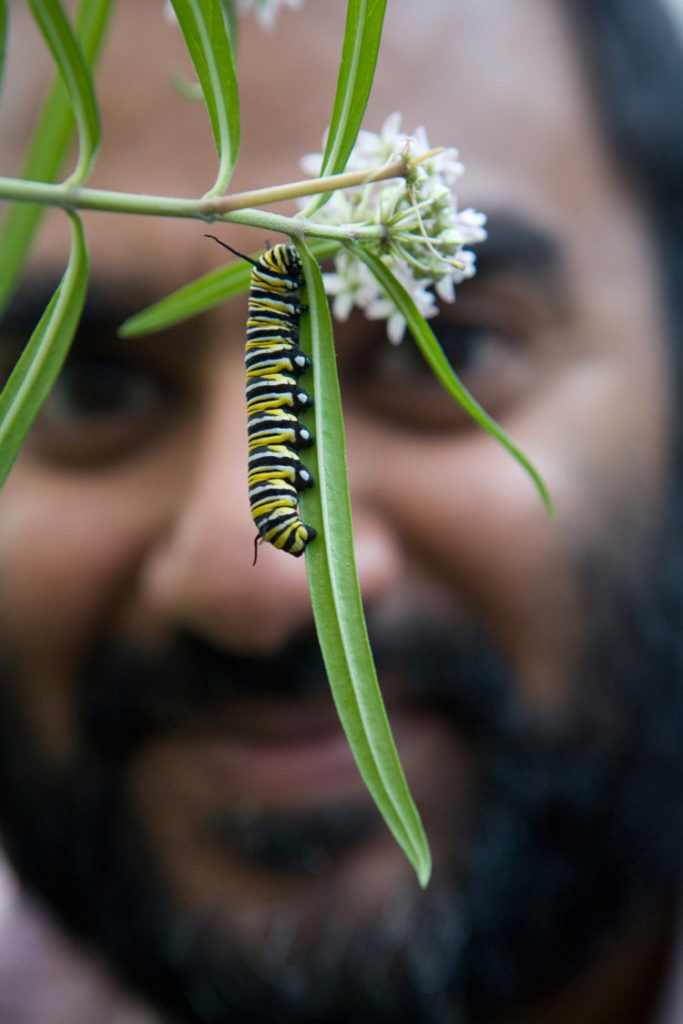
Anurag looking at a monarch caterpillar on a milkweed plant.

The activities are as follows:

For millions of years, monarch butterflies have been antagonizing milkweed plants. Although adult monarchs drink nectar from flowers, their caterpillars only eat milkweed leaves, which harms the plants. This is an ecological interaction called herbivory. The only food for monarchs is milkweed leaves, meaning they have evolved to be highly specialized, picky eaters. But their food is not a passive victim. Like most other plants, milkweeds fight back with defenses against herbivory.

Monarch butterflies lay their eggs on the underside of milkweed leaves. After eggs hatch, caterpillars start to feed and quickly meet the plant’s first defense. Milkweed leaves are covered in thousands of tiny hairs, called trichomes, that the caterpillar needs to shave off before they can take a bite. The next challenge happens when the caterpillar takes a bite of the leaf. They get a mouthful of latex, which is sticky like Elmer’s glue. The caterpillars have to be very careful in how they feed. They cut the veins in the leaf to drain out the latex before continuing to feed on the leaf. Even after monarch caterpillars make it past the trichomes and latex, there’s another defense they need to overcome. Milkweed leaves have chemical toxins called cardiac glycosides, which are poisonous to most animals. As they feed, monarchs eat some of this poison.

Anurag is a scientist who has long been fascinated by plants and their defenses. He thinks this comes from the fact that his mother was such an avid gardener. She would grow food, such as peppers, squashes, and tomatoes. He looks back and has memories that are associated with garden plants and their defenses. For example, he remembers eating a bitter cucumber as a kid and spitting it out. He also can still recall the bitter aroma on his hand after brushing against the sticky tomato leaves. And plants that are tough and stringy, like kale, are not as tasty to eat. These traits are examples of plant defenses in action, making them harder or less enjoyable to eat, reducing herbivory.

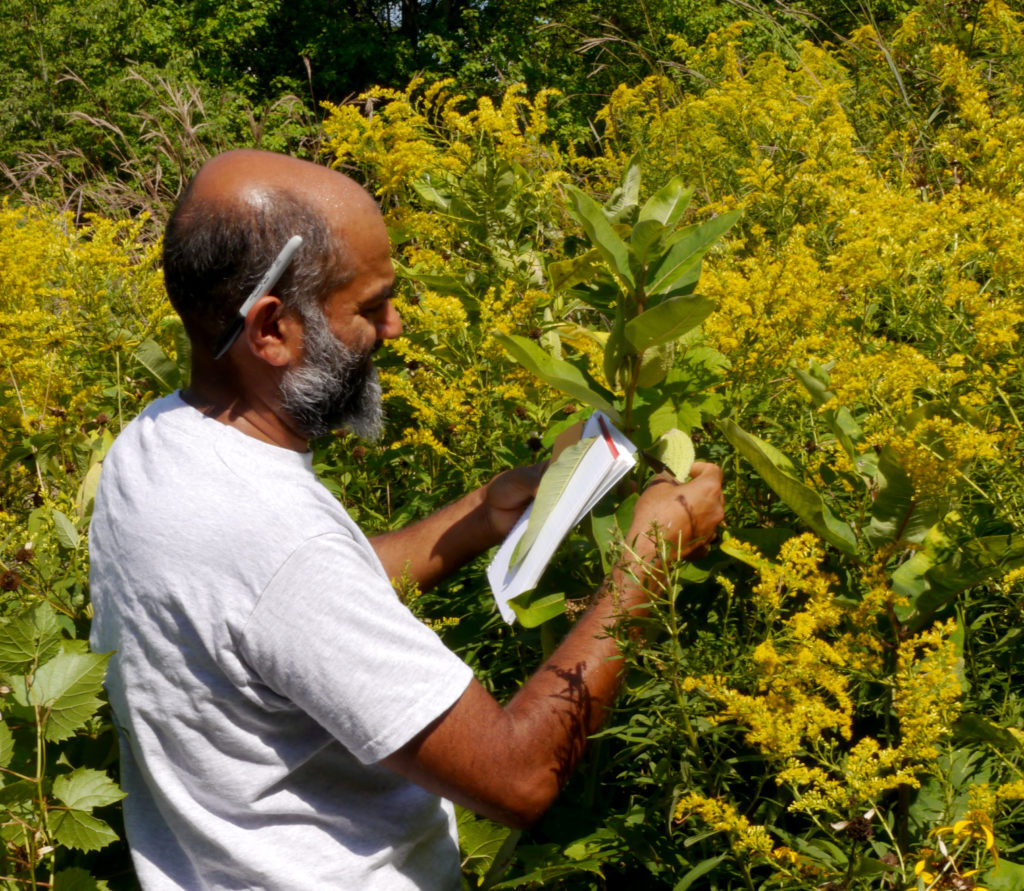
Anurag collecting data on milkweed plants.

Anurag first started studying milkweeds 20 years ago, based on a recommendation from a friend. His friend told him of the bitter, sticky, and furry leaves that were treasured by the monarch butterfly caterpillars. This led him to study the paradox of coevolution. The milkweed and monarch have such a tight relationship that over time, milkweeds have evolved multiple ways to defend themselves against their herbivores. In response, monarchs have evolved to overcome those defenses because they need to eat the milkweed. This arms race may continue to shift back and forth over the course of evolutionary time.

This back-and-forth battle between caterpillar and plant intrigued Anurag. He wanted to know whether milkweed’s defensive traits are still effective against monarchs, or have monarchs evolved in ways that make them unaffected by the defenses? Because each defense trait might be at a different phase in the coevolution process, perhaps some would be effective defenses to herbivory, but others would not be effective. He predicted that monarchs would be harmed by all three milkweed defense traits (trichomes, latex, and cardiac glycosides), but that some would cause more harm than others.

To test his ideas, Anurag and his collaborators grew monarch caterpillars on 24 different North American milkweed species. They put a single newly hatched caterpillar on each plant and had five replicate plants per milkweed species. They recorded each caterpillar’s growth over the course of 5 days to see how healthy it was. They also measured the amount of trichomes, latex, and cardiac glycosides in each plant to determine their level of defense. Once they had their data, they looked for a relationship between caterpillar growth and plant defense traits to determine which made the best plant defenses. The better the defense, the less caterpillars would grow.

Featured scientist: Anurag Agrawal (He/Him/His) from Cornell University

Flesch–Kincaid Reading Grade Level = 8.5

Additional teacher resources related to this Data Nugget include:

  • Anurag has other examples, data, and related stories in his book: Monarchs and Milkweed, which is written for budding scientists and interested naturalists: www.amazon.com/dp/0691166358.
  • Students can learn more about Anurag, his research, and his lab at his website: www.herbivory.com which includes blog posts about monarch conservation, the community of insects on milkweed plants, videos of talks and presentations, and other things related to his research and teaching at Cornell University.
  • A scientific article based on this research: Agrawal, A. A., Fishbein, M., Jetter, R., Salminen, J. P., Goldstein, J. B., Freitag, A. E., & Sparks, J. P. (2009). Phylogenetic ecology of leaf surface traits in the milkweeds (Asclepias spp.): chemistry, ecophysiology, and insect behavior. New Phytologist183(3), 848-867.
  • Learn more about Anurag and his research in this YouTube video!

Purring crickets: The evolution of a new cricket song

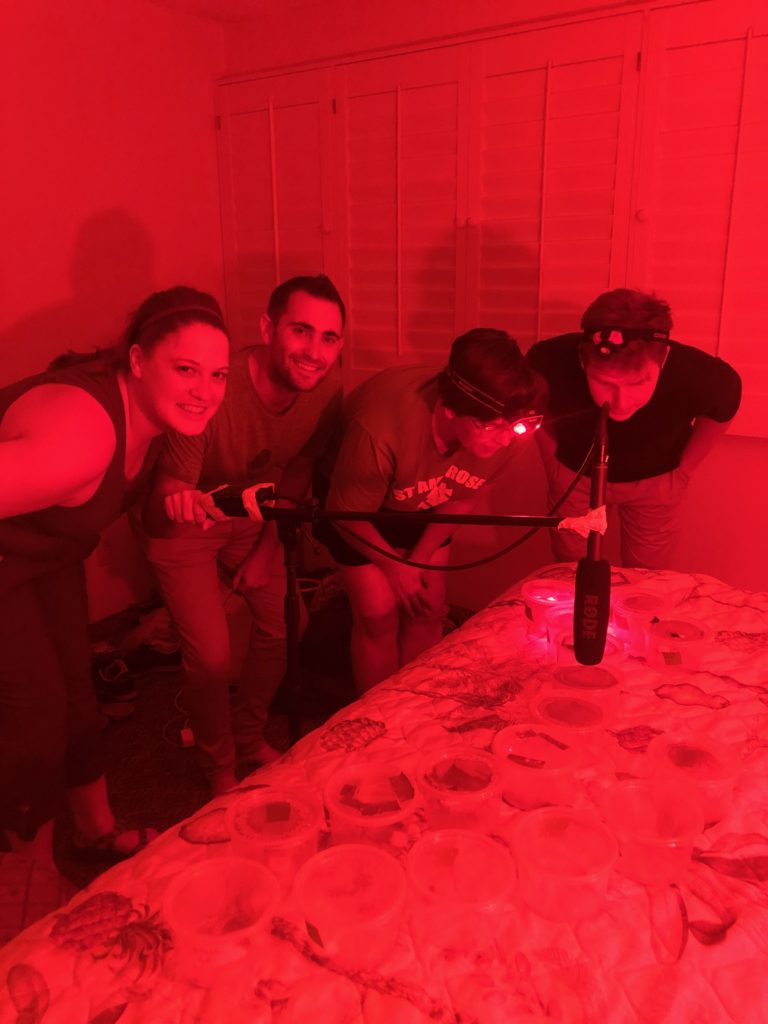
Robin’s team recording purring and typical cricket songs in the field. They analyzed the recordings and discovered that purring was a new song.

The activities are as follows:

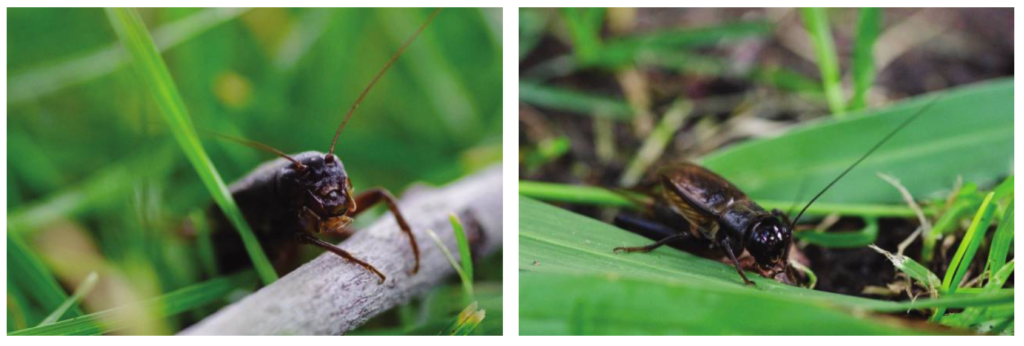
Animals use many types of mating signals to attract mates. Some of these signals are probably familiar to you, like the bright colors of birds’ feathers, complex courtship dances of fish, and loud calls of frogs. In crickets, males rub their wings together to produce chirping mating songs that attract females. However, in one species of cricket, these mating songs have led to an issue – while they attract females towards the male, they also attract parasitoid flies. These flies kill the crickets by eating them from the inside out! Parasitoids are animals that lay their eggs in another organism’s body. The eggs develop and usually kill the host.

About twenty years ago, scientists discovered male Pacific field crickets in several spots in Hawaii had stopped making songs. By looking at their wings and DNA, scientists were able to find the exact genetic mutation causing their silence. This change in DNA made some crickets to grow with flat wings that made no sound. Males with this mutation are able to escape detection by the parasitoid flies. However, being silent also posed a struggle because flat winged males could no longer use songs to attract female mates. Scientists waited and watched – would a new way to attract females evolve over time, one that is audible to females, but not to the flies?

Robin is a scientist who has been studying the mating signals in these crickets for many years. One summer, Robin was working in Hawaii and brought a Tupperware container full of crickets into her room. Suddenly, she heard what sounded like a purring cat, but there was no cat in sight. She soon realized the sound was coming from her container of crickets. This song was unlike anything ever observed before in crickets. 

Robin thought that this purring song might be the beginning of the evolution of a novel signal that could be detected by female crickets. If purring is a mating signal, female crickets should have a positive response to purring songs. One way to test this idea is to observe whether females move towards a purring song.

She set out to test her hypothesis with phonotaxis experiments in the lab. During phonotaxis experiments, scientists observe how an organism moves with respect to different sounds. In their first experiment, Robin and her colleagues placed a female at the center of an arena and played a purring song through 1 of 4 speakers. The other 3 speakers were silent. To document the female’s willingness to mate, Robin recorded if the female moved toward the purring and which speakers they contacted. If the purring song was not a mating signal, it should not be attractive to the females and she expected them to contact the speakers at random. This would mean that the purring speaker should be contacted 25% of the time (since only 1 of the 4 speakers broadcast purring). If the purring song was a mating signal, she expected female crickets to contact purring speakers more than 25% of the time.

In a second experiment, Robin investigated whether female crickets prefer purring songs as much as typical mating songs. Using the same set-up, she played either a typical or purring song through 1 of 4 speakers. If females moved toward the speaker playing a  song before the silent ones, she recorded the search time. Search time was calculated as the time it took the female to contact the broadcasting speaker minus the time at which the crickets started looking for the speaker. To see whether the purring song was evolving as a mating signal, she compared the time it took crickets to find speakers broadcasting the purring song compared to the typcal mating song. She predicted that if females still preferred the typical song more than the new song, that they would have longer search times for purring versus typical songs.

Left, a purring male from Moloka’i. Right, a purring male singing to attract mates. Photo credit: E. Dale Broder.

Featured scientist: Robin Tinghitella from The University of Denver.Written by: Gabrielle Welsh

Flesch–Kincaid Reading Grade Level = 9.3

Additional teacher resources related to this Data Nugget include:

Fishy origins

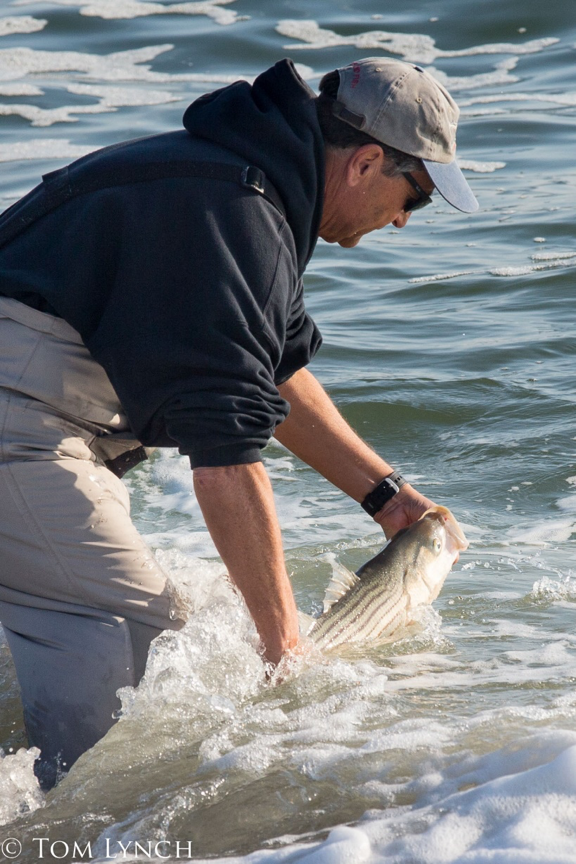
Fred Bogue holding a striped bass.

The activities are as follows:

Striped bass, or stripers, make up one of the most important fisheries for seafood and sport fishing on the East Coast of the United States. Carleigh and Chelsea, biology teachers in New Jersey, were at the beach one day when they saw a couple of stripers in the Barnegat Bay Inlet. Both teachers have always been interested in research and even met while participating in a summer research program as undergraduate students. Since then, both have gone on to complete more research projects in biology and education. Their curiosity about striper populations led them to work together yet again! 

They headed to Monmouth University in New Jersey, where they began working with two scientists, Megan and John. They learned that locations where fish reproduce are called spawning grounds. Young stripers spend 2-3 years developing in the spawning ground before moving downstream. When stripers become adults, they return to the same location to breed. 

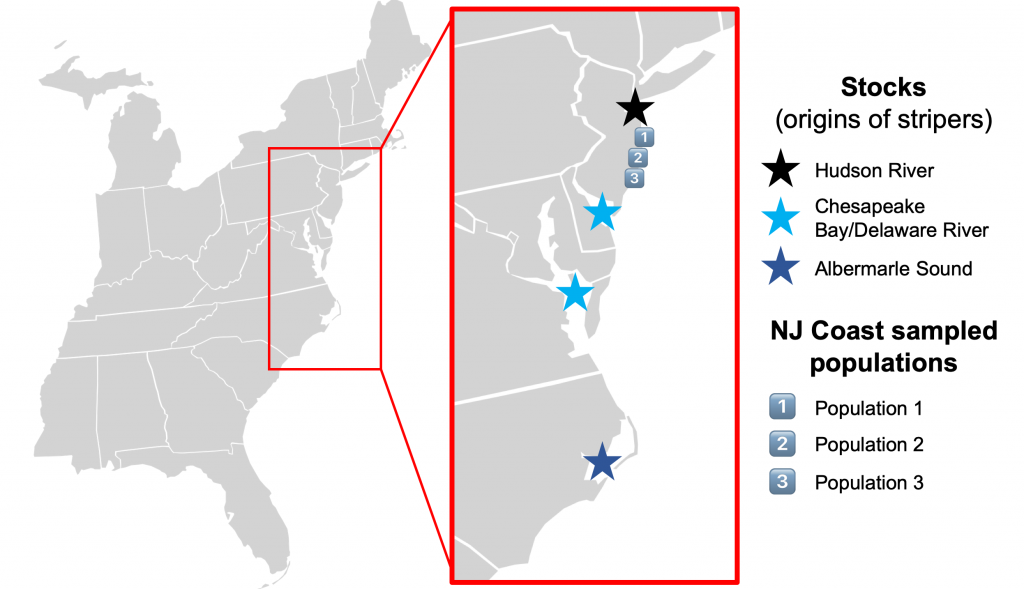
There are four main spawning grounds for stripers on the East coast: the Hudson River, the Chesapeake Bay, Delaware River, and the Albermarle Sound. Stripers from these areas are considered to be different stocks. Stripers are migratory fish, and generally move north in the spring and south in the fall. Because they all migrate to New Jersey, fish from different stocks combine, which results in a mixed stock. When there is a population that has a mixed stock, we don’t know which spawning ground the fish originally came from. Conservation and management of New Jersey’s striper fishery requires knowing where the fish come from. Understanding which spawning grounds stripers are using helps managers make sure we are not overfishing or damaging these important environments. So, Carleigh and Chelsea joined a project that is working to find out how we can identify where mixed stock stripers come from. 

For their study, the scientists caught stripers in three different locations off the New Jersey coast in 2017. The fish were sampled by clipping off a small portion of the right pelvic fin. The scientists then extracted the DNA from each sample in the lab. They used polymerase chain reaction (PCR) to then copy regions of the DNA, called microsatellites. Microsatellites are small, repeating sections of DNA that can be variable enough to distinguish even close relatives. These data were then used to compare DNA samples from the unknown mixed stocks to the known spawning ground stocks. The scientists also recorded whether each fish was young or mature. The scientists then used the age data to tell whether the spawning grounds might be changing over time. 

Featured scientists: Carleigh Engstrom, Chelsea Barreto, Megan Phifer-Rixey, and John Tiedemann from Monmouth University 

Flesch–Kincaid Reading Grade Level = 9.2

Fast weeds in farmer’s fields

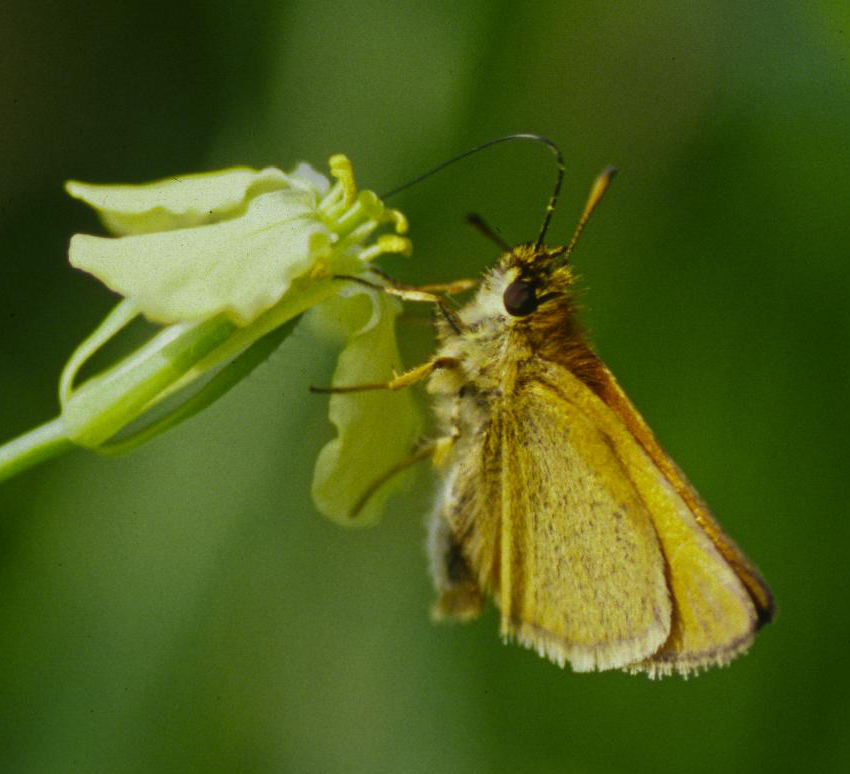
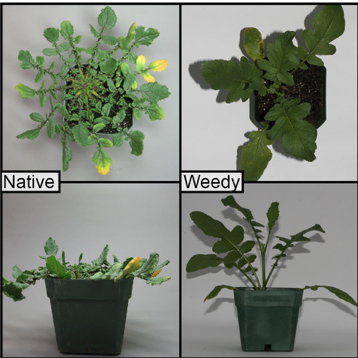
Native and weedy radish plants.

The activities are as follows:

Weeds in agricultural fields cost farmers $28 billion per year in just the United States alone. When fields are full of weeds the crops do not grow as well. Sometimes weeds even grow better than the crops in the same field. This may make you wonder, how do weeds grow so well compared to other types of plants? Scientists think that weeds may have evolved certain traits that allow them do well in agricultural fields. These adaptations could allow them to grow better and pass on more of their genes to the next generation.

Weedy radish is considered one of the world’s worst agricultural weeds. This plant has spread around the world and can now be found on every continent except Antarctica. Weedy radish commonly invades wheat and oat fields. It grows better than crops and lowers the amount of food produced in these fields. Weedy radish evolved from native radish only after humans started growing crops. Native radish only grows in natural habitats in the Mediterranean region. 

Because weedy radish evolved from native radish recently, they are still very closely related. They are so closely related they are actually listed as the same species. However, some traits have evolved rapidly in weedy radish. For example, native radish grow much slower and take a few months to make flowers. However, weedy radish can make flowers only three weeks after sprouting! In a farmer’s field, the crop might be harvested before a native radish would be able to make any seeds, while weedy radish had plenty of time to make seeds.

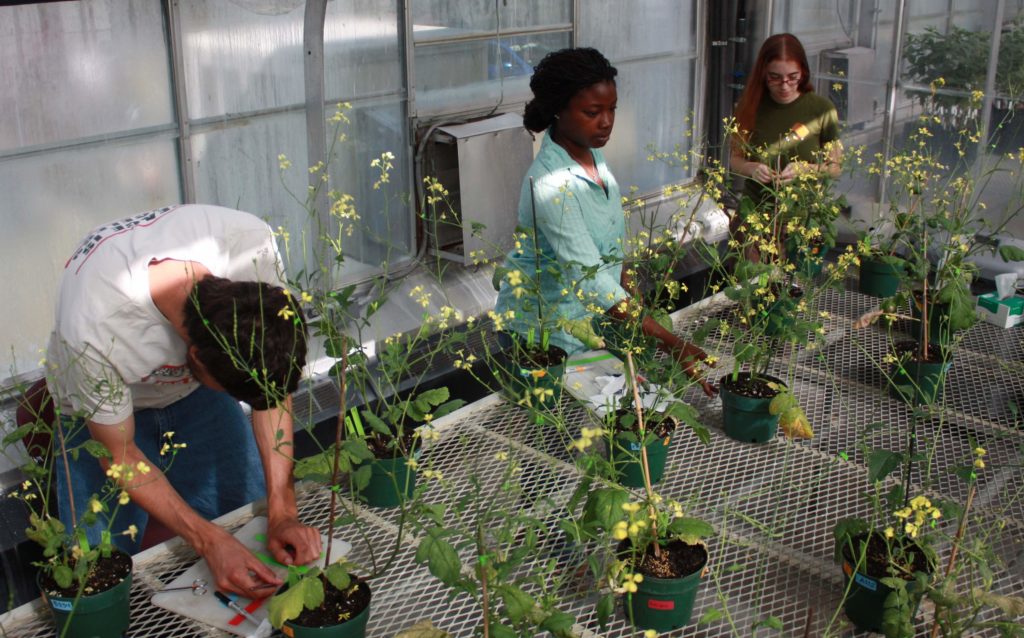
Ashley collecting data on the traits of weedy and native radish. 

The differences between native versus weedy radish interested Ashley, a teacher in Michigan. To learn more she sought out a scientist studying this species. She found Jeff, a plant biologist at the Kellogg Biological Station and she joined his lab for a summer to work with him. That summer, Ashley ran an experiment where she tested whether the rapid flowering and seed production of weedy radish was an adaptation to life in agricultural fields.

Ashley planted four populations of native radish and three populations of weedy radish into fields growing oat crops. Ashley made sure to plant multiple populations of radish to add replication to her experiment. Multiple populations allowed her to see if patterns were the same across populations or if each population grew differently. For each of these populations she measured flowering frequency. This trait is the total number of plants that produced flowers within the limited time between tilling and harvesting. Ashley also measured fitness, by counting the total number of seeds each plant produced over its lifetime. Whichever plant type produced a greater number of seeds had higher fitness. Oats only grow for 12 weeks so if radish plants were going to flower and make seeds they would have to do it fast. Ashley predicted the weedy radish population would produce more flowers and seeds than native radish during the study. Ashley expected few native radish plants would flower before harvest.

Featured scientists: Ashley Carroll from Gull Lake Middle School and Jeff Conner from the Kellogg Biological Station at Michigan State University

Flesch–Kincaid Reading Grade Level = 9.1

Hold on for your life! Part II

In Part I the data showed that, after the hurricanes, anole lizards had on average smaller bodies, shorter legs, and larger toe pads. The patterns were clear and consistent across the two islands, indicating that these traits are adaptations shaped by natural selection from hurricanes. At this point, however, Colin was still not convinced because he was unable to directly observe the lizards during the hurricane.

Still shot of lizard clinging to an experimental perch in hurricane-force winds. Wind speed meter is displaying in miles per hour

The activities are as follows:

Colin was unable to stay on Pine Cay and Water Cay during the hurricanes and directly observe the lizards. To be more confident in his explanation, Colin needed to find out how lizards behave in hurricane-force winds. He thought there were two options for what they might do. First, he thought they might get down from the branch and hide in tree roots and cracks. Alternatively, they might hold onto branches and ride out the storm. If they tried to hold on in high winds, it would make sense that traits like the length of their limbs or the size of their toepads would be important for their survival. However, if they hid in roots or cracks, these traits might not be adaptations after all.

To see how the lizards behaved, Colin needed to design a safe experiment that would simulate hurricane-force winds. He bought the strongest leaf blower he could find, set it up in his hotel room on Pine Cay, and videotaped 40 lizards as they were hit with high winds. Colin first set up this experiment to observe behavior, but he ended up learning not only that, but a lot about how the traits of the lizards interacted with high winds.

To begin the experiment, Colin placed the anoles on a perch. He slowly ramped up the wind speed on the leaf blower until the lizards climbed down or they were blown, unharmed, into a safety net. He recorded videos of each trial and took pictures. 

Featured scientist: Colin Donihue from Harvard University

Written with: Bob Kuhn and Elizabeth Schultheis

Flesch–Kincaid Reading Grade Level = 8.4

Additional teacher resources related to this Data Nugget:

  • This study was published in the journal Nature in 2018. Colin would like to thank his coauthors Anthony Herrel, Anne-Claire Fabre, Anthony Geneva, Ambika Kamath, Jason Kolbe, Tom Schoener, and Jonathan Losos. You can read the paper here.
  • Colin wrote a blog post about his experience. He shares more about the lead-up to the project and how a chance occurrence changed the entire trajectory of his research.
  • Colin also put together a story map with more images and animated gifs of this research.
  • We put together a PowerPoint of images from Colin’s research that you can show in class to accompany the activity.

To engage students in this activity, show the following video in class. This video gives some information on the experiment and Colin’s research.

Hold on for your life! Part I

Anolis scriptus, the Turks and Caicos anole, on Pine Cay.

The activities are as follows:

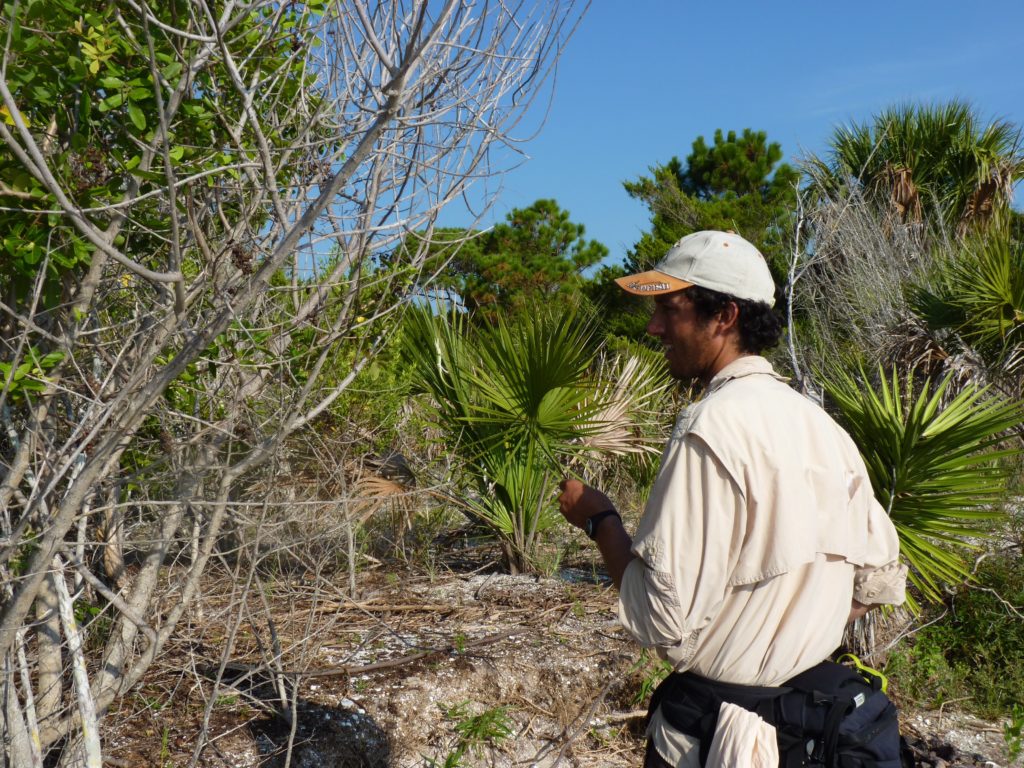
On the Caribbean islands of Turks and Caicos, there lives a small brown anole lizard named Anolis scriptus. The populations on two small islands, called Pine Cay and Water Cay, have been studied by researchers from Harvard University and the Paris Natural History Museum for many years. In 2017, Colin, one of the scientists, went to these islands to set up a long-term study on the effect of rats on anoles and other lizards on the islands. Unbeknownst to him, though, a storm was brewing to the south of the islands, and it was about to change the entire trajectory of his research.

While he was collecting data, Hurricane Irma was developing into a massive category 5 hurricane. Eventually it became clear that it would travel straight over these small islands. Colin knew that this might be the last time he would see the two small populations of lizards ever again because they could get wiped out in the storm. It dawned on him that this might be a serendipitous moment. After the storm, he could evaluate whether lizards could possibly survive a severe hurricane. He was also interested in whether certain traits could increase survival. Colin and his colleagues measured the lizards and vowed to come back after the hurricane to see if they were still there. They measured both male and female lizards and recorded trait values including their body size, femur length, and the toepad area on their forelimbs and hindlimbs.

Colin was not sure whether the lizards would survive. If they did, Colin formed two alternative hypotheses about what he might see. First, he thought lizards that survived would just be a random subset of the population and simply those that got lucky and survived by chance. Alternatively, he thought that survival might not be random, and some lizards might be better suited to hanging on for their lives in high winds. There might be traits that help lizards survive hurricanes, called adaptations. He made predictions off this second hypothesis and expected that survivors would be those individuals with large adhesive pads on their fingers and toes and extra-long legs – both traits that would help them grab tight to a branch and make it through the storm. This would mean the hurricanes could be agents of natural selection.

Not only did Hurricane Irma ravage the islands that year, but weeks later Hurricane Maria also paid a visit. Upon his return to Pine Cay and Water Cay after the hurricanes, Colin was shocked to see there were still anoles on the islands! He took the measurements a second time. He then compared his two datasets from before and after the hurricanes to see if the average trait values changed.

Featured scientist: Colin Donihue from Harvard University

Written with: Bob Kuhn and Elizabeth Schultheis

Flesch–Kincaid Reading Grade Level = 9.9

Additional teacher resources related to this Data Nugget:

  • This study was published in the journal Nature in 2018. Colin would like to thank his coauthors Anthony Herrel, Anne-Claire Fabre, Anthony Geneva, Ambika Kamath, Jason Kolbe, Tom Schoener, and Jonathan Losos. You can read the paper here.
  • Colin wrote a blog post about his experience. He shares more about the lead-up to the project and how a chance occurrence changed the entire trajectory of his research.
  • Colin also put together a story map with more images and animated gifs of this research.
  • We put together a PowerPoint of images from Colin’s research that you can show in class to accompany the activity.

To engage students in this activity, show the following video in class. This video gives some information on the experiment and Colin’s research. For Part I stop the video at minute 1:30.

What big teeth you have! Sexual selection in rhesus macaques

Cayo Santiago rhesus macaques. Photo by Raisa Hernández Pacheco.

The activities are as follows:

It is easy to identify a deer as male when you see his huge antlers, or a peacock as male by his stunning set of colorful tail feathers. But you may wonder, how do these traits come about, and why don’t both males and females have them? These extravagant traits are thought to be the result of sexual selection. This process happens when females mate with males that they think have the sexiest traits. These traits get passed on to future male offspring, leading to a change in the selected traits over time. Because females are only choosing these traits in males, sexual selection often leads to sexual dimorphism between males and females. This means that the sexes do not look the same. Often males will be larger and have more elaborate traits than females.

Craniums of an adult male (left) and an adult female (right) rhesus macaque. Photo by Raisa Hernández Pacheco and Damián A. Concepción Pérez.

One species that shows strong sexual dimorphism is rhesus macaques. In this species of monkey, males are much larger than females. Cayo Santiago is a small island off the shore of Puerto Rico. On this island lives one of the oldest free-ranging rhesus macaque colonies in the world. This population has no predators and food is plentiful. Scientists at Cayo Santiago have gathered data on these monkeys and their habitat for over 70 years. Every year when new monkeys are born they are captured, marked with a unique tattoo ID, and released. This program allows scientists to monitor individual monkeys over their entire lives and record the sex, date of birth, and date of death. Once a monkey dies and its body is recovered in the field, skeletal specimens are stored in a museum for further research.

Damián measuring canine length in a rhesus macaque skeletal specimen. Photo by Raisa Hernández Pacheco.

These skeletal specimens can be used by scientists today to ask new and exciting questions. Raisa and Damián are both interested in studying sexual dimorphism in rhesus macaques. They want to find out what causes the differences between the sexes. They chose to focus on the length of the very large canine teeth in male and female macaques. They expected that canine teeth may be under sexual selection in males for two reasons. First, rhesus macaques are mostly vegetarians, so they don’t need long canines for the same purpose as other meat-eating species that use them to catch prey. Second, male rhesus macaques often bare their teeth at other males when they are competing for mates. Females could see the long canines as a sign of good genes and may prefer to mate with that trait. Excited by these ideas, Raisa and Damián set out to investigate the museum’s skeletal specimens to check whether there is sexual dimorphism in canine length. This is the first step in collecting evidence to see whether male canines are under sexual selection by females.

They measured canine length of four male and four female rhesus skeletal specimens dating back to the 1970s. Measurements were only taken from individuals that died as adults to make sure canines were fully developed and that differences in length could not be attributed to age. Raisa and Damián predicted that males would have significantly longer canines compared to those of females. If so, this would be the first step to determine whether sexual selection was operating in the population.

Featured scientists: Raisa Hernández-Pacheco from University of Richmond and Damián A. Concepción Pérez from Wilder Middle School. Research conducted at the Laboratory of Primate Morphology at the University of Puerto Rico Medical Sciences Campus. Skeletal specimens came from the population of rhesus macaques on Cayo Santiago.

Flesch–Kincaid Reading Grade Level = 9.8

Damián and Raisa created a teaching module, called Unknown Bones. It is an inquiry-based educational activity for high school students in which they apply data analysis and statistics to understand sexual selection and illustrate sexual dimorphism in Cayo Santiago rhesus macaques.


About Raisa: I am interested in understanding the drivers shaping population dynamics, and have dedicated my studies to modeling the effects of biotic and abiotic factors on populations of invertebrates and vertebrates. In 2013, I obtained my PhD from the University of Puerto Rico after assessing the effects of mass bleaching on Caribbean coral populations. Right after, I joined the Caribbean Primate Research Center and the Max-Planck Odense Center to study the long-term dynamics of the Cayo Santiago rhesus macaque population. At the Grayson lab, I am studying the population of red-backed salamanders in Richmond; its density, spatial arrangement, and space use.


About Damián: I am a middle and high school Science and Math teacher. I have always been searching for innovative ways to get my students engaged in the science classroom and to connect their new knowledge with the real-world. In thinking of ways to help my students learn, I engaged my self with the scientific community collaborating in scientific projects and creating hands-on, interactive, and inspiring teaching lessons. It is my main interest to develop ideas that could positively contribute to any student’s STEM education.

SaveSave

SaveSave

SaveSave

SaveSave

SaveSave

SaveSave

SaveSave

SaveSave